


 Abstract
 HTML
HTML Reference
 Related
 PDF
PDF


-
Ridge phenomena, i.e., the azimuthal angle (ϕ) correlations on the long pseudo-rapidity (or polar angle θ) range between the triggered hadrons and associated hadrons, were first observed in relativistic heavy ion collisions at the RHIC [1–4] and then at the LHC [5–9]. They have been studied extensively and considered important signals of the thermal collective effects of the expansion of the hot dense matter such as Quark-Gluon Plasma (QGP). Hydrodynamic flows have been correspondingly measured for the nontrivial azimuthal distributions in most of the above mentioned experiments [1–4, 6–9]. Similar phenomena are also observed from events with large hadronic multiplicities in various small system collision processes such as proton-proton collisions [10–13], proton-nucleus collisions [14–23], and lighter nucleus-nucleus collisions [23–26]. This correlation has also been studied in other scattering processes, such as
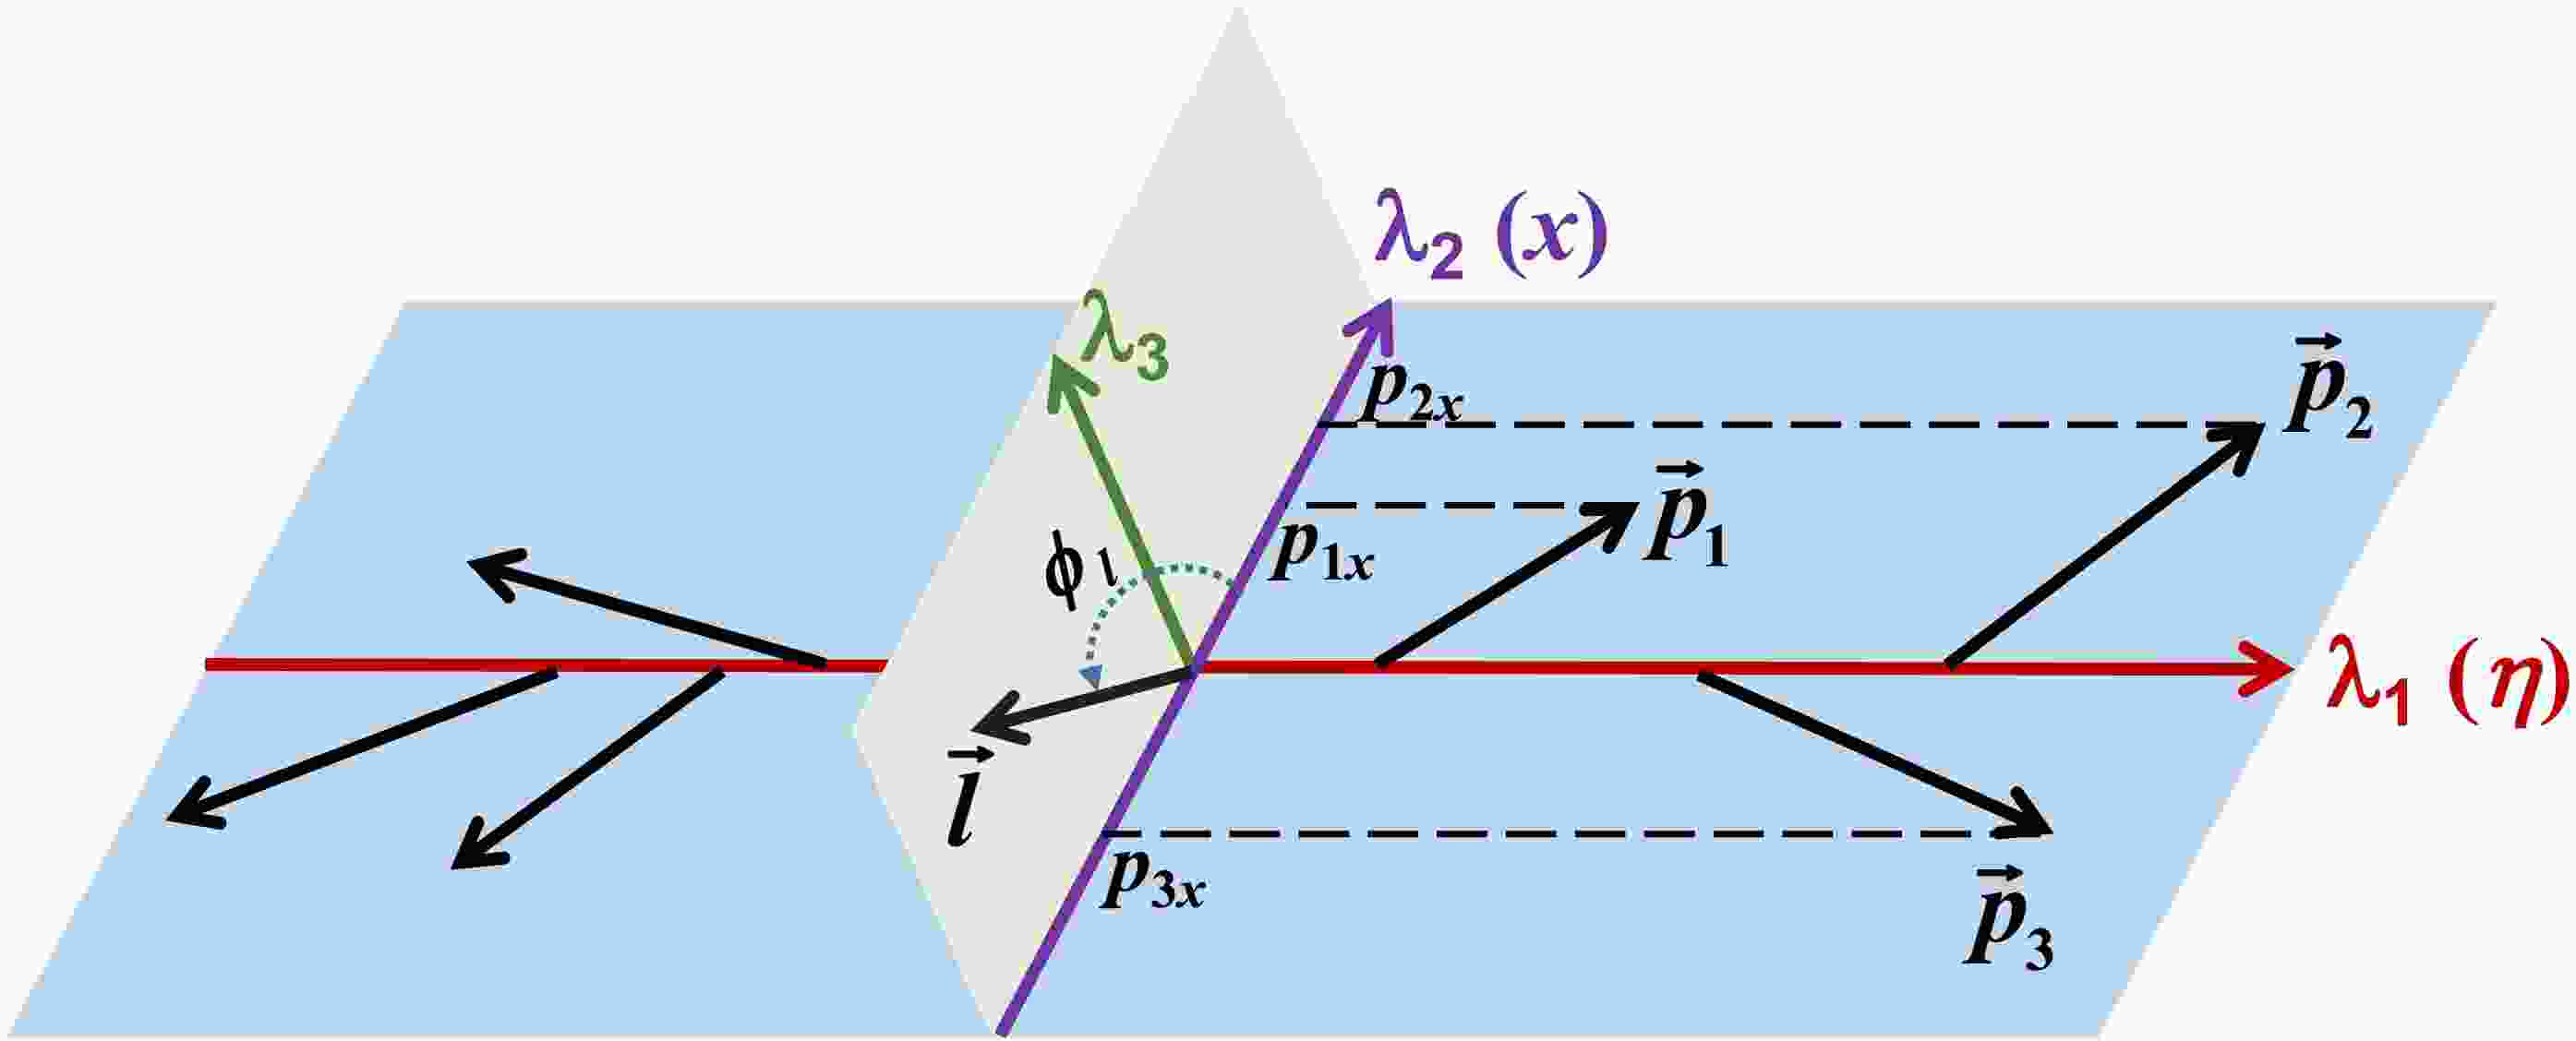
$ e^+e^- $ annihilation at low energies [27, 28], electron-proton collisions [29, 30], photon-proton collisions [31], and photon-nuclear reactions [32]. Recently, interesting implications regarding Ridge phenomena have been found in the studies on single hard jets by the CMS collaboration [33, 34] and in$ e^+e^- $ annihilation at LEPII energies [35]. In these small system scatterings, the collective behaviors and production of QGP droplets, which had been assumed to be absent traditionally, were introduced to explain the observed Ridge correlations [36–59]. However, the "precursors" [59] or dynamics of the anisotropy that lead to the Ridge correlations in small system scatterings remain unclear. In this paper, we study the azimuthal anisotropy of multiple hard jet systems in$ e^+e^- $ annihilation and the corresponding Ridge correlations within the framework of perturbative Quantum Chromodynamics (pQCD).The Ridge correlation is the global property of the event and manifests that the global phase space is planar. Two key ingredients lead to the Ridge phenomena in relativistic heavy ion collisions: one is the initial geometric anisotropy of non-central collisions as input, and the other is the intermediate multi-interaction and collective behaviors of the bulk system which can transfer this anisotropy to the phase space of the final state hadron system. As a result, the plane is stretched by the pseudo-rapidity direction (to define the polar angle) and a special transverse direction (to define the azimuthal angle) for each specific event. The hadronic momentum distribution is favored around this plane. In Fig. 1, we illustrate the most extreme case where all hadron momenta are on the same plane. One can observe a joint distribution on
$ \Delta \phi $ and$ \Delta \eta $ as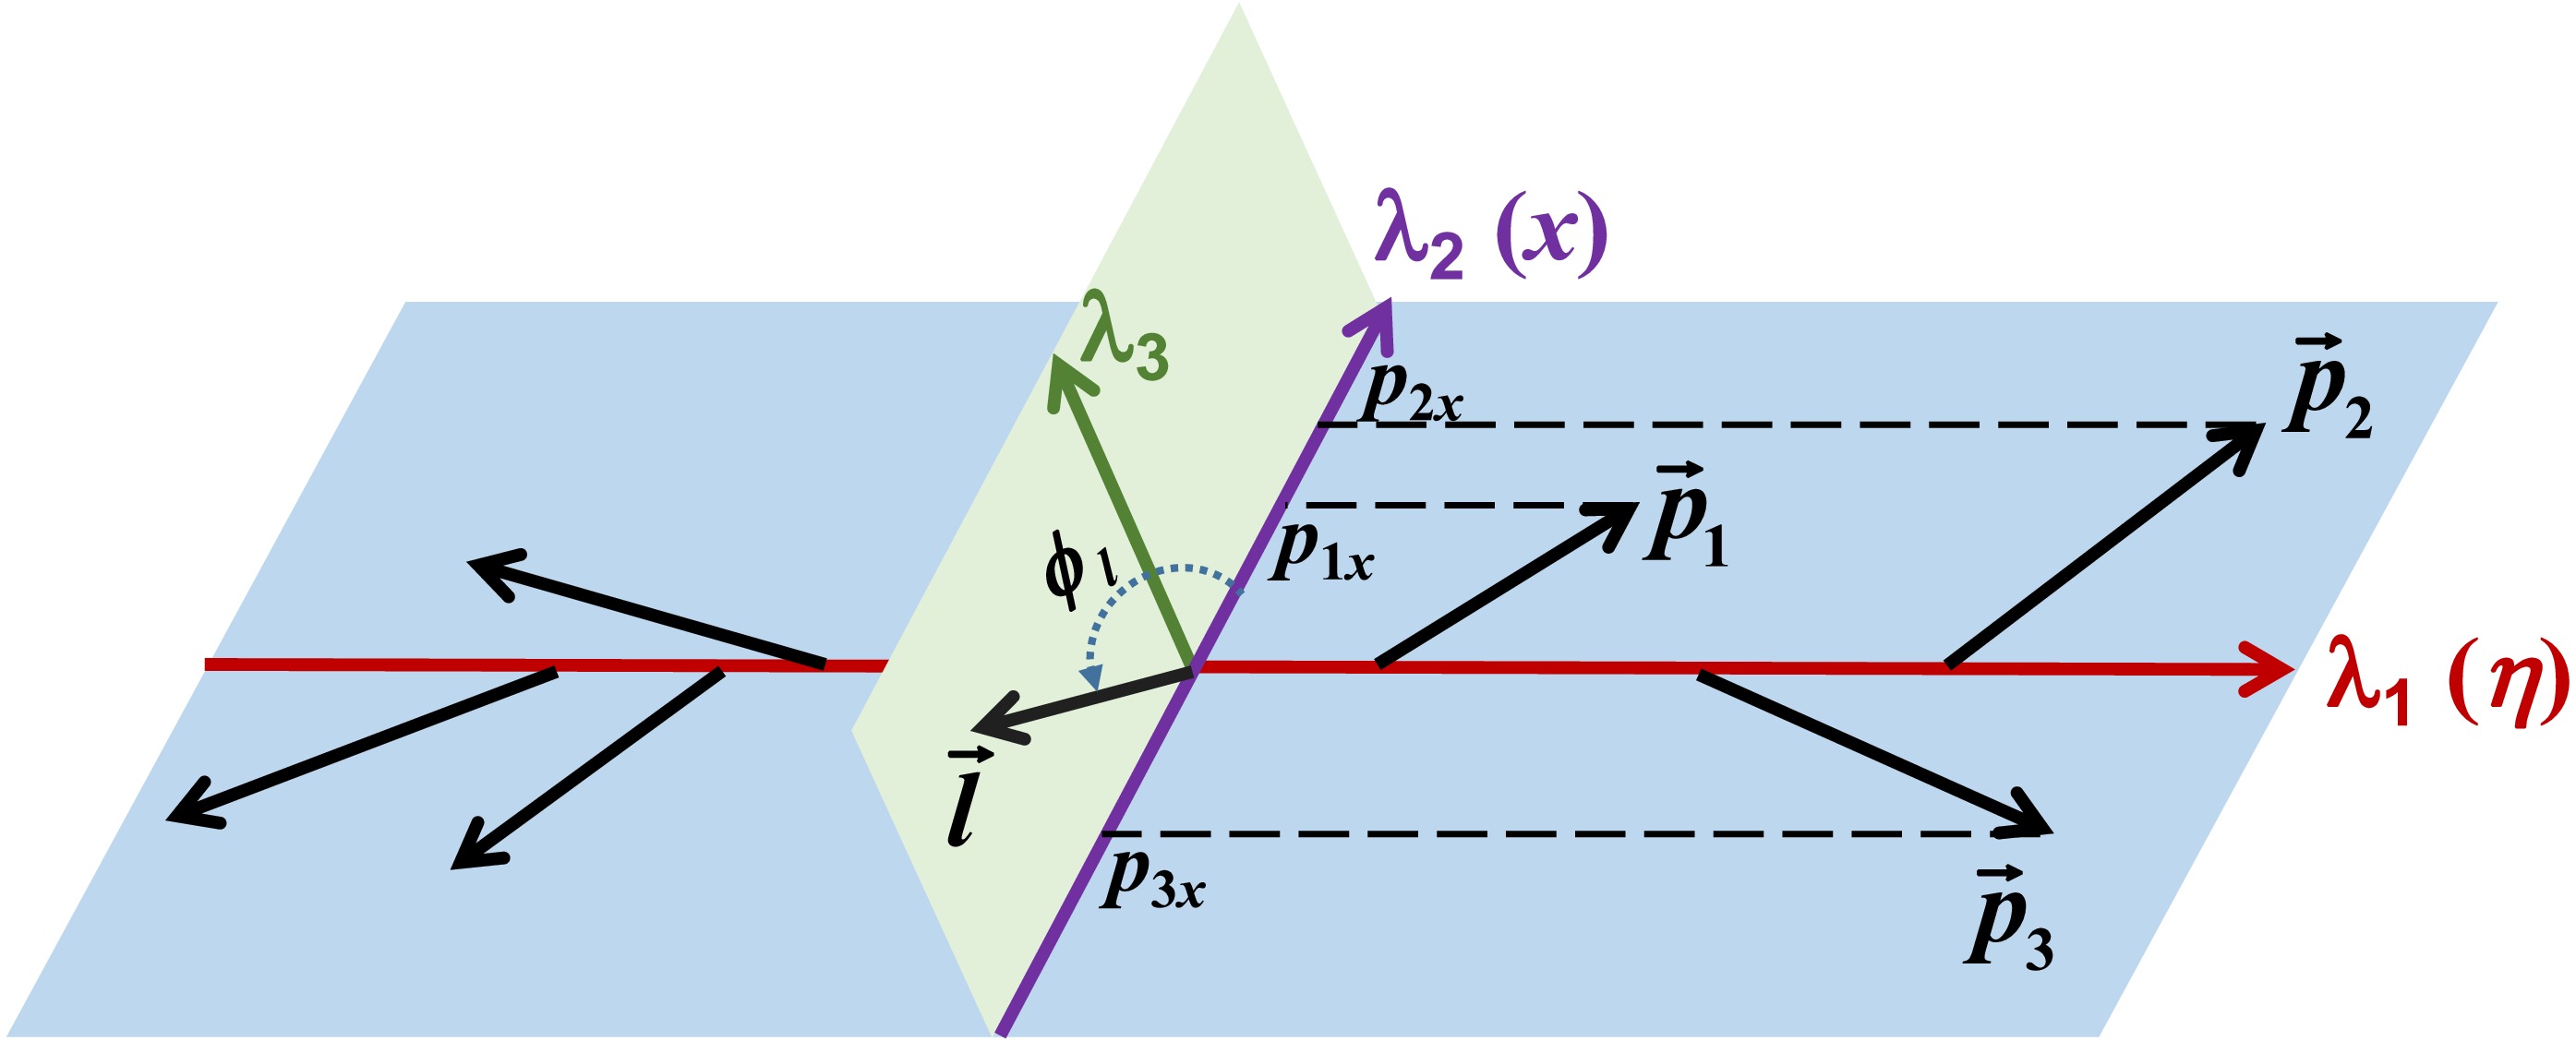
Figure 1. (color online) Extreme planar event sample with all hadrons in the same plane. The three sphericity axis (see Section II.A) are marked by the eigenvalues
$ {\bf{\lambda_1}} $ ,$ {\bf{\lambda_2}} $ , and$ {\bf{\lambda_3}} $ (=0).$ f(\Delta \phi, \Delta \eta)= (c_1 \delta(\Delta \phi)+ c_2 \delta(\Delta\phi-\pi)) \times \theta(\eta_0-|\Delta \eta|) \times g(\Delta \eta), $
(1) where
$ \theta (x) $ is the Heaviside step function with$ \eta_0 $ $ (>0) $ a parameter for the range of the `Ridge' in the pseudo-rapidity direction determined by the available hadron pseudo-rapidities, and$ g(\Delta \eta) $ is a slow-varying function. The real data are obtained by smearing and fluctuating this extreme distribution and hence look like the 'Ridge'1 .The above analysis emphasizes that the initial geometric anisotropy is transferred by the collective behaviors to the final state hadrons as the Ridge correlation in heavy ion collisions. If any other type of anisotropy exists and could be translated to the final state, a similar behavior could be observed. We have suggested [60] that the hard scatterings and radiations can lead to significantly planar phase space. This dynamical anisotropy can be one of the precursors of the final state Ridge phenomena in the small system collisions. In heavy ion collisions, dynamical anisotropy can be smeared in the thermalization or by multi-parton interactions but still provides important information for probing the properties of the QGP.
We take the
$ e^+e^- $ annihilation process to study the anisotropy from the hard interactions and radiations since it is free from initial state hadrons or initial anisotropy for unpolarized beams. For the 3-jet events, the jet momenta construct a triangle in the center-of-mass frame because of momentum conservation, and must be in a plane since our space is Euclidean. This is not only a theoretical expectation, but plays the key role in the discovery of the gluon jet. The first 3-jet event caught by the TASSO collaboration critically employed the planar property of the corresponding final state hadrons [61, 62]. For an event with higher multiplicity of jets, their momenta are not necessarily restricted to a plane. Our previous study [60], by employing the event generator PYTHIA [63], shows that most of the events are not isotropic but planar for the reason of energy momentum conservation. The planar events are not strongly correlated with hadron multiplicity. To quantify the precise impact of hard scatterings among multiple jets, we study the above mentioned planar properties of the inclusive 3-jet production at the full NNLO pQCD2 . The results obtained with the pQCD well-defined jet momenta to make the investigations show significant planar property and the Ridge-like correlations3 . So consequently our pQCD calculation provides benchmarks for further study of the effects from pQCD resummation, parton shower, multi-parton interaction, preconfinement, as well as hadronization and (possible) thermal behaviors in both partonic and hadronic phases [59, 60]. As to estimate the affections of the planar property from the hard interactions to the final states, we will also review part of the results of [60]. In this paper, we concentrate on the$ e^+e^- $ annihilation events at the Z-pole. From the investigations in [60], such events share the similar planar property as events in LEPII [35]. The methods and conclusions of this paper can be applied to LEPII as well as CEPC energies. Here we also point out that the event shape had also been measured in proton-proton scatterings at the LHC [64]. An extension of current study could be performed at the NNLO accuracy based on the inclusive hadronic 3-jet production at the LHC [65–67].The calculation of jet observables from
$ e^+e^- $ annihilation with higher order QCD corrections requires consistent cancellation of the infrared singularities. Three independent studies have achieved NNLO accuracy for the inclusive 3-jet production [68–76]. Our fixed order calculation is based on the publicly available code EERAD3 [69, 70, 76], which was later implemented in the NNLOJET event generator [76, 77]. The antenna subtraction method [66, 67, 78–81] is applied to remove the infrared divergences such that the multi-dimensional phase space integration can be performed with the aid of the adaptive Monte Carlo integrator VEGAS [82]. We implement the event shape observables studied in this work in NNLOJET [77]. During this study, an efficient framework utilizing generalized antenna functions was applied to the inclusive 3-jet production at NNLO [83].The remainder of the paper is organized as follows. In Section II, we introduce the event shape observables employed to investigate the planar property. In Section III, we study the differential distribution of these observables and Ridge-like correlations with various values of jet resolution parameter, and the results of the scale variation are provided. Finally, the conclusion and discussion are presented in Section IV.
-
We focus on event shape observables such as the linearized sphericity tensor (
$ S^{jk} $ ) and its three eigenvalues ($ \lambda_{1}, \lambda_{2} $ , and$ \lambda_{3} $ ), modified planarity ($ \tilde{P} $ ), and the Ridge correlation with respect to the jet momenta in the inclusive 3-jet events at NNLO and the inclusive 4-jet events at NLO.These observables are all related to the planarity of the events. Specifically,
$ \lambda_1 $ ,$ \lambda_2 $ ,$ \lambda_3 $ , and$ \tilde{P} $ are infrared (IR)-safe at the parton level. In contrast, the Ridge correlation is not IR-safe at the parton level; thus, we calculate its distribution at the jet level with the Durham jet algorithm. Accordingly, the observables related to event planarity—including$ \lambda_1 $ ,$ \lambda_2 $ ,$ \lambda_3 $ , and$ \tilde{P} $ —are also computed at the jet level to corroborate the Ridge correlation. These jet-defined observables can be directly compared with experimental data.The linearized sphericity tensor is [63, 84, 85]
$ S^{jk}=\dfrac{\displaystyle\sum\nolimits_i \dfrac{p_i^j p_i^k}{\left|{\bf{p}}_i\right|}}{\displaystyle\sum\nolimits_i\left|{\bf{p}}_i\right|}, $
(2) where
$ {\bf{p}}_{i} $ denotes the three-momentum of jet i, and the summation is performed over all final state jets in an event. Here,$ j,k=1,2,3 $ correspond to the three spatial components. The symmetric 3$ \times $ 3 matrix S has three real eigenvalues and three mutually orthogonal eigenvectors corresponding to these eigenvalues. The determination of these eigenvalues involves solving the characteristic equation of S, which is a cubic equation and the roots can be analytically solved using the Shengjin Formula [86] (see Appendix A). For Euclidean space, considering only the cases with real solutions is sufficient. These three eigenvalues can be ordered as$ \lambda_{1} \geqslant \lambda_{2} \geqslant \lambda_{3}\geqslant 0 $ , with$ \lambda_{1} + \lambda_{2} + \lambda_{3}=1 $ , such that$ \lambda_1 $ is constrained within the range$ \left[\dfrac{1}{3}, 1\right] $ . Events in which all hard partons are closely aligned in a collinear direction (the back-to-back limit) correspond to$ \lambda_1 \approx 1 $ , whereas an approximately isotropic event corresponds to$ \lambda_1 \approx {1}/{3} $ .$ \lambda_{2} $ is restricted to the interval$ \left[0, \dfrac{1}{2}\right] $ . In a planar event, the plane is defined by the eigenvectors corresponding to$ \lambda_{1} $ and$ \lambda_{2} $ .$ \lambda_{3} $ is bounded between$ \left[0, \dfrac{1}{3}\right] $ . It measures the transverse momentum component out of the event plane: a planar event has$ \lambda_{3}=0 $ , whereas an approximately isotropic event has$ \lambda_{3} \approx {1}/{3} $ .We define the modified planarity
$ \tilde{P} $ as$ \tilde{P}=\dfrac{\lambda_{2}-\lambda_{3}}{\lambda_{2}+\lambda_{3}}, $
(3) which is constrained to the range
$ \left[0, 1\right] $ . It measures the planarity of an event: a planar event has$ \tilde{P}=1 $ , whereas an approximately isotropic one has$ \tilde{P} \approx 0 $ . For$ e^{+}e^{-} $ annihilation to the inclusive 3 jets,$ \lambda_{2} $ is rather small although much larger than$ \lambda_{3} $ for most of the events (which are planar). Consequently, if we only use$ \lambda_{2}-\lambda_{3} $ , it will always peak around small values and cannot indicate whether the event is planar or spherical.The Ridge correlation is the joint distribution of
$ \Delta \phi $ and$ \Delta \eta $ between final state jets momenta from the same event, defined as$\begin{aligned}[b] R(\Delta \phi, \Delta \eta)=&\dfrac{1}{\sigma}\dfrac{{\rm d}^2\sigma}{{\rm d}\Delta \phi {\rm d}\Delta \eta} =\dfrac{1}{\sigma}\sum\limits_{i<j}\int {\rm d}\Delta\phi_{ij} {\rm d} \Delta\eta_{ij}\\ & \times \left(\dfrac{{\rm d}^2\sigma}{{\rm d}\Delta \phi_{ij} {\rm d}\Delta \eta_{ij}}\right)\delta(\Delta\phi_{ij}-\Delta\phi)\delta(\Delta\eta_{ij}-\Delta\eta),\end{aligned} $
(4) where
$ i,j=1,2,...,n $ , and n denotes the jet multiplicity of the event;$ \Delta \phi $ and$ \Delta \eta $ represent the differences in azimuthal angles and pseudo-rapidities of jets, respectively. In our study, we use the direction of the eigenvector associated with the largest eigenvalue$ \lambda_1 $ to define the polar angle. The eigenvector associated with$ \lambda_1 $ is obtained using the power method [87]. Initially, an initial vector${\bf{x}}_0$ is repeatedly multiplied by the linearized sphericity matrix S. This process ensures that the resulting vector converges towards the eigenvector associated with the largest eigenvalue$ \lambda_1 $ . However, if${\bf{x}}_{1}$ is an eigenvector corresponding to$ \lambda_1 $ , then$-{\bf{x}}_{1}$ is equally valid as an eigenvector for the same eigenvalue. Selecting the eigenvector with forward rapidity in the lab frame as our convention, we ensure that our final result is symmetric in$ \Delta\eta $ :$ R(\Delta\phi,\Delta\eta)=R(\Delta\phi,-\Delta\eta), $
(5) which is a consequence of the parity conservation in QCD. Subsequently, the angle between the jet momentum
$ {\bf{p}} $ and the axis$ {\bf{x}}_{1} $ is given by$ \theta=\arccos ({\bf{x}}_{1} \cdot {\bf{p}}/|{\bf{x}}_{1}||{\bf{p}}|). $
(6) Thus, we can calculate the pseudo-rapidity as
$ \eta=-\ln (\tan (\theta/2)). $
(7) $ \Delta\phi_{ij} $ between two jets with momenta$ {\bf{p}}_{i} $ and$ {\bf{p}}_{j} $ is$ \Delta \phi_{ij}=\arccos \left({\bf{p}}_{i\perp} \cdot {\bf{p}}_{j\perp} /\left|{\bf{p}}_{i\perp}\right|\left|{\bf{p}}_{j\perp}\right|\right) $
(8) where
$ {\bf{p}}_{\perp} $ is the momentum perpendicular to the axis$ {\bf{x}}_{1} $ .When employing a small jet resolution parameter, one encounters contributions from relative soft jets. To extract the properties of hard interactions, we introduce the energy-weighted Ridge correlation [88, 89],
$\begin{aligned}[b] R_{EE}(\Delta \phi, \Delta \eta)=&\dfrac{1}{\sigma}\sum\limits_{i<j}\int {\rm d}\Delta\phi_{ij} {\rm d} \Delta\eta_{ij}\dfrac{4E_i E_j}{s}\\ & \times\left(\dfrac{{\rm d}^2\sigma}{{\rm d}\Delta \phi_{ij} {\rm d}\Delta \eta_{ij}}\right)\delta(\Delta\phi_{ij}-\Delta\phi)\delta(\Delta\eta_{ij}-\Delta\eta),\end{aligned} $
(9) where s is the squared centre-of-mass energy;
$ E_i $ and$ E_j $ denote the energies of each of two jets. We note that$ R_{EE}(\Delta \phi, \Delta \eta) $ is also infrared safe at the parton level. -
We choose the centre-of-mass energy at the Z-pole with
$ \sqrt{s}=m_Z=91.19\ {\rm{GeV}} $ . The dominant contribution to jets production is$ e^{+}e^{-}\rightarrow \gamma^{\ast} / Z\rightarrow $ jets. Additionally, we set the strong coupling constant at$ \alpha_s(m_{Z})=0.118 $ . For the electroweak gauge coupling constant, we use the$ G_{\mu} $ -scheme [90] with$G_{\mu}=1.1663787\times 10^{-5}\; {\rm{GeV}}^{-2}$ and$m_{W}= 80.379 \; {\rm{GeV}}$ . The central values of the renormalization and factorization scale are set to the centre-of-mass energy,$ \mu_{R}=\mu_{F}=m_{Z} $ . To estimate the systematic uncertainty in our calculations, we vary$ \mu_{R} $ and$ \mu_{F} $ following the 7-point scale variations:$ \begin{aligned}[b]\mu_{R}\to k_{\mu_{R}}\mu_{R},\quad \mu_{F}\to k_{\mu_{F}}\mu_{F}, \end{aligned} $
(10) with
$ (k_{\mu_{R}}, k_{\mu_{F} })\in \bigg\{(1,1), \; \left(1,\dfrac{1}{2}\right), \; (1,2), \; \left(\dfrac{1}{2},1\right), \; (2,1), \; \left(\dfrac{1}{2}, \dfrac{1}{2}\right), \; (2,2) \bigg\} $ .Throughout the computation, we employ the exclusive Durham jet algorithm [91] with the E-scheme to cluster partons into jets with the resolution parameter
$ y_{\text{cut}} \in [10^{-4},10^{-2}] $ [92]. As$ y_{\text{cut}} $ approaches very small values (i.e.,$ y_{\text{cut}} \sim 10^{-4} $ ), events approaching the back-to-back limit are allowed, revealing the large logarithmic corrections of pQCD.To validate the NNLO calculation of
$ e^+e^-\rightarrow 3 $ jets implemented in NNLOJET, we compare the perturbative coefficients [93]$ C_3 $ and$ C_4 $ of jet rates between NNLOJET and CoLoRFulNNLO [94], and$ C_{5} $ between NNLOJET, CoLoRFulNNLO, and Sherpa [95] with different$ y_\text{{cut}} $ values. The results of$ C_3 $ ,$ C_4 $ , and$ C_{5} $ between NNLOJET and CoLoRFulNNLO are consistent within the margin of error, except for$ y_{\text{cut}}=2.49\times 10^{-4} $ . The results of$ C_{5} $ between NNLOJET and Sherpa are consistent within the margin of error. A further detailed analysis is given in Appendix B. -
In this section, we present the numerical results of the event shape observables relevant to planarity as discussed in Section II.A. In Section III.A, we compute the cross sections for the production of the inclusive n-jet events (for n = 3, 4, 5) at fixed order, with various values of
$ y_{\text{cut}} $ . In Section III.B, we examine the differential cross sections of$ \lambda_1 $ ,$ \lambda_2 $ ,$ \lambda_3 $ , and$ \tilde{P} $ . Finally, the joint distribution observables$ R(\Delta \phi, \Delta \eta) $ and$ R_{EE}(\Delta \phi, \Delta \eta) $ are explored in Section III.C. -
The cross sections for the production of the inclusive n-jet (where n = 3, 4, 5) at fixed order for various values of
$ y_{\text{cut}} $ demonstrate the shift in the fraction of the exclusive n-jet events with changes in$ y_{\text{cut}} $ . Table 1 presents the cross sections (in fb) for the production of the inclusive 3-jet at NNLO, the inclusive 4-jet at NLO, and the inclusive 5-jet at LO for$ y_{\text{cut}} = 10^{-2},10^{-2.5},10^{-3},10^{-3.5},10^{-4} $ . Each row corresponds to a distinct$ y_{\text{cut}} $ value, whereas each column corresponds to a different jet multiplicity. The numbers as superscripts and subscripts indicate the systematic errors resulting from the scale variations according to equation (10), and those within parentheses denote the statistical errors.$ y_{\text{cut}} $ 3-jet (NNLO) 4-jet (NLO) 5-jet (LO) $ 1\cdot10^{-2.0} $ $ 1.594(3)^{+0.018}_{-0.030}\cdot 10^{7} $ $ 2.0016(7)_{-0.245}^{+0.280}\cdot 10^{6} $ $ 4.775(4)_{-1.129}^{+1.833}\cdot 10^{4} $ $ 1\cdot10^{-2.5} $ $ 2.59(1)^{+0.007}_{-0.033}\cdot10^{7} $ $ 7.343(4)^{+0.959}_{-0.862}\cdot10^{6} $ $ 5.523(4)_{-1.129}^{+2.476}\cdot 10^{5} $ $ 1\cdot10^{-3.0} $ $ 3.55(1)^{+0.006}_{-0.053}\cdot 10^{7} $ $ 1.8516(7)_{-0.198}^{+0.205}\cdot10^{7} $ $ 3.017(2)_{-0.777}^{+1.192}\cdot 10^{6} $ $ 1\cdot10^{-3.5} $ $ 4.27(2)^{+0.095}_{-0.163}\cdot10^{7} $ $ 3.656(2)^{+0.276}_{-0.322}\cdot10^{7} $ $ 1.1181(5)_{-0.288}^{+0.442}\cdot 10^{7} $ $ 1\cdot10^{-4.0} $ $ 4.47(3)^{+0.257}_{-0.343}\cdot10^{7} $ $ 5.954(4)_{-0.329}^{+0.080}\cdot10^{7} $ $ 3.261(5)_{-0.841}^{+1.288}\cdot 10^{7} $ Table 1. Inclusive n-jet cross sections (in fb) at fixed order with different
$ y_{\text{cut}} $ values. Each row corresponds to a distinct$ y_{\text{cut}} $ value, whereas each column corresponds to a different jet multiplicity. The numbers as superscripts and subscripts indicate the systematic errors resulting from the scale variations according to equation (10), and those within parentheses denote the statistical errors.By examining the difference between the cross sections of the inclusive 3-jet at NNLO and the inclusive 4-jet at NLO, we observe that the majority of events are the exclusive 3-jet events (87%) at
$ y_{\text{cut}}=10^{-2} $ . As$ y_{\text{cut}} $ decreases, the cross section of the inclusive 3-jet at NNLO increases. However, a notable decrease is observed in the proportion of the exclusive 3-jet events, accompanied by a corresponding increase in the proportion of the inclusive 4-jet events. Notably, the exclusive 3-jet cross section at NNLO turns negative at$ y_{\text{cut}}=10^{-4} $ owing to the large logarithmic corrections associated with the back-to-back events. The scale uncertainty for the inclusive 3-jet cross section at NNLO is$ _{-1.9\%}^{+1.1\%} $ at$ y_{\text{cut}}=10^{-2} $ ,$ _{-1.3\%}^{+0.3\%} $ at$ y_{\text{cut}}=10^{-2.5} $ , and$ _{-1.5\%}^{+0.2\%} $ at$ y_{\text{cut}}=10^{-3} $ . For$ y_{\text{cut}} $ $ \geqslant 10^{-2.5} $ , the large exclusive 3-jet rates indicate that the majority of the events are planar. In contrast, the inclusive 4-jet events lead to deviations in event shapes from a plane. The details are illustrated through the distributions of the eigenvalues from$ S^{jk} $ in the next subsection.Table 2 presents the cross sections for the exclusive 3-jet production at LO, NLO, and NNLO with
$ y_{\text{cut}}=10^{-2} $ ,$ 10^{-3} $ , and$ 10^{-4} $ . Each row corresponds to a distinct$ y_{\text{cut}} $ value, whereas each column corresponds to a different fixed order. For$ y_{\text{cut}}=10^{-2} $ , the reduction in the relative scale uncertainty is 67% between LO and NLO and 89% between NLO and NNLO. The relative corrections are 18% between LO and NLO and –0.9% between NLO and NNLO. We observe that the effects of large-logarithm corrections are remarkably prominent around$ y_{\text{cut}} = 10^{-4} $ . Consequently, in the subsequent analysis, we restrict our attention to the results corresponding to$ y_{\text{cut}} $ in the range$ 10^{-2} $ to$ 10^{-3} $ .$ y_{\text{cut}} $ $\sigma_{\rm LO}$ $\sigma_{\rm NLO}$ $\sigma_{\rm NNLO}$ $ 1\cdot10^{-2.0} $ $ 1.1878(3)^{+0.140}_{-0.112}\cdot 10^{7} $ $ 1.4054(4)_{-0.054}^{+0.046}\cdot 10^{7} $ $ 1.393(2)_{-0.011}^{+0.000}\cdot 10^{7} $ $ 1\cdot10^{-3.0} $ $ 3.2104(8)^{+0.377}_{-0.304}\cdot 10^{7} $ $ 2.409(3)_{-0.222}^{+0.104}\cdot10^{7} $ $ 1.70(1)_{-0.257}^{+0.204}\cdot 10^{7} $ $ 1\cdot10^{-4.0} $ $ 6.275(2)^{+0.736}_{-0.594}\cdot10^{7} $ $ 5.3(6)_{-159.2}^{+104.1}\cdot10^{5} $ $ -1.48(2)_{-0.583}^{+0.419}\cdot 10^{7} $ Table 2. Exclusive 3-jet cross sections (in fb) at fixed order with different
$ y_{\text{cut}} $ values. Each row corresponds to a distinct$ y_{\text{cut}} $ value, whereas each column corresponds to a different fixed order. The numbers as superscripts and subscripts indicate the systematic errors, which are obtained from equation (10), and those within parentheses denote the statistical errors. -
We study the differential cross sections for
$ \lambda_1 $ ,$ \lambda_2 $ ,$ \lambda_3 $ , and$ \tilde{P} $ with different values of$ y_{\text{cut}} $ to analyze the planarity of multi-jet production in the inclusive 3-jet events up to NNLO and in the inclusive 4-jet events up to NLO. Large logarithmic divergences in the back-to-back fiducial regions limit the prediction power of fixed order QCD calculations. We use PYTHIA 8.3 [96] to resum the leading log divergences for inclusive 3, 4-jet events to extend and exam our study. Figure 2 and Fig. 3 show the differential distributions of$ \lambda_1 $ and$ \lambda_2 $ in the inclusive 3-jet events for$ y_{\text{cut}} = 10^{-2} $ (left panel) and$ 10^{-3} $ (right panel). The upper panels present the predictions at LO (green), NLO (blue), and NNLO (red). The lower panels display the relative ratios over the NLO predictions. The statistical errors are represented by the error bars, whereas the light-shaded bands indicate the systematic uncertainties resulting from the 7-point scale variations.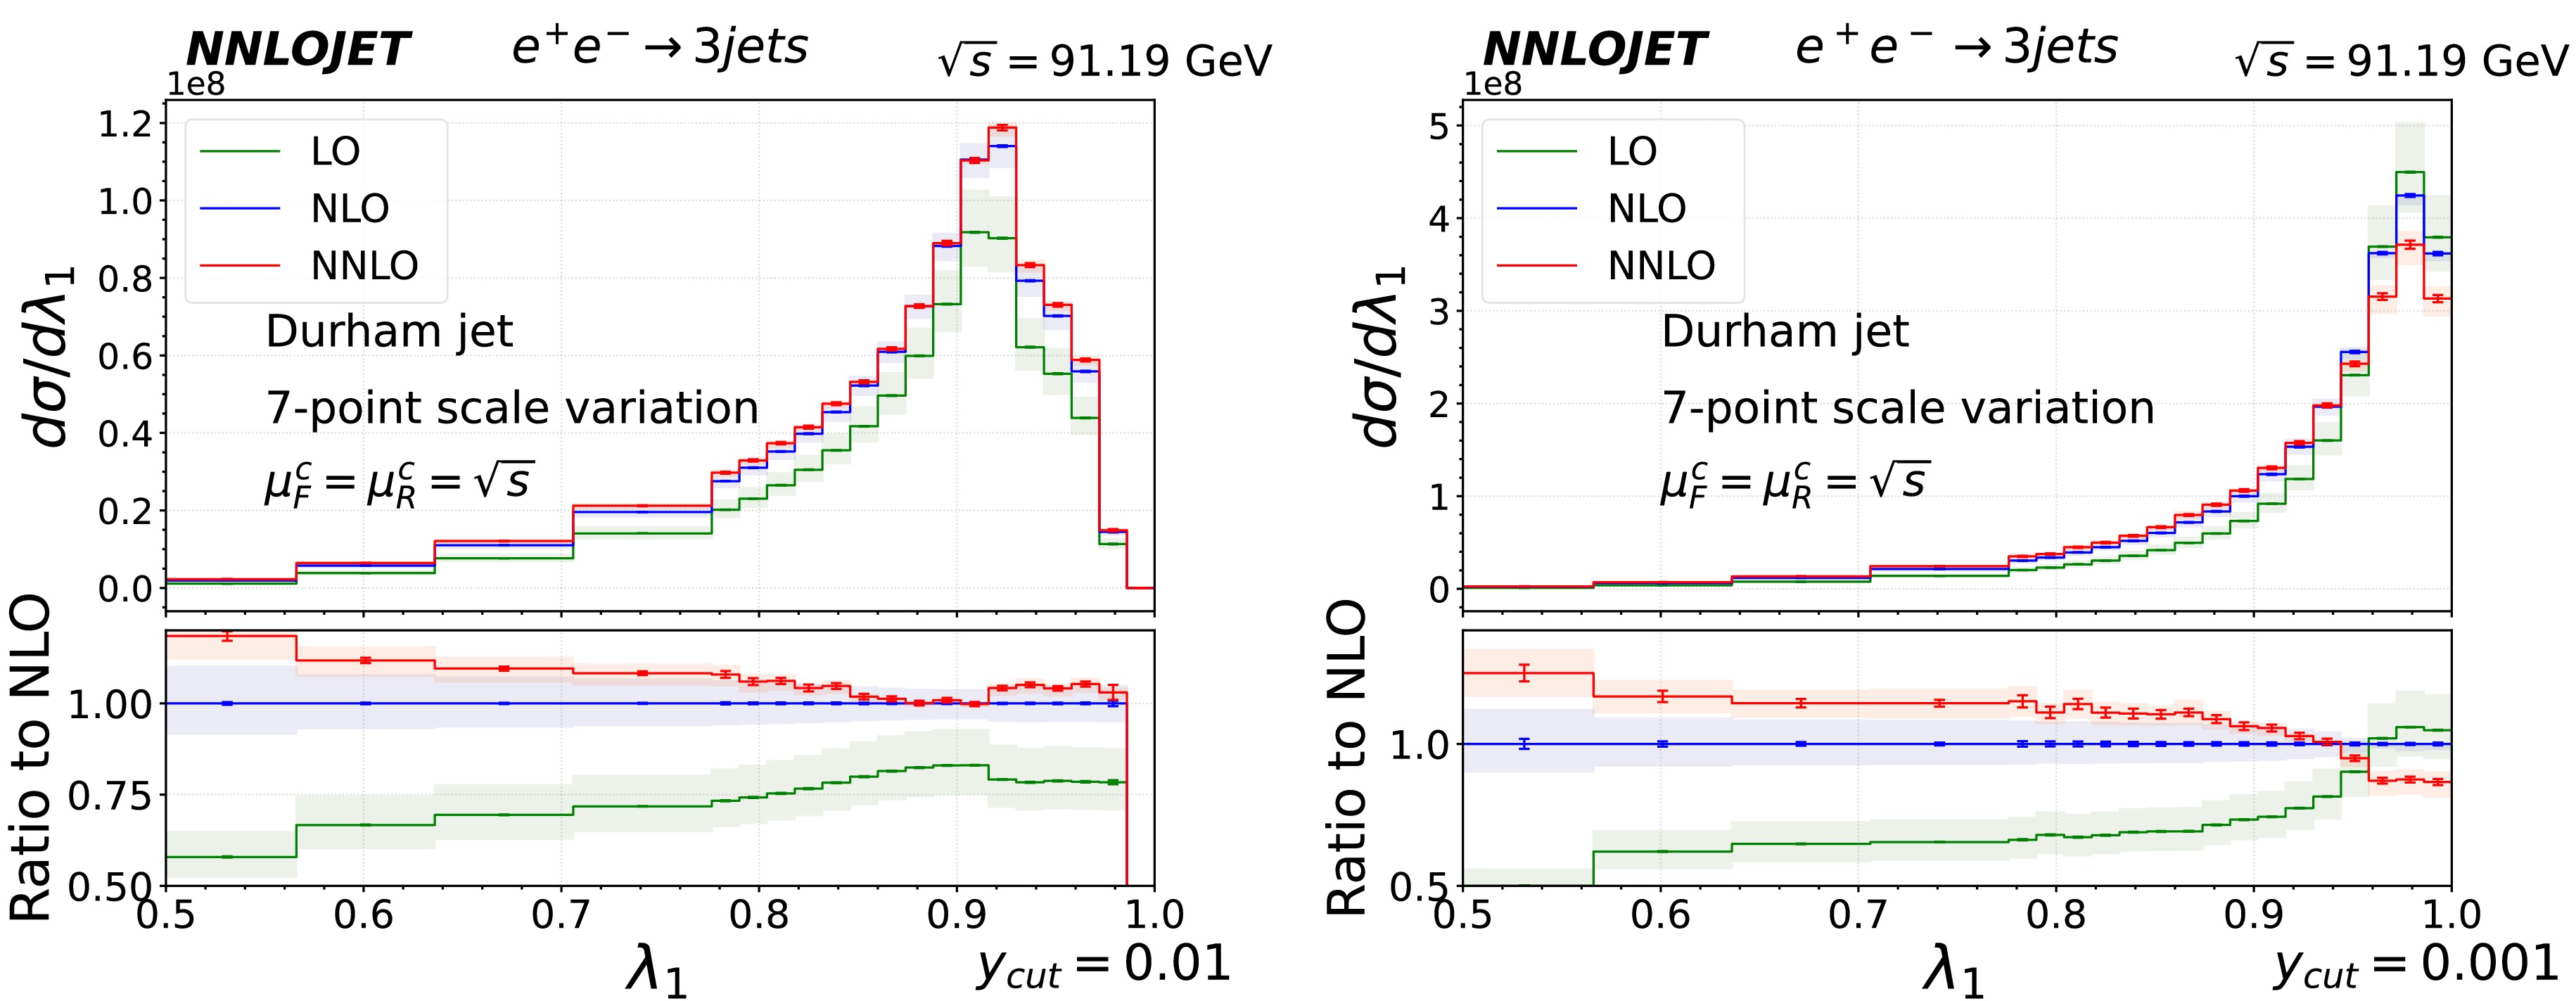
Figure 2. (color online) Distribution of the event shape observable
$ \lambda_1 $ in the inclusive 3-jet events at the center-of-mass energy$ \sqrt{s}=m_Z $ for$ y_{\text{cut}} = 10^{-2} $ (left panel) and$ 10^{-3} $ (right panel). The upper panels present the predictions at LO (green), NLO (blue), and NNLO (red). The lower panels display the ratios of the NLO and LO predictions over the NLO predictions. The statistical errors are represented by the error bars, whereas the light-shaded bands indicate the systematic uncertainties arising from the scale variations according to equation (10).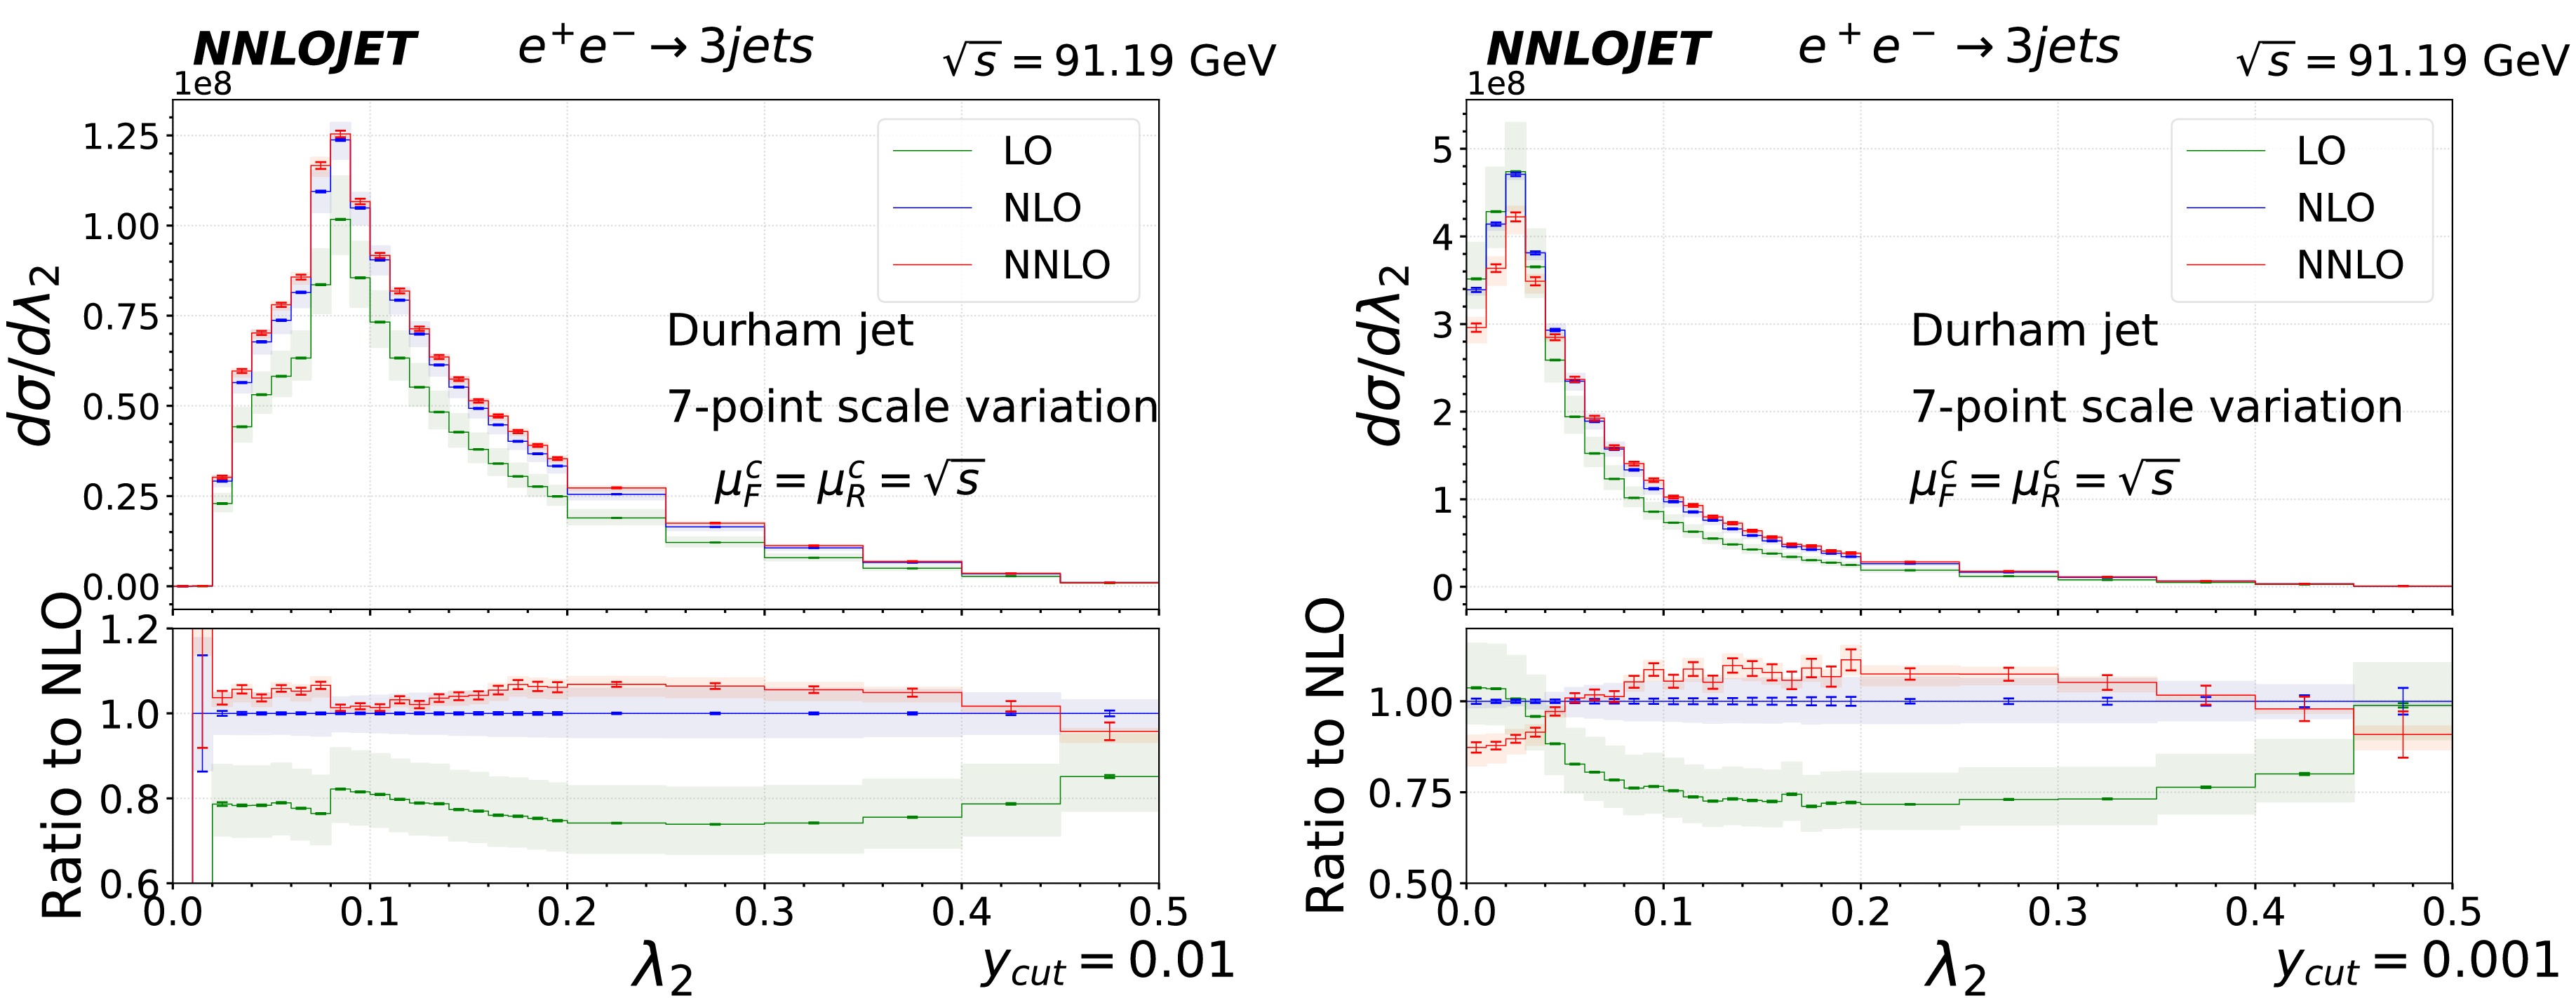
Figure 3. (color online) Distribution of the event shape observable
$ \lambda_2 $ in the inclusive 3-jet events at the center-of-mass energy$ \sqrt{s}=m_Z $ for$ y_{\text{cut}} = 10^{-2} $ (left panel) and$ 10^{-3} $ (right panel). The upper panels present the predictions at LO (in green), NLO (blue), and NNLO (red). The lower panels display the ratios of the NLO and LO predictions over the NLO predictions. The statistical errors are represented by the error bars, whereas the light-shaded bands indicate the systematic uncertainties arising from the scale variations according to equation (10).Both figures show no shift in the peak position with higher order pQCD corrections, which, however, change the shape and theory uncertainty of the distributions. The peak of the
$ \lambda_1 $ ($ \lambda_2 $ ) distribution is near 0.92 (0.08) at$ y_{\text{cut}} = 10^{-2} $ . In the peak region, the relative scale uncertainties are reduced by approximately 63% (62%) between LO and NLO and by 100% (90%) between NLO and NNLO. The relative corrections are approximately 21% (22%) between LO and NLO and 0% (0.8%) between NLO and NNLO. In the tail region, the relative scale uncertainties are reduced by approximately 44%−65% (51%−60%) between LO and NLO and by 58%−100% (71%−88%) between NLO and NNLO. The relative corrections are approximately 23%−41% (27%− 33%) between LO and NLO and 8.1%−13% (2.1%− 6.3%) between NLO and NNLO. These results suggest that the pQCD calculations converge for the plotted regions at$ y_{\text{cut}}=10^{-2} $ .As
$ y_{\text{cut}} $ decreases, the peak of$ \lambda_{1} $ ($ \lambda_{2} $ ) shifts towards 1 (0), indicating that more events approaching the back-to-back limit ($ \lambda_{1}=1 $ and$ \lambda_{2}=0 $ ) are adopted. For$ y_{\text{cut}}=10^{-3} $ , the relative scale uncertainty in the peak region increases approximately 301% (479%) between NLO and NNLO. Moreover, the relative corrections come to approximately –5.5% (–0.4%) between LO and NLO and –12.7% (–10.4%) between NLO and NNLO. These facts indicate effects of the large logarithmic corrections in the peak region at$ y_{\text{cut}}=10^{-3} $ . In contrast, the fixed order results converge well in the tail region. The reductions of the relative scale uncertainty are about 24% (41%) between LO and NLO and 41% (61%) between NLO and NNLO. The relative corrections are about 51% (40%) between LO and NLO and 15% (7.6%) between NLO and NNLO.Large logarithmic divergences in the back-to-back fiducial regions limit the prediction power of fixed order QCD calculations. We have used PYTHIA 8.3 [96] to resum the leading log divergences for inclusive 3, 4-jet events to extend and exam our study. Figure 4 and Fig. 5 show the distributions of
$ \lambda_1 $ and$ \lambda_2 $ in inclusive 3-jet events for$ y_{\text{cut}} = 10^{-2} $ (left panel) and$ 10^{-3} $ (right panel). The peak positions and full width at half maximum remain similar to those from the fixed-order calculation in Fig. 2 and Fig. 3. For$ y_{\text{cut}}=10^{-2} $ , the peak of the$ \lambda_1 $ ($ \lambda_2 $ ) distribution is near 0.92 (0.08). As$ y_{\text{cut}} $ decreases, the peak of$ \lambda_{1} $ ($ \lambda_{2} $ ) shifts towards 1 (0), indicating that the resummation effects do not change the overall picture: more events approach the back-to-back limit ($ \lambda_{1}=1 $ and$ \lambda_{2}=0 $ ).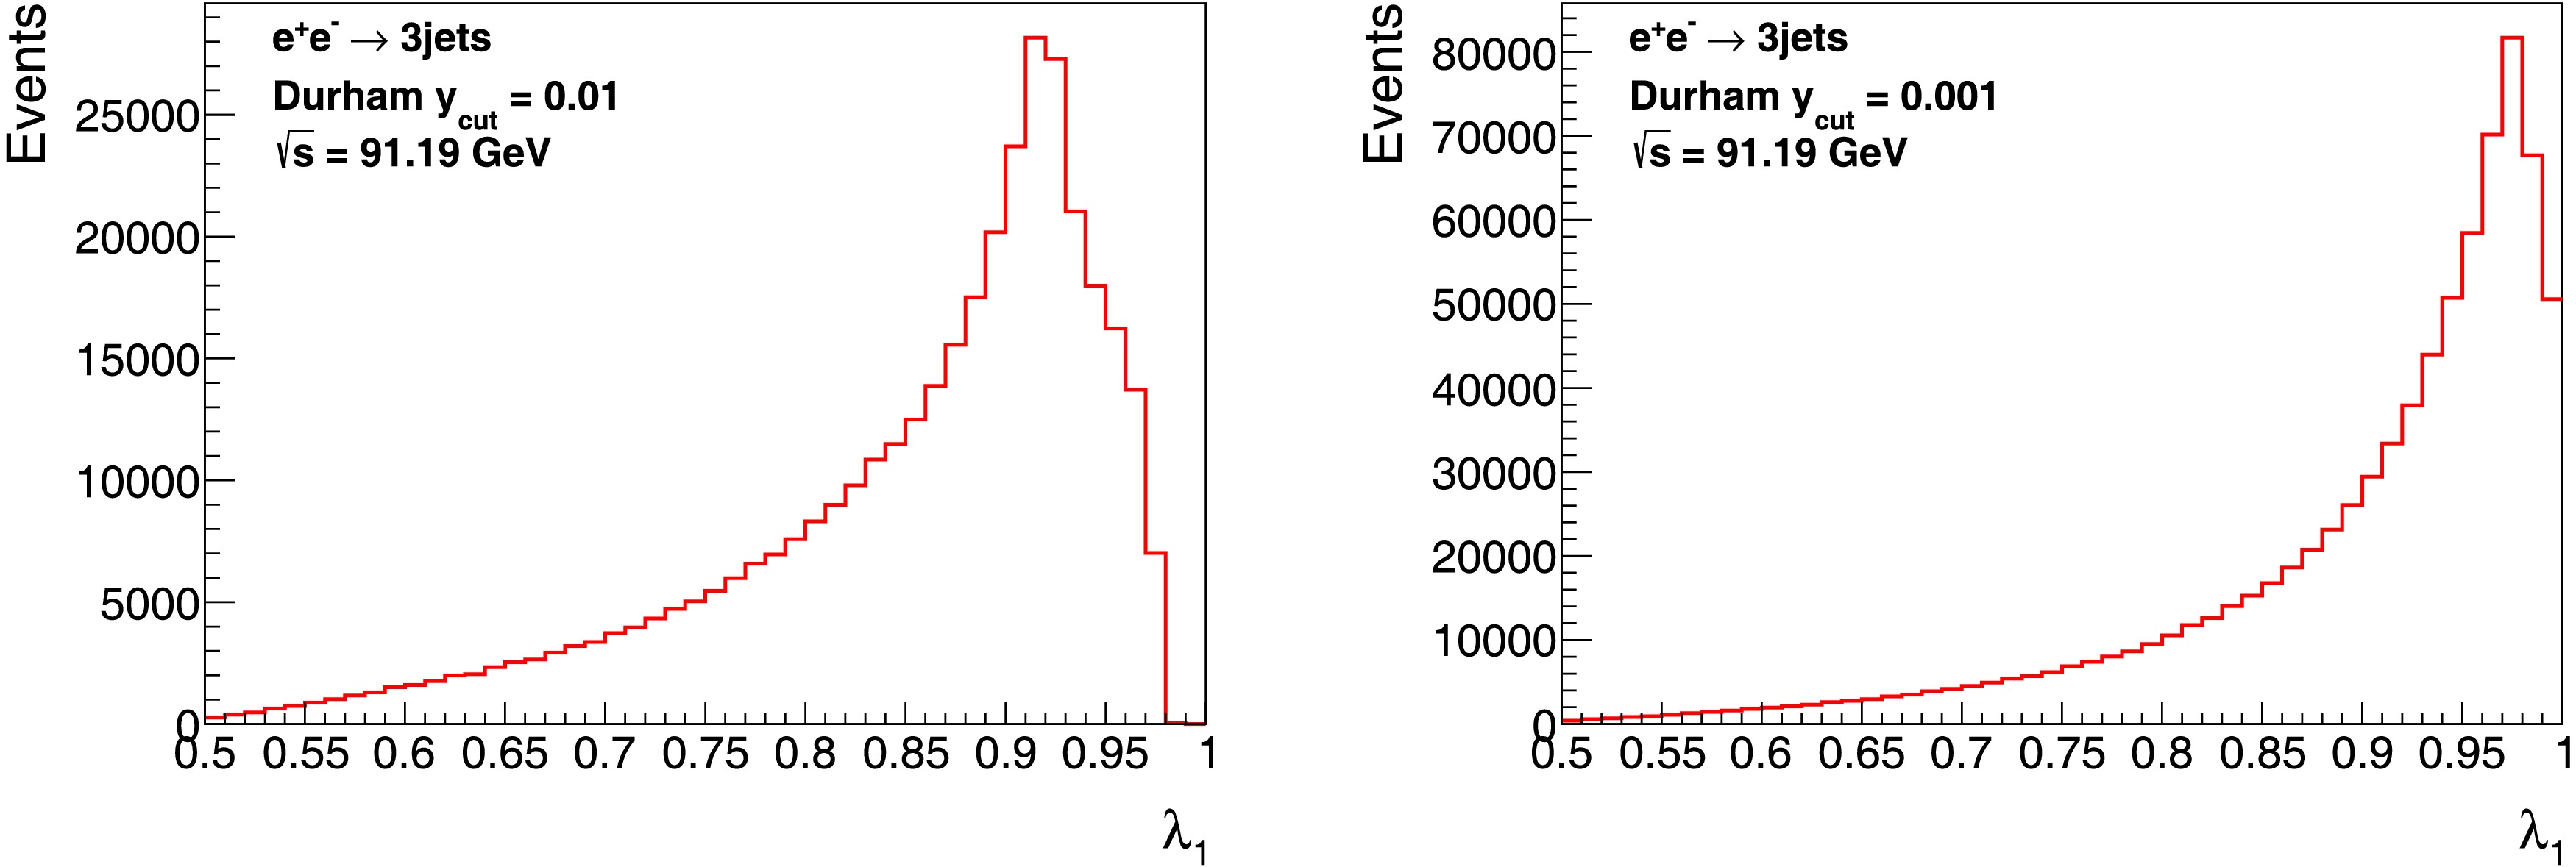
Figure 4. (color online) Distribution of the event shape observable
$ \lambda_1 $ in the inclusive 3-jet events at the center-of-mass energy$ \sqrt{s}=m_Z $ for$ y_{\text{cut}} = 10^{-2} $ (left panel) and$ 10^{-3} $ (right panel), based on PYTHIA 8.3 [96].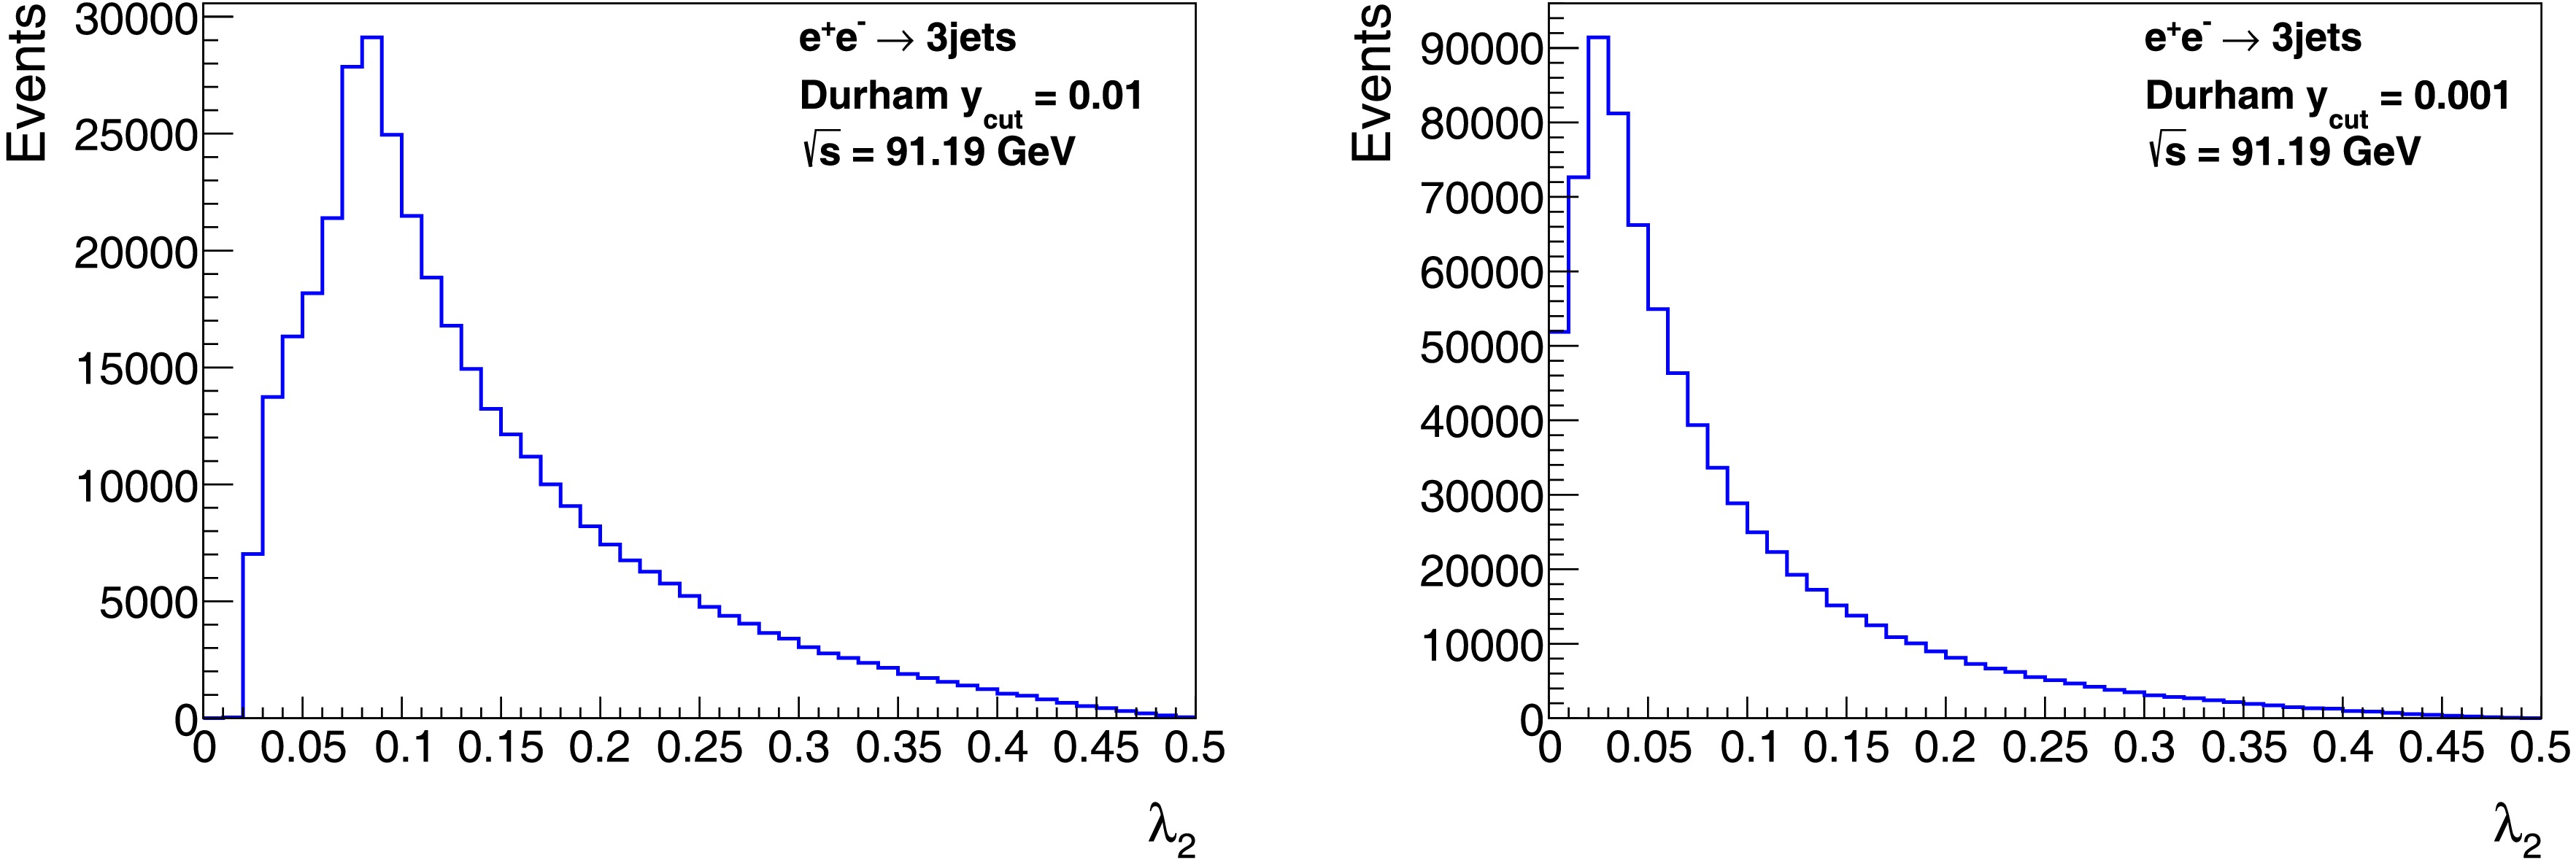
Figure 5. (color online) Distribution of the event shape observable
$ \lambda_2 $ in the inclusive 3-jet events at the center-of-mass energy$ \sqrt{s}=m_Z $ for$ y_{\text{cut}} = 10^{-2} $ (left panel) and$ 10^{-3} $ (right panel), based on PYTHIA 8.3 [96].Figure 6 shows the differential distribution of
$ \lambda_3 $ in inclusive 3-jet events for$ y_{\text{cut}} = 10^{-2} $ (left panel) and$ 10^{-3} $ (right panel). We observe that the distribution of$ \lambda_3 $ , which indicates the planarity of an event, is concentrated around 0 for these two$ y_{\text{cut}} $ values. The closer$ \lambda_3 $ is to 0, the higher the planarity. Consequently, the peaks in the distribution suggest that the events exhibit high planarity. The distribution at LO is confined to the first bin as this order has only exclusive 3-jet events ($ \lambda_{3}=0 $ ). Additionally, we can observe that as$ y_{\text{cut}} $ decreases, the degree of event clustering at NLO and NNLO decreases. In Table 1, we observe that a decrease in$ y_{\text{cut}} $ leads to a decrease in the proportion of 3-jet events, accompanied by an increase in the proportions of 4-jet and 5-jet events. As the jet multiplicity increases, the planarity of the events decreases accordingly. This trend is reflected in the enhanced distribution within the tail region, as illustrated in Fig. 6.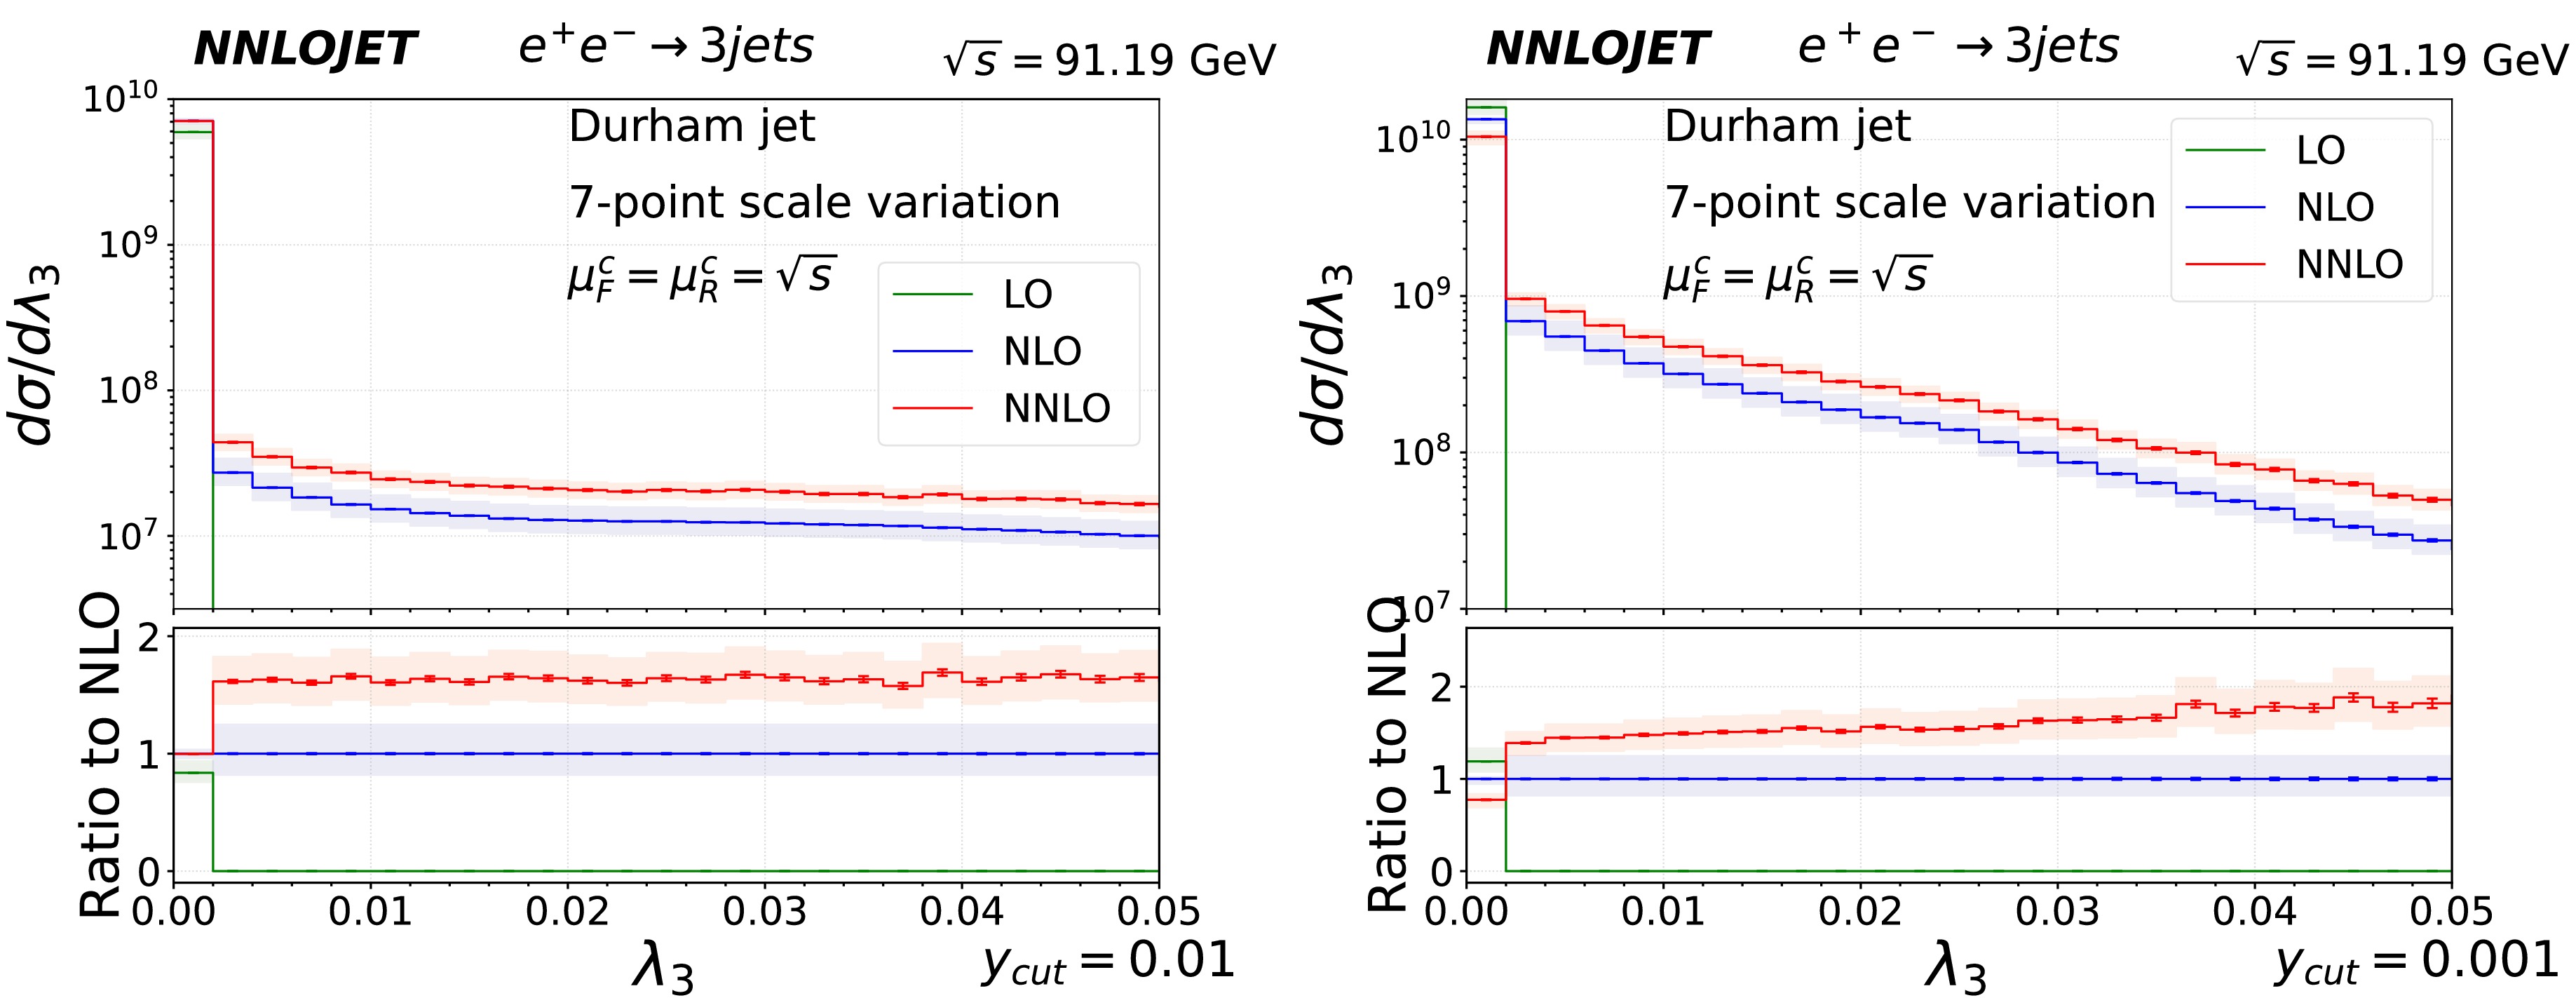
Figure 6. (color online) Distribution of the event shape observable
$ \lambda_3 $ in inclusive 3-jet events at center-of-mass energy$ \sqrt{s}=m_Z $ for$ y_{\text{cut}} = 10^{-2} $ (left panel) and$ 10^{-3} $ (right panel). The upper panels present predictions at LO (in green), NLO (in blue), and NNLO (in red). The lower panels display the ratios of NNLO, NLO, and LO over NLO predictions. Statistical errors are represented by error bars, while light-shaded bands indicate systematic uncertainties arising from scale variations according to equation (10).The
$ \lambda_{1} $ distribution demonstrates that the majority of events exhibit a "back-to-back-like" pattern, which is a well known picture of the global event shape in high energy$ e^+e^- $ annihilation processes. The line shapes of the observables$ \lambda_{2} $ and$ \lambda_{3} $ are similar, i.e., both peak near the minimum values. The modified planarity$ \tilde{P} $ depends on the relative ratio of$ \lambda_{2} $ and$ \lambda_{3} $ , which can reveal the difference of the concrete peak region of$ \lambda_{2} $ and$ \lambda_{3} $ . From the upper panel of Fig. 7, we observe that the distribution of$ \tilde{P} $ is concentrated around 1 always at these two$ y_{\text{cut}} $ values, similar to$ \lambda_{3} $ around 0 in Fig. 6. Additionally, the relative scale uncertainty for$ \tilde{P} $ between NLO and NNLO and the relative correction between NLO and NNLO around 1 are similar to these for$ \lambda_{3} $ around 0. We also calculate$ \lambda_{3} $ and$ \tilde{P} $ using PYTHIA and observe the same shape and peak region as in the above fixed order calculations (see Appendix C). Therefore, the parton shower does not change the conclusion that most of events have high planarity.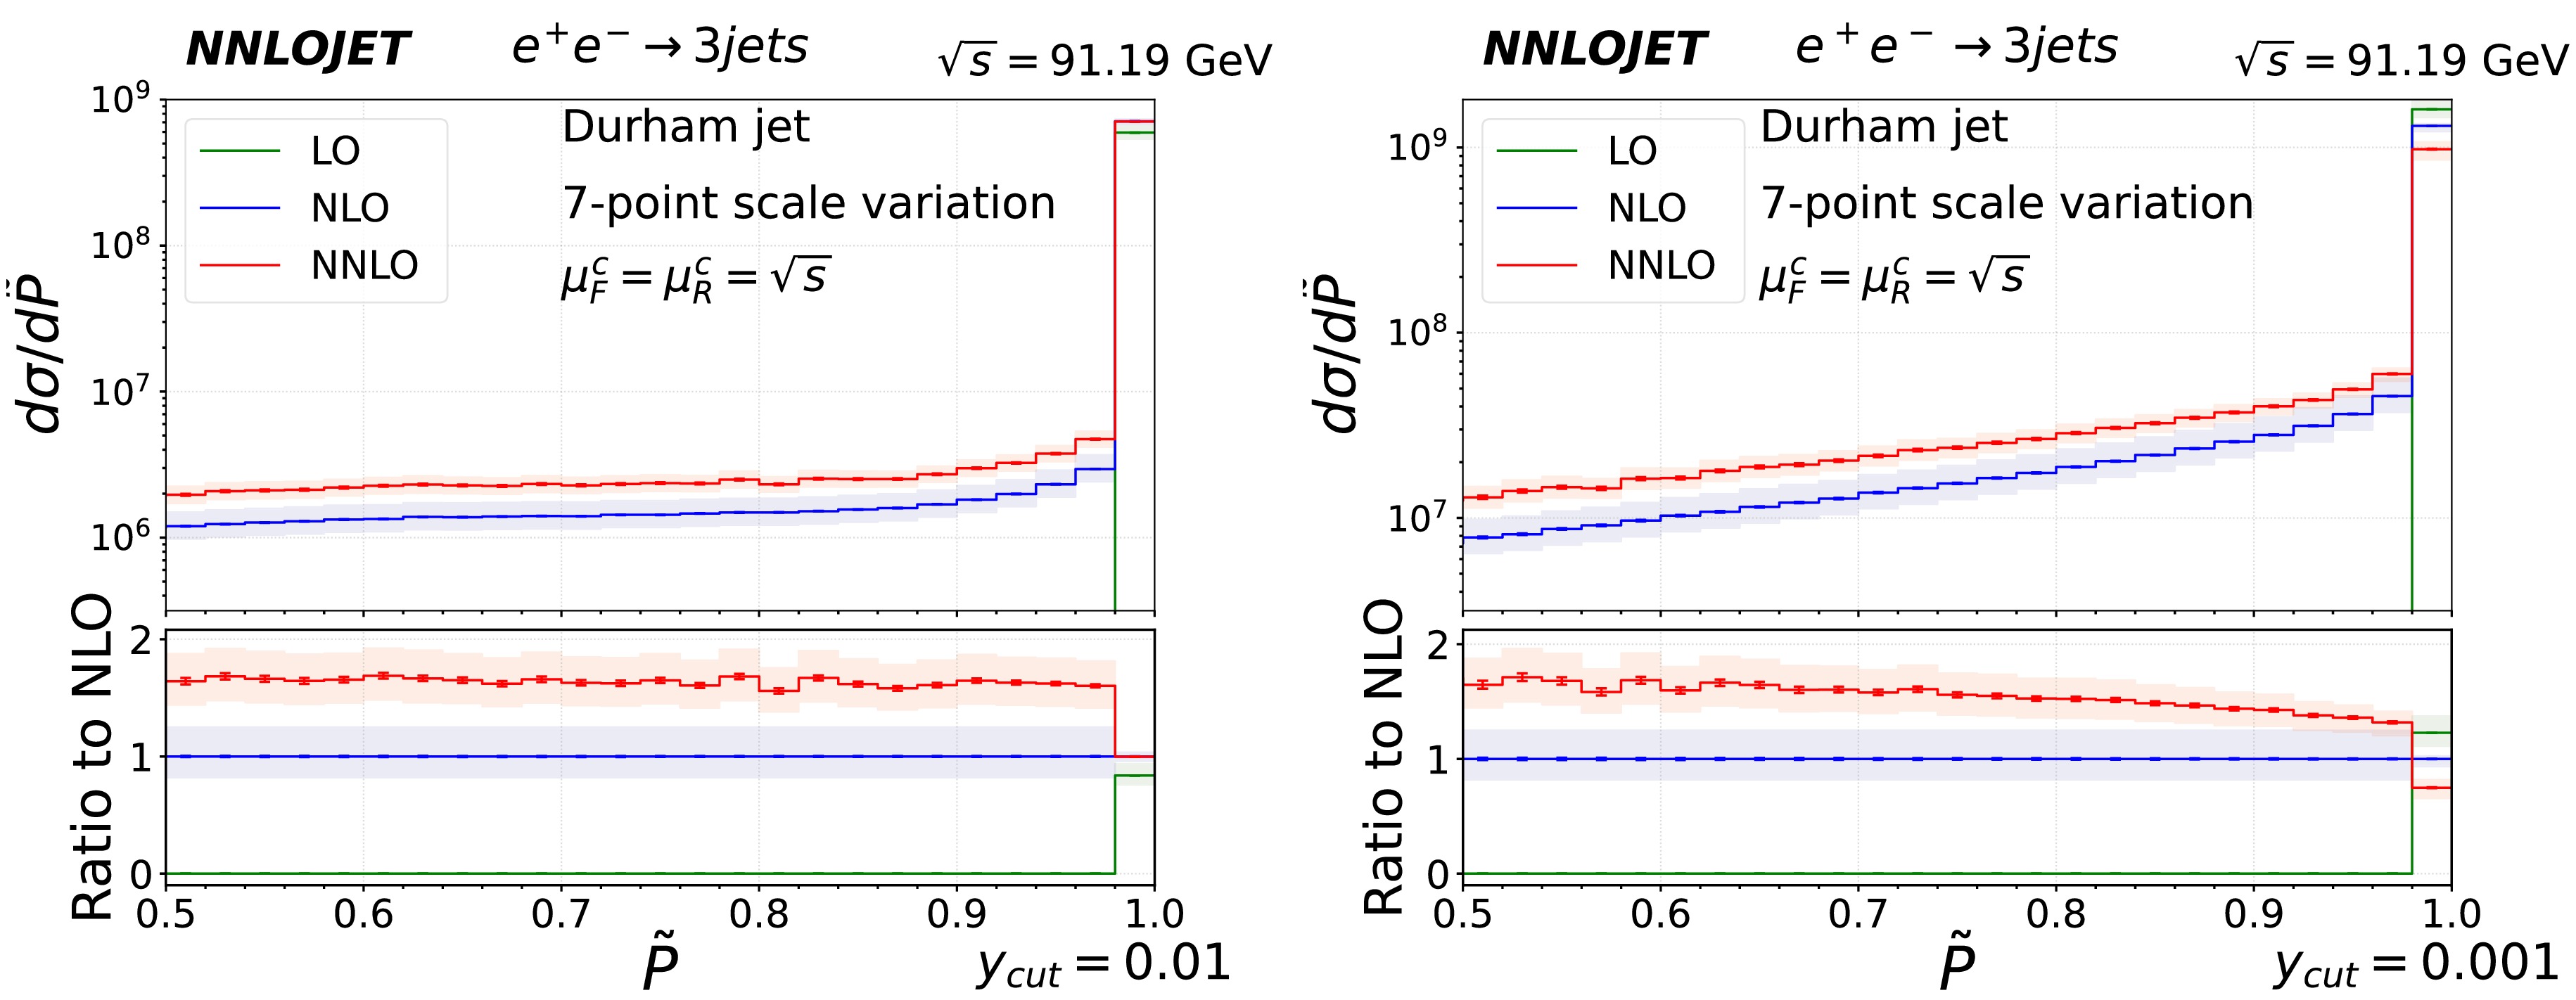
Figure 7. (color online) Distribution of the event shape observable
$ \tilde{P} $ in inclusive 3-jet events at center-of-mass energy$ \sqrt{s}=m_Z $ for$ y_{\text{cut}} = 10^{-2} $ (left panel) and$ 10^{-3} $ (right panel). The upper panels present predictions at LO (green), NLO (blue), and NNLO (red). The lower panels display the ratios of the NNLO, NLO, and LO over NLO predictions. Statistical errors are represented by error bars, whereas light-shaded bands indicate systematic uncertainties arising from scale variations according to equation (10).In the above analysis of the inclusive 3-jet events, we note that exclusive 3-jet events are fully planar. Therefore, we present the
$ \tilde{P} $ distributions for the inclusive 4-jet events, as shown in Fig. 8, to analyze the planarity of events with higher jet multiplicities. We observe that the distribution is concentrated around 1, which indicates that most of the inclusive 4-jet events have a planar event shape. The reduction in the relative scale uncertainty and the relative correction between LO and NLO for$ \tilde{P} $ around 1 are similar to those for$ \lambda_3 $ around 0. The reduction of the relative scale uncertainty for$ \tilde{P} $ between LO and NLO around the peak region is 48% at$ y_{\text{cut}}=10^{-2} $ and 69% at$ y_{\text{cut}}=10^{-3} $ , and the relative correction between LO and NLO is 62% at$ y_{\text{cut}}=10^{-2} $ and 26% at$ y_{\text{cut}}=10^{-3} $ . At$ y_{\text{cut}} = 10^{-3} $ , we observe reductions in the relative scale uncertainty between LO and NLO within the peak regions, which differs from that observed for inclusive 3-jet events. This suggests that the back-to-back events are primarily derived from the 3-jet events. We also calculate$ \tilde{P} $ for inclusive 4-jet events using PYTHIA and observe the same shape and peak region as in the above fixed order calculations (see Appendix C).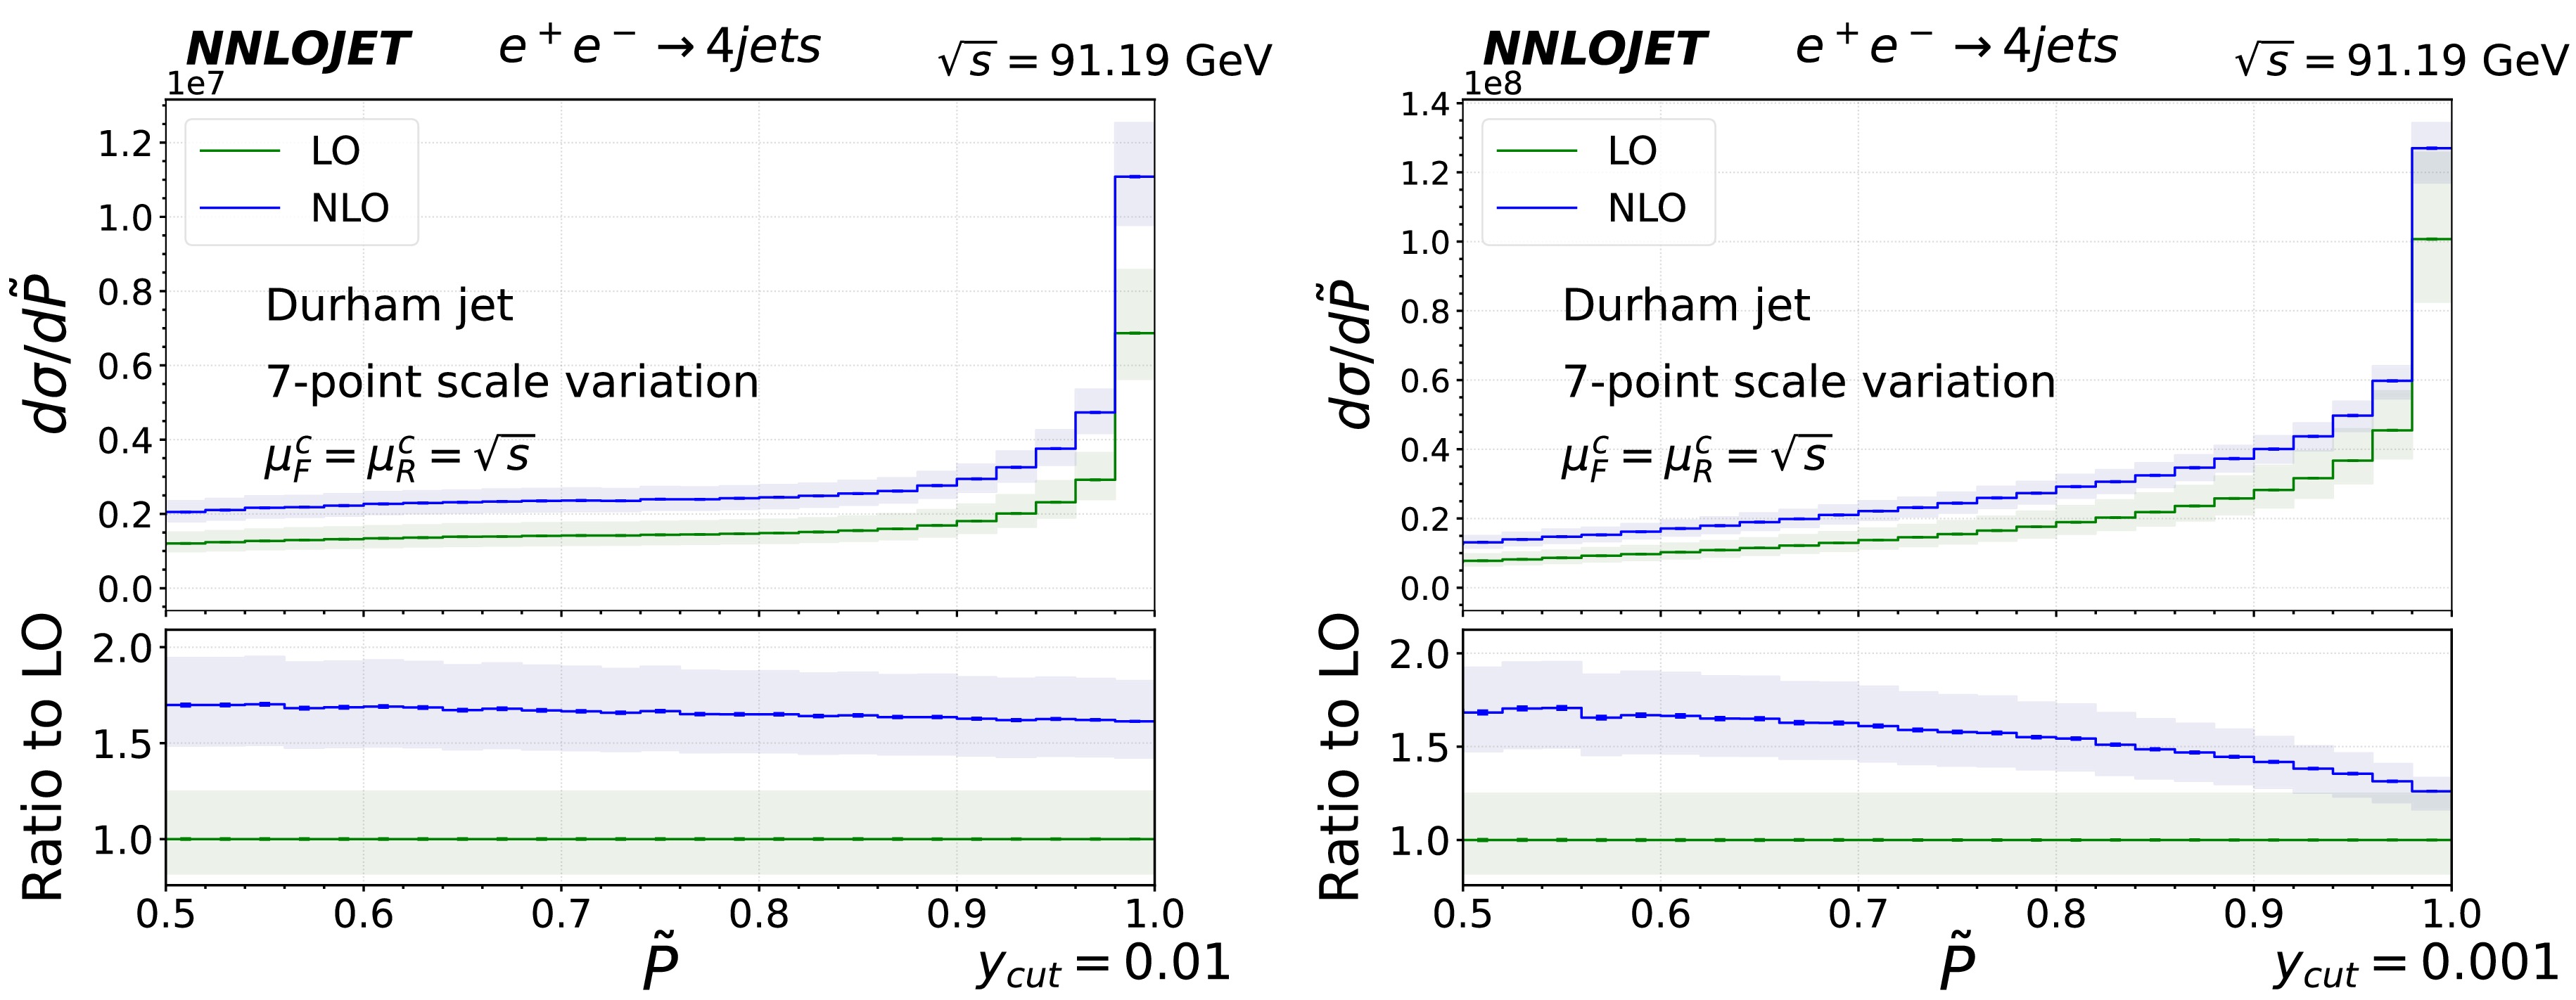
Figure 8. (color online) Distribution of the event shape observable
$ \tilde{P} $ in the inclusive 4-jet events at the center-of-mass energy$ \sqrt{s}=m_Z $ for$ y_{\text{cut}} = 10^{-2} $ (left panel) and$ 10^{-3} $ (right panel). The upper panels present the predictions LO (green) and NLO (blue). The lower panels display the ratios of the NLO and LO predictions over the LO predictions. The statistical errors are represented by the error bars, whereas the light-shaded bands indicate the systematic uncertainties arising from the scale variations according to equation (10).The analysis of the above observables adequately demonstrates the planarity of the events driven by pQCD, including those with a higher multiplicity of jets. When more than three jets exist, generally, the momenta are not restricted in a plane, but the whole phase space of an event is still significantly planar. Because the higher order corrections are relatively small and have less uncertainty of scale variation in the entire region for large
$ y_{\text{cut}} $ values (approximately$ 10^{-2} $ ), we conclude that hard scatterings that are dictated by pQCD lead to a high planarity. This will be further illustrated in the study on the Ridge correlations in the following subsection.In contrast, for small values of
$ y_{\text{cut}} $ (approximately$ 10^{-3} $ ), the non-perturbative corrections can be large. The resummation is required in the peak region to obtain physically valid results. Additionally, we find that the parton shower does not change this picture that most of events have high planarity around this$ y_{\text{cut}} $ value. -
In Section III.B, our analysis demonstrates that the events driven by pQCD exhibit high planarity. This property leads to significant Ridge correlations. Figure 9 shows such distributions in the inclusive 3-jet events at NNLO with
$ y_{\text{cut}} = 10^{-2} $ . The upper left panel shows the result at the central scale choice; the upper right panel shows the relative statistical error; the lower left panel illustrates the systematic error due to the scale variation, as given by Eq. (10), where$ \text{scale}_{\text{up}} $ ($ \text{scale}_{\text{down}} $ ) is the largest positive (negative) correction relative to the central scale; and the lower right panel displays the relative correction of the NNLO results with respect to the NLO results at the central scale.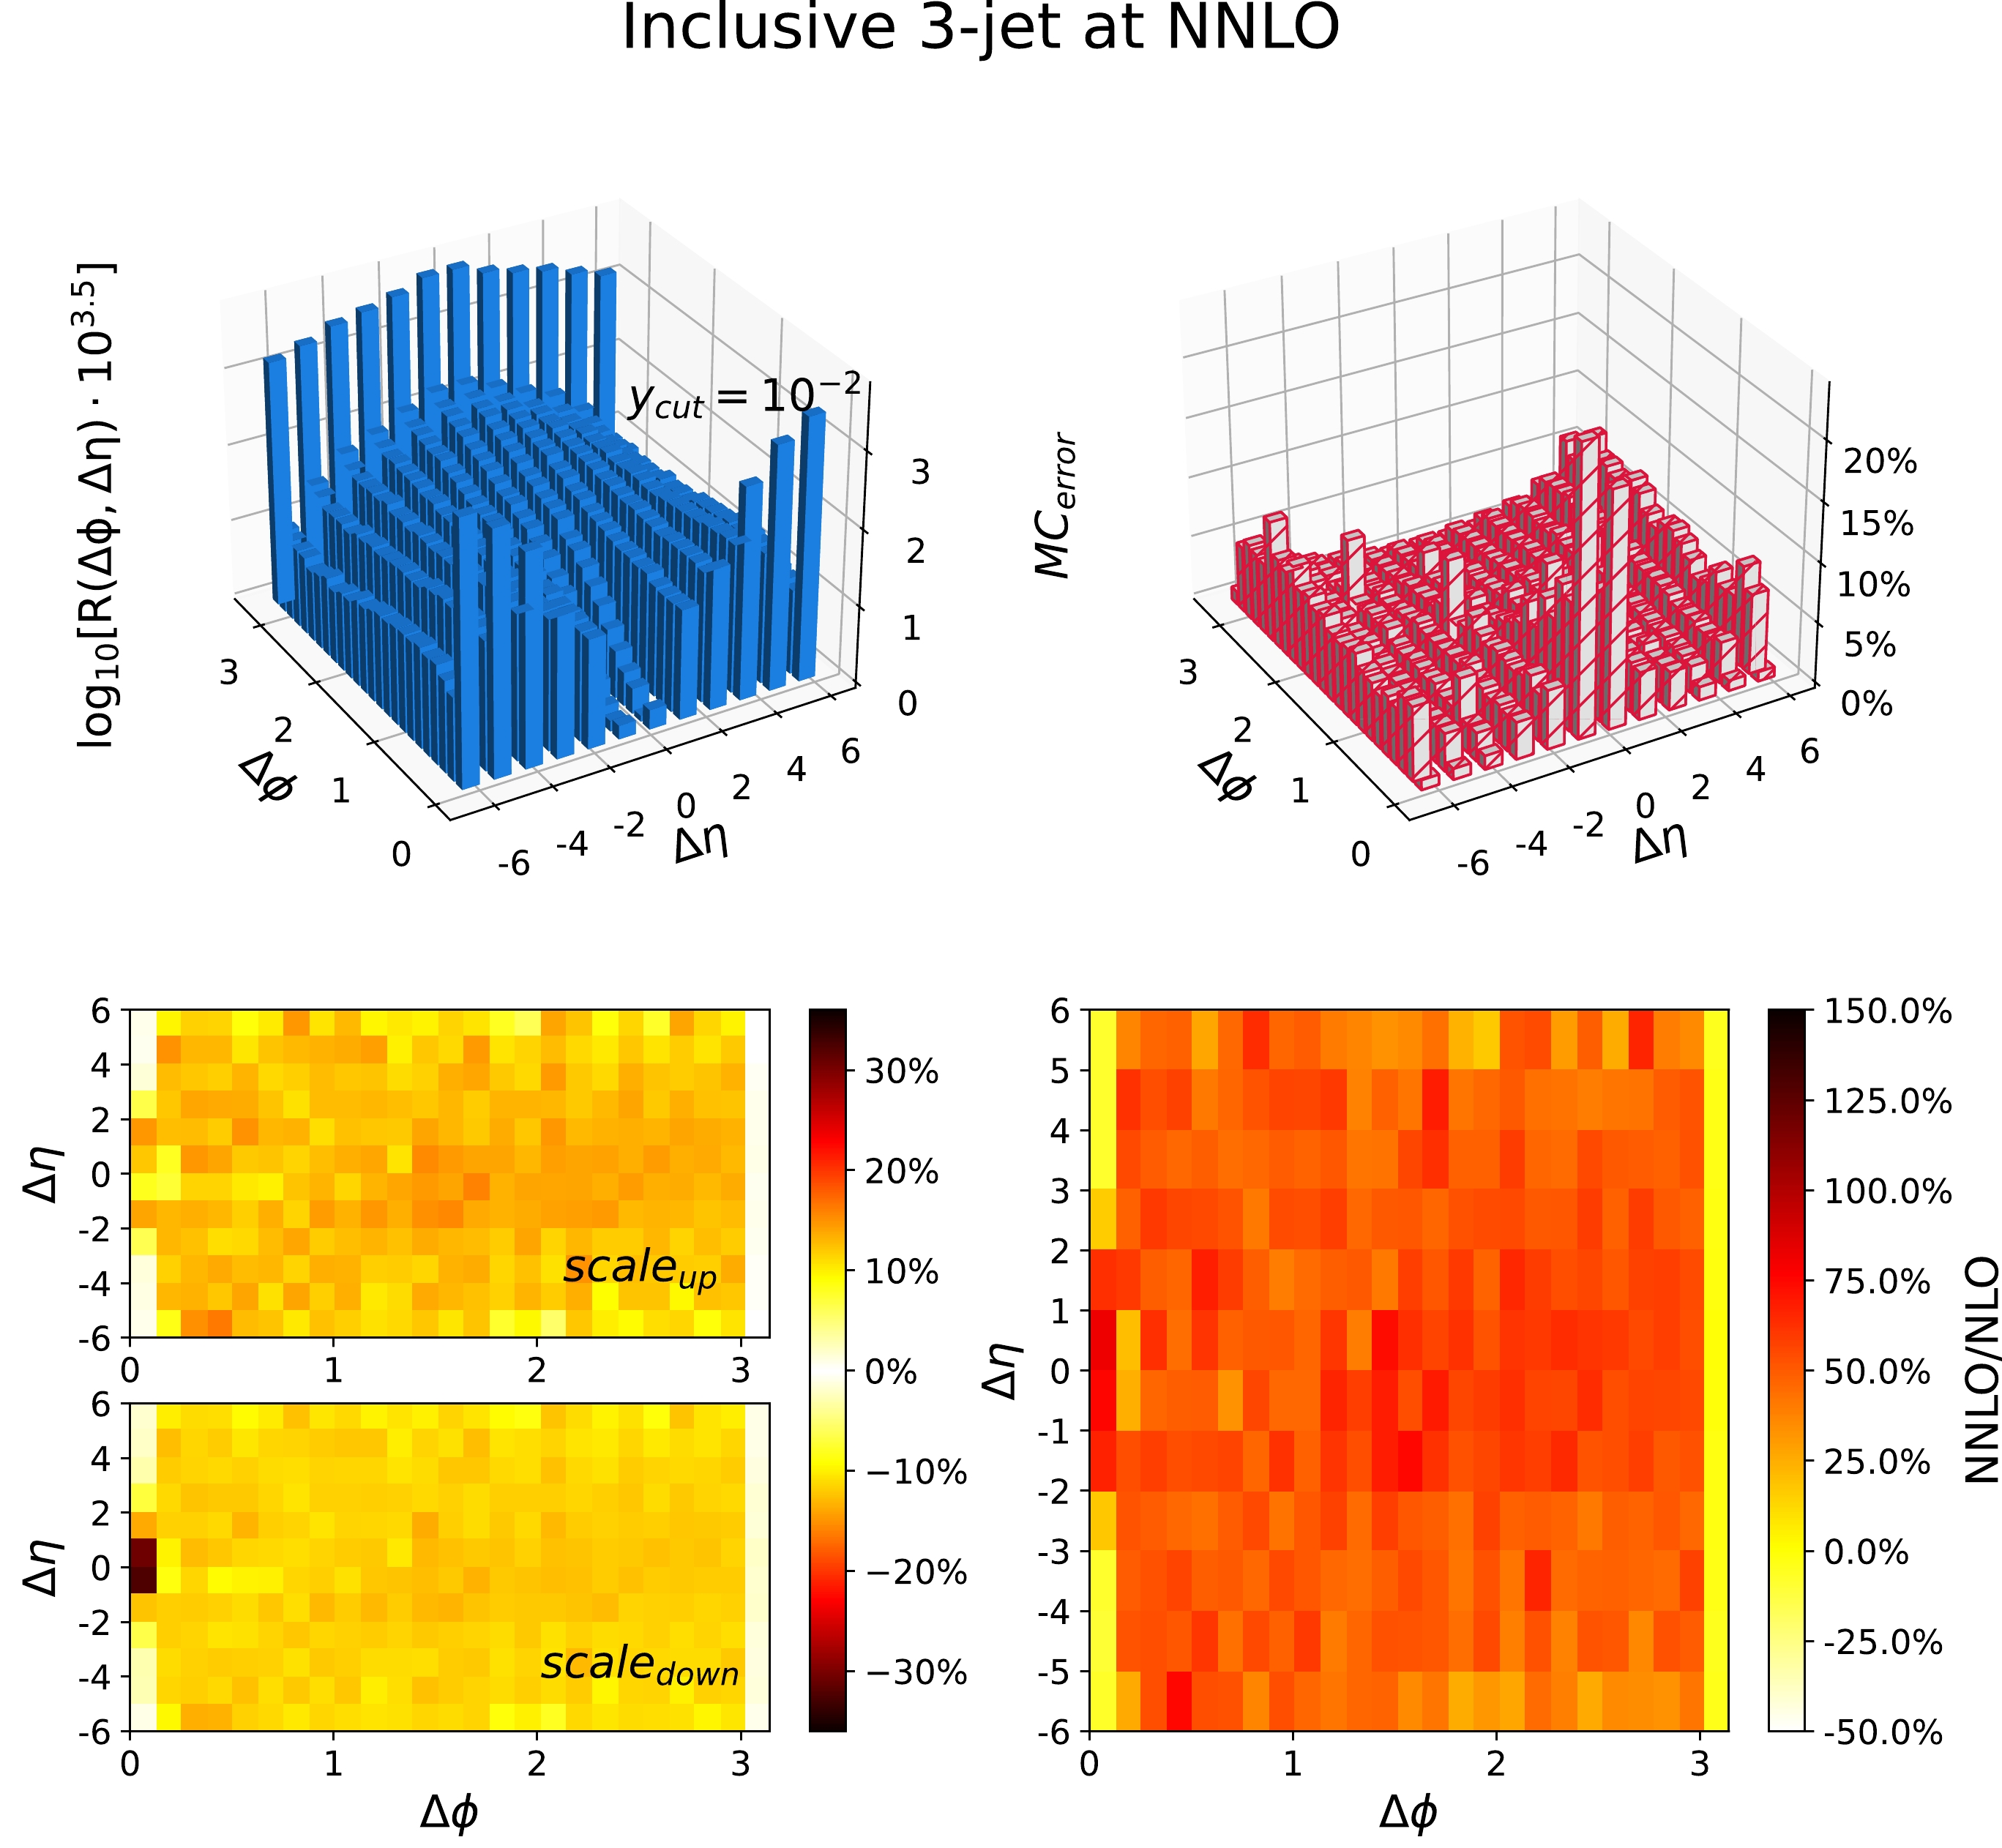
Figure 9. (color online) Long pseudo-rapidity range ϕ correlation (Ridge) distribution in the inclusive 3-jet events at NNLO with
$ y_{\text{cut}} = 10^{-2} $ . The upper left panel shows the result at the central scale choice; the upper right panel shows the relative statistical error; the lower left panel illustrates the systematic error due to the scale variation, as given by the Eq. (10), where$ \text{scale}_{\text{up}} $ ($ \text{scale}_{\text{down}} $ ) is the largest positive (negative) correction relative to the central scale; the lower right panel displays the relative correction of the NNLO results with respect to the NLO results at the central scale.From the upper left panel of Fig. 9, we observe that the events cluster primarily at
$ \Delta \phi = 0 $ and π, which indicates that the inclusive 3-jet events have high planarity. The concentration at$ \Delta \phi = \pi $ (the away-side) is notably higher than that at$ \Delta \phi = 0 $ (the near-side), and it shows a pronounced Ridge shape. This trend is consistent with the data presented in Table 1, which highlights the dominance of the 3-jet events at$ y_{\text{cut}} = 10^{-2} $ . In any 3-jet event, the azimuthal angle$ \Delta \phi $ between any two jets is restricted to these two values, and$ \Delta \phi = \pi $ occurs twice as frequently as$ \Delta \phi = 0 $ . This characteristic feature of the 3-jet events is responsible for shaping the observed distribution. We also notice that only a minimal number of events are distributed near the$ (\Delta \eta, \Delta \phi) = (0,0) $ region. Consequently, a significantly larger relative statistical error occurs, as shown in the upper right panel of Fig. 9. The relative statistical error increases with larger$ \Delta \eta $ , indicating a scarcity of the events with jets at large pseudo-rapidities. The lower left panel of Fig. 9 shows that the uncertainty of the scale variation is significantly lower in the$ \Delta \phi = 0, \pi $ regions (±5%) compared with the intermediate$ \Delta \phi $ region (±15%). Because the distribution in the intermediate$ \Delta \phi $ region is exclusively associated with the inclusive 4-jet events, this discrepancy in the uncertainty is attributed to the different orders of the perturbative calculations: NNLO for the near-side region and NLO for the intermediate region. From the lower right panel of Fig. 9, we observe that the relative correction is small (approximately ±10%) in the region near$ \Delta\phi = 0, \pi $ but large (approximately 25%−75%) in the middle region. On both sides of the plot, the dominant contribution is from the 3-jet events, for which the correction reaches NNLO accuracy. In contrast, in the middle region, the contribution is derived from the inclusive 4-jet events, and the correction is of NLO accuracy. The difference in the order of accuracy between these two regions is responsible for the varying magnitudes of the relative correction.As analyzed above, when
$ y_{\text{cut}} = 10^{-2} $ , the 3-jet events predominate and are primarily concentrated in the regions around$ \Delta\phi = 0 $ and$ \Delta\phi = \pi $ , making the distribution in the intermediate areas less visible. Therefore, we present the distribution within the context of the inclusive 4-jet events to offer a clearer view of the intermediate$ \Delta\phi $ region. Figure 10 shows the distribution of the Ridge correlation in the inclusive 4-jet events at NLO with$ y_{\text{cut}} = 10^{-2} $ . In the upper left panel of Fig. 10, we observe apparent distributions in the intermediate$ \Delta \phi $ region, whereas the main distributions are still in the$ \Delta \phi = \pi $ region, along with the Ridge shape. These observed features suggest that the 4-jet and 5-jet events also have high planarity with$ y_{\text{cut}}=10^{-2} $ , which is consistent with our finding in Section III.B. The plot of the relative statistical error shows that the error is generally minimal, except in the$ (\Delta\eta, \Delta\phi)=(0,0) $ region and at the positive and negative boundaries of$ \Delta\eta $ . The reason for these discrepancies is similar to that in the case of the inclusive 3-jet events. In the lower left plot of Fig. 10, the scale variation remains consistent at approximately ±14% across the entire$ (\Delta\eta, \Delta\phi) $ region. This uniformity can be ascribed to the NLO accuracy throughout this region. In the lower right panel of Fig. 10, the relative correction is observed to be approximately ±5%. This value is smaller than the relative correction observed in the inclusive 3-jet events shown in Fig. 9. This reduction in the relative correction can be attributed to the significant differences in the total cross section between the NLO and LO results for the inclusive 4-jet events. Specifically, the total cross section at NLO is$ 2.0016(7)_{-0.245}^{+0.280}\cdot 10^{6} $ fb, whereas that at LO is$ 1.2010(2)_{-0.22}^{+0.30}\cdot 10^{6} $ fb.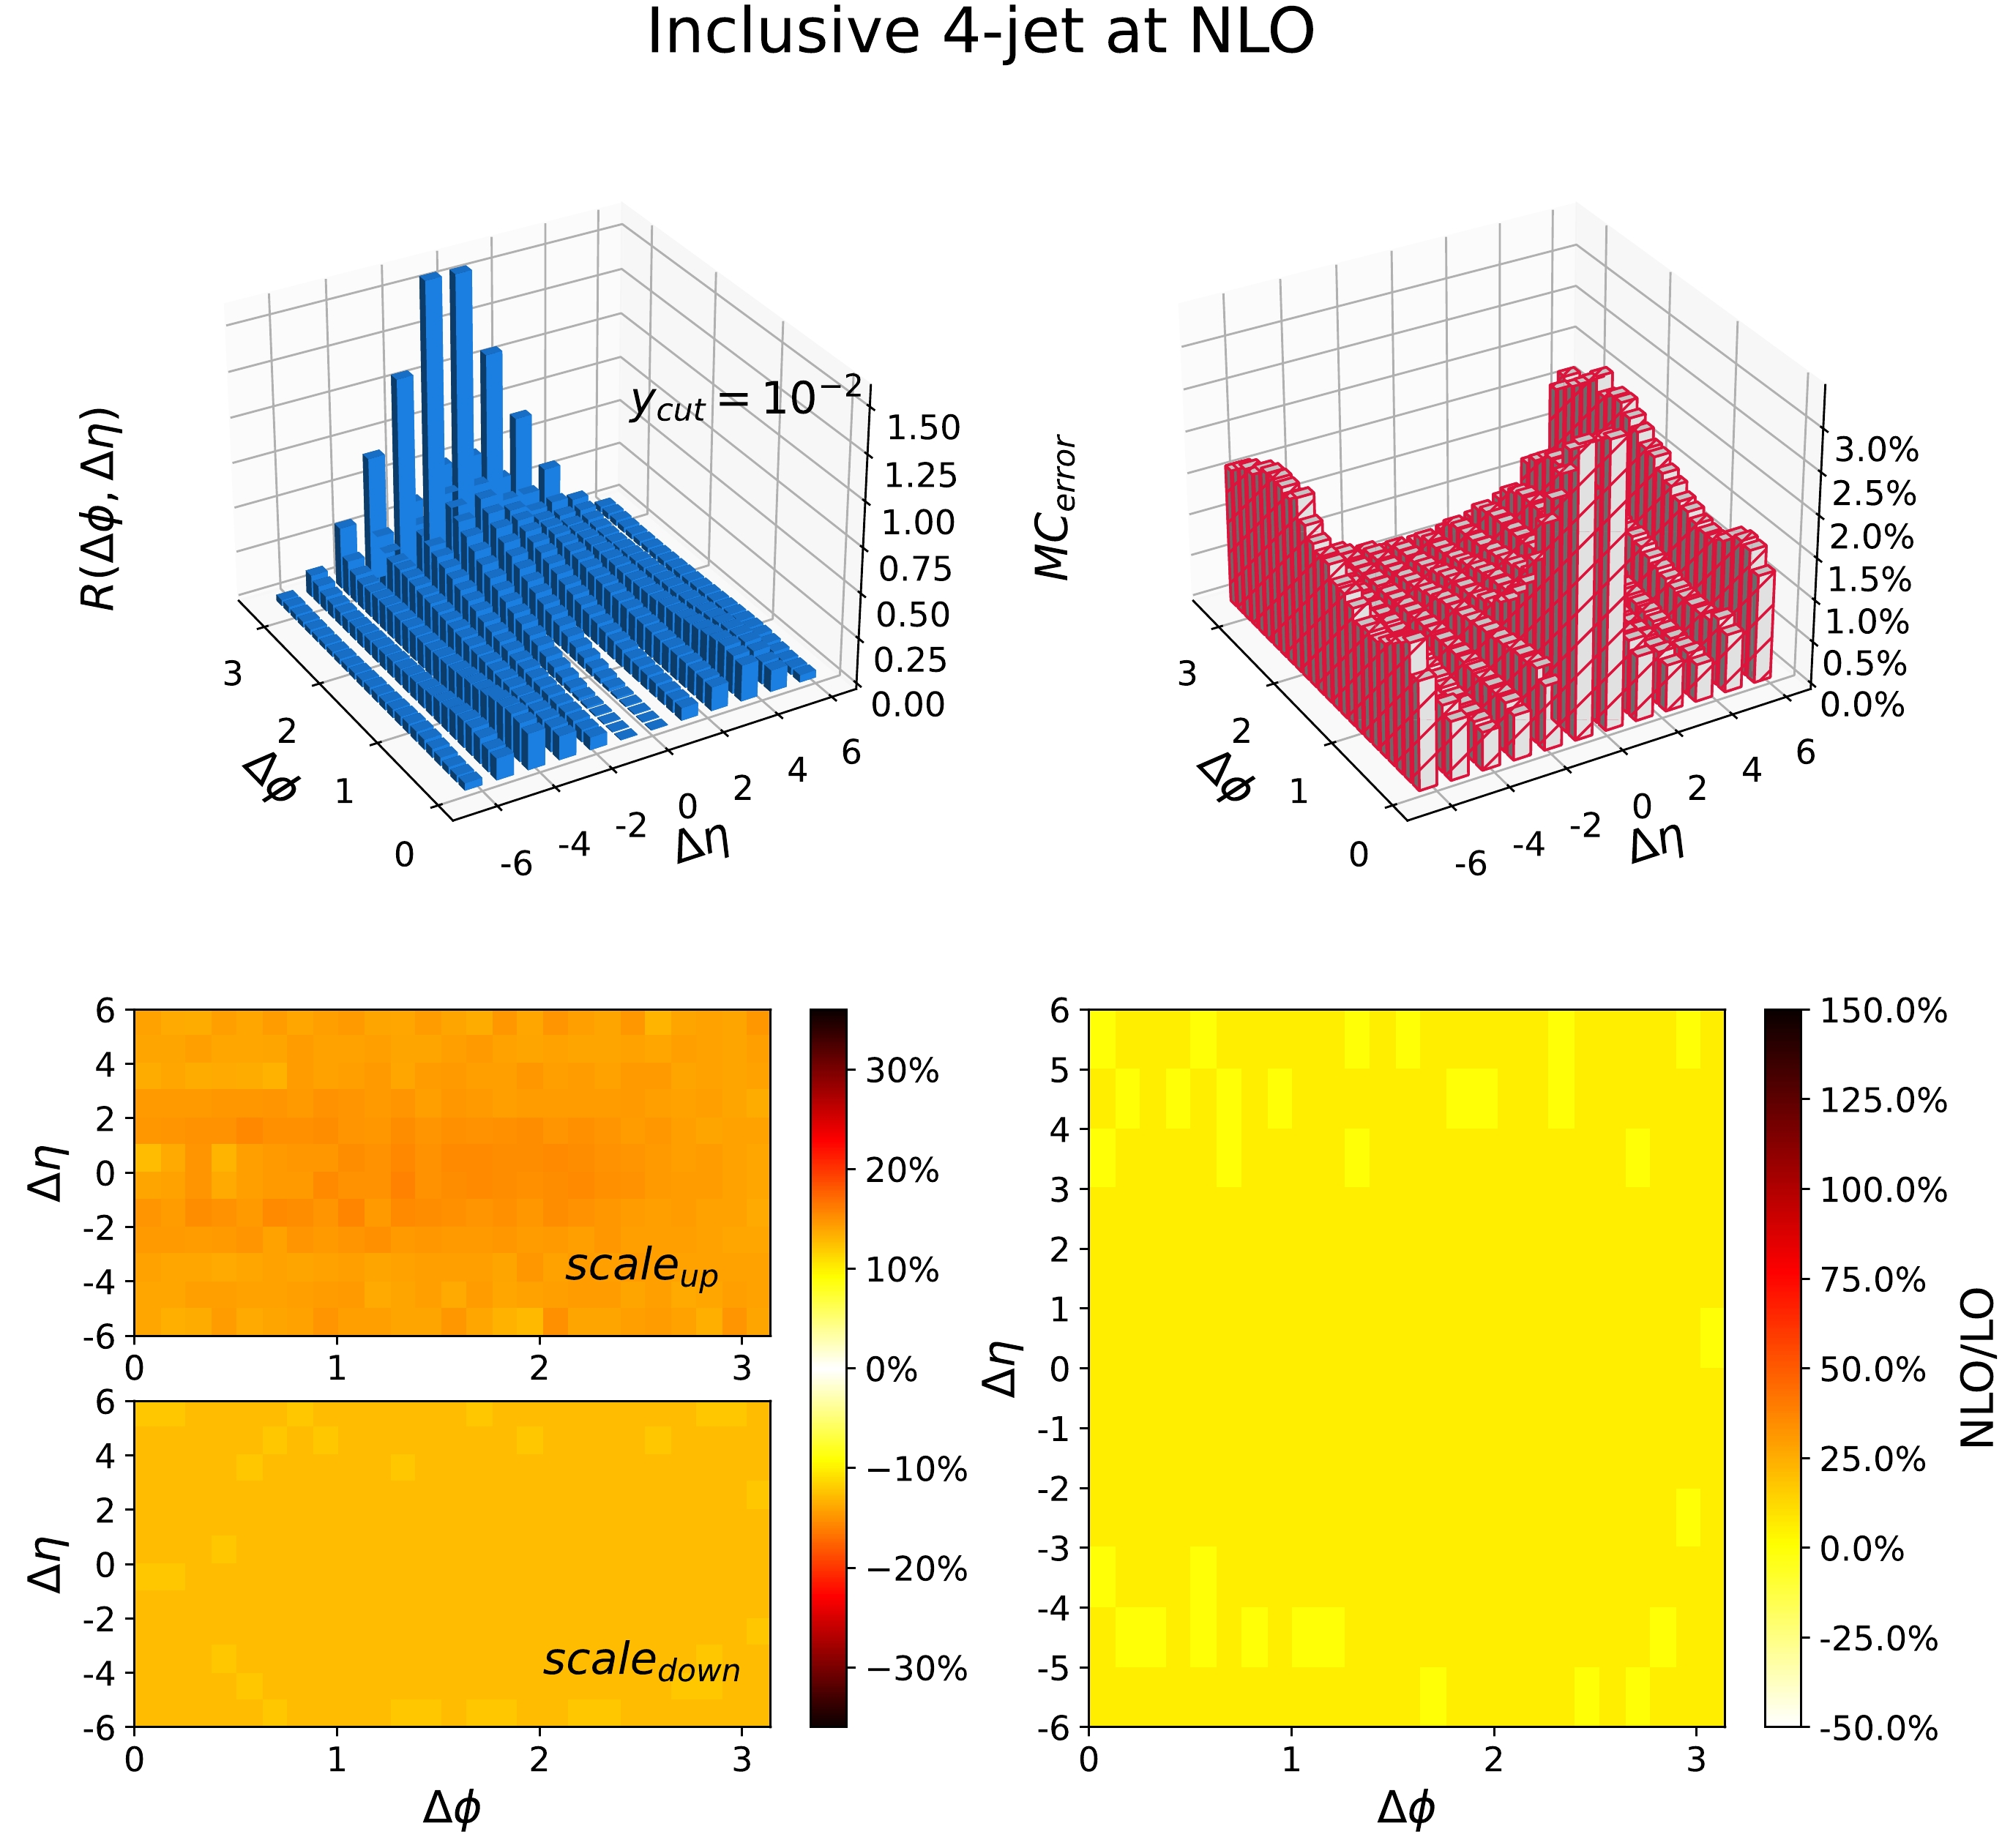
Figure 10. (color online) Long pseudo-rapidity range ϕ correlation (Ridge) distribution in the inclusive 4-jet events at NLO with
$ y_{\text{cut}} = 10^{-2} $ . The upper left panel shows the result at the central scale choice; the upper right panel shows the relative statistical error; the lower left panel illustrates the systematic error due to the scale variation, as given by Eq. (10), where$ \text{scale}_{\text{up}} $ ($ \text{scale}_{\text{down}} $ ) is the largest positive (negative) correction relative to the central scale; and the lower right panel displays the relative correction of the NLO results with respect to the LO results at the central scale.To examine the continuous evolution of the Ridge correlation, we present the distributions with different values of
$ y_{\text{cut}} $ . Figure 11 and Fig. 12 present the distribution of the Ridge in the inclusive 3-jet and 4-jet events, respectively. Specifically, for each figure, the distribution is shown for different values of$ y_{\text{cut}} $ :$ y_{\text{cut}} = 10^{-2.5} $ is presented in the upper-left part of the figure,$ y_{\text{cut}} = 10^{-3} $ in the upper-right part,$ y_{\text{cut}} = 10^{-3.5} $ in the lower-left part, and$ y_{\text{cut}} = 10^{-4} $ in the lower-right part. In Fig. 11, as the value of$ y_{\text{cut}} $ decreases, we observe that the event distributions in the intermediate$ \Delta\phi $ region gradually increase, indicating that the proportion of the inclusive 4-jet events is increasing. From Table 1, we observe that the proportion of the inclusive 4-jet events becomes predominant when$ y_{\text{cut}} = 10^{-4} $ . Thus, the distribution with the central scale choice in the lower right panel of Fig. 11 is analogous to that in the lower right panel of Fig. 12. In the region of$ (\Delta\phi,\Delta\eta)= (0,0) $ , allowing closer partons to be resolved as separate jets as$ y_{\text{cut}} $ decreases, the distribution in this area increases. Similarly, the distribution in the large$ \Delta \eta $ region also increases, attributed to the same factor. We have also calculated the corresponding PYTHIA results for$ y_{\text{cut}}=10^{-2} $ . The ridge phenomenon is observed in all these results (see Appendix C). Therefore, the parton shower does not change the conclusion from the fixed order calculation, i.e, the events are planar. We suspect that the non-perturbative effects, similar to the hadronization, can also transfer this contribution to the hadron system as partially observed in Ref. [35].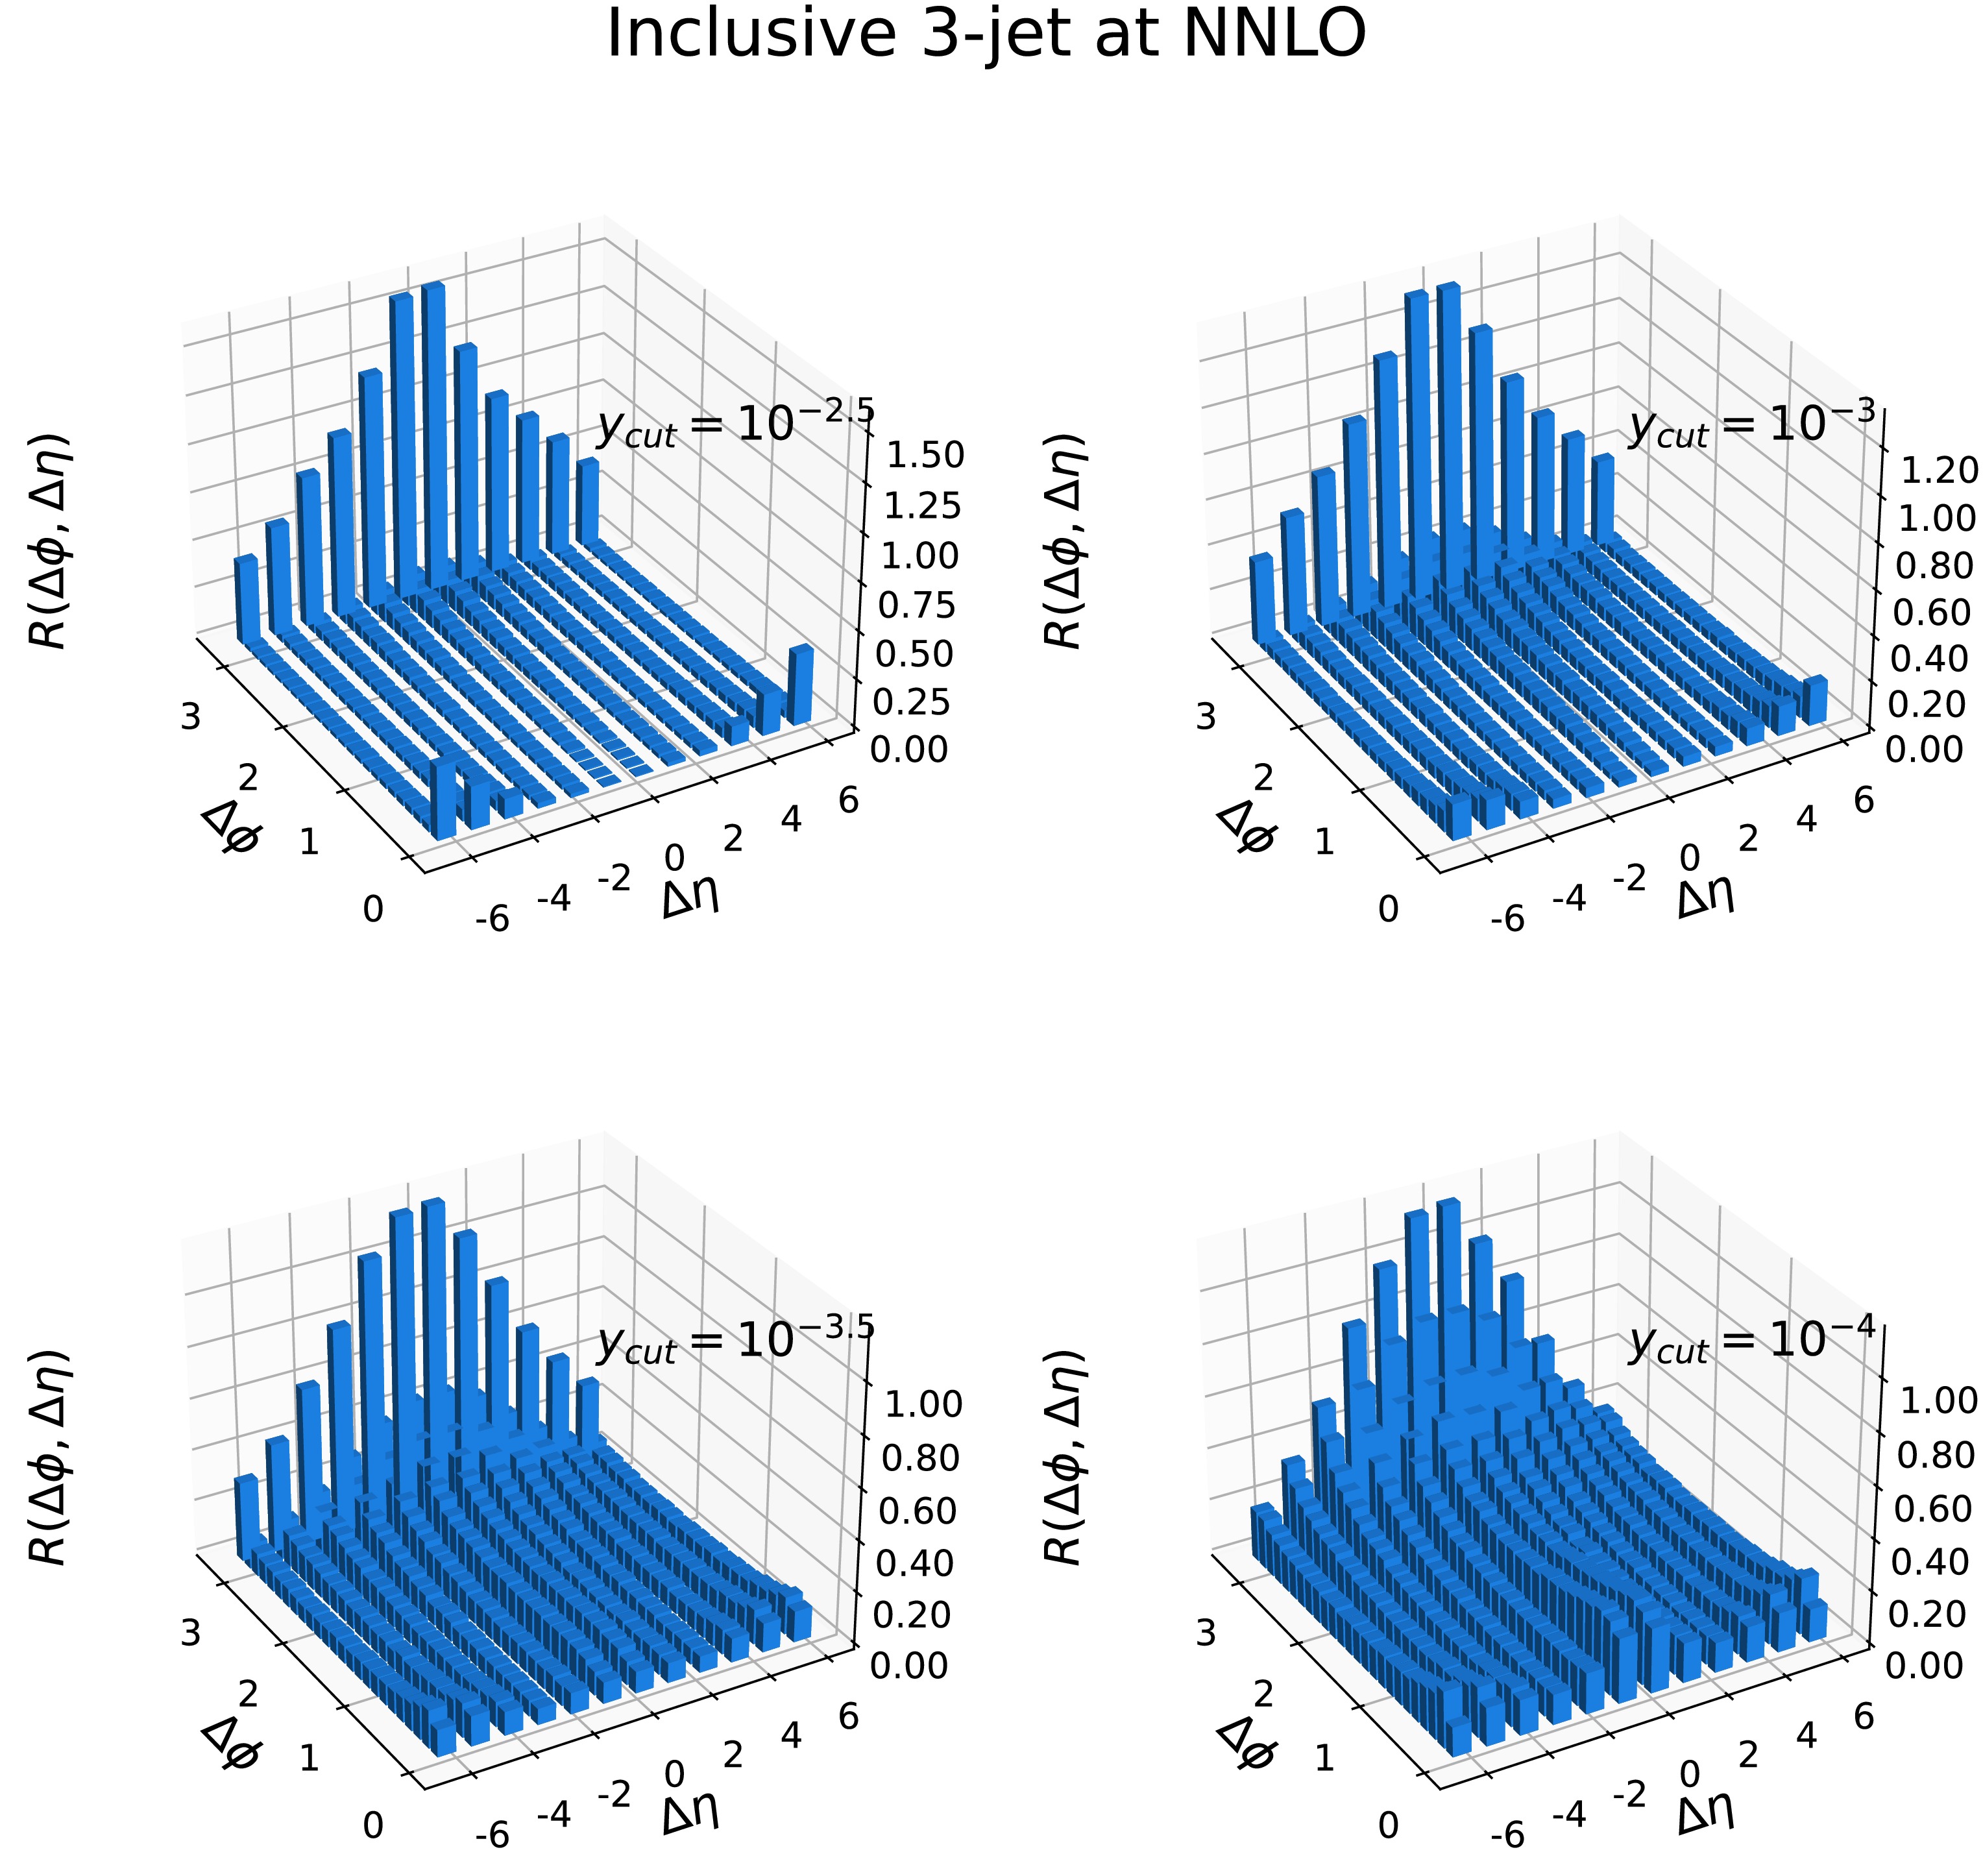
Figure 11. (color online) Long pseudo-rapidity range ϕ correlation (Ridge) distribution in the inclusive 3-jet events at NNLO for
$ y_{\text{cut}}=10^{-2.5} $ (upper left),$ 10^{-3} $ (upper right),$ 10^{-3.5} $ (lower left), and$ 10^{-4} $ (lower right).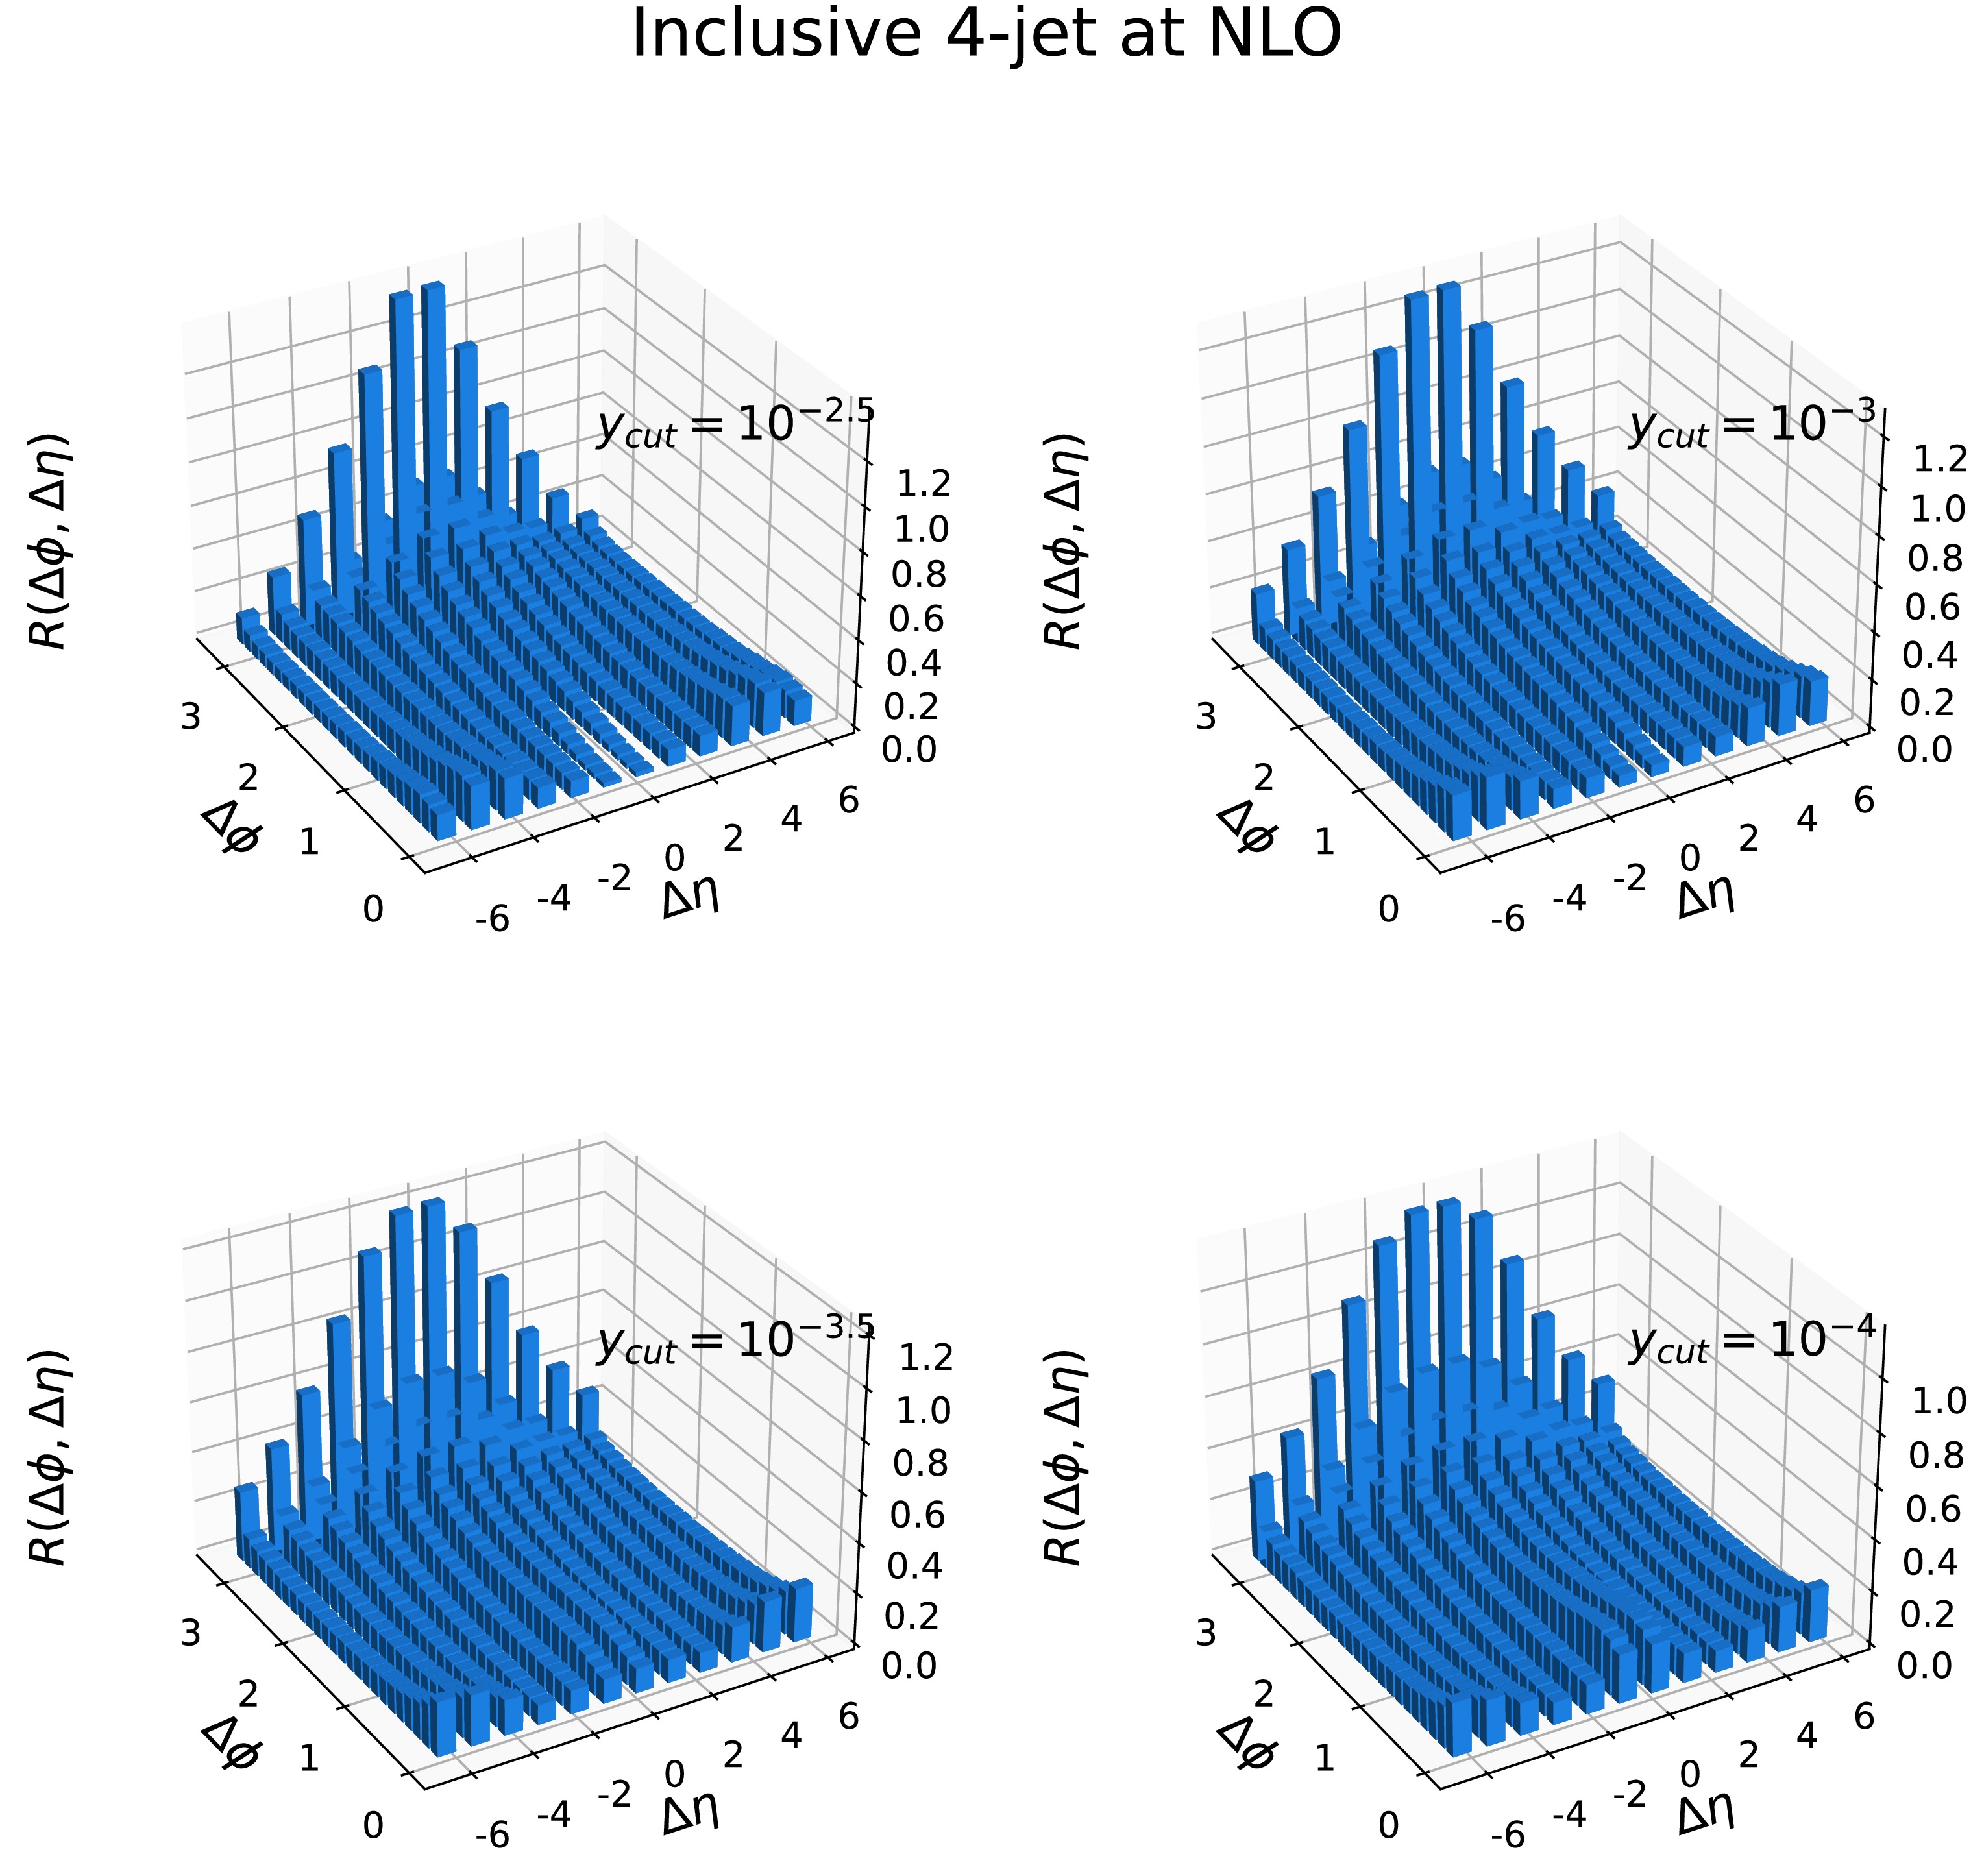
Figure 12. (color online) Long pseudo-rapidity range ϕ correlation (Ridge) distribution in the inclusive 4-jet events at NLO for
$ y_{\text{cut}}=10^{-2.5} $ (upper left),$ 10^{-3} $ (upper right),$ 10^{-3.5} $ (lower left), and$ 10^{-4} $ (lower right).The joint distribution of
$ \Delta \phi $ and$ \Delta \eta $ between the final state jets exhibits pronounced Ridge characteristics, including those with a higher multiplicity of jets. As mentioned in Section II.A, we can employ the energy-weighted joint distributions to enhance the contribution with hard jets. Figure 13 and Fig. 14 show the distributions of$ R_{EE} $ in the inclusive 3-jet events at NNLO and in the inclusive 4-jet events at NLO with$ y_{\text{cut}} = 10^{-2} $ . Compared with the relevant plots without the energy weighting, the distribution exhibits an enhancement in the large$ \Delta\eta $ region for both inclusive 3-jet and 4-jet events. This leads to a more pronounced Ridge shape. This again guarantees that the hard radiations of jets lead the whole phase space of an event to be planar in the$ e^+e^- $ annihilation process, because of the total momentum conservation. The systematic error and high-order correction remain essentially unchanged in the inclusive 3-jet and 4-jet events, suggesting that the proportion of events with soft jets is small at$ y_{\text{cut}} = 10^{-2} $ . We have also calculated the corresponding PYTHIA results and a more pronounced Ridge shape can also be observed.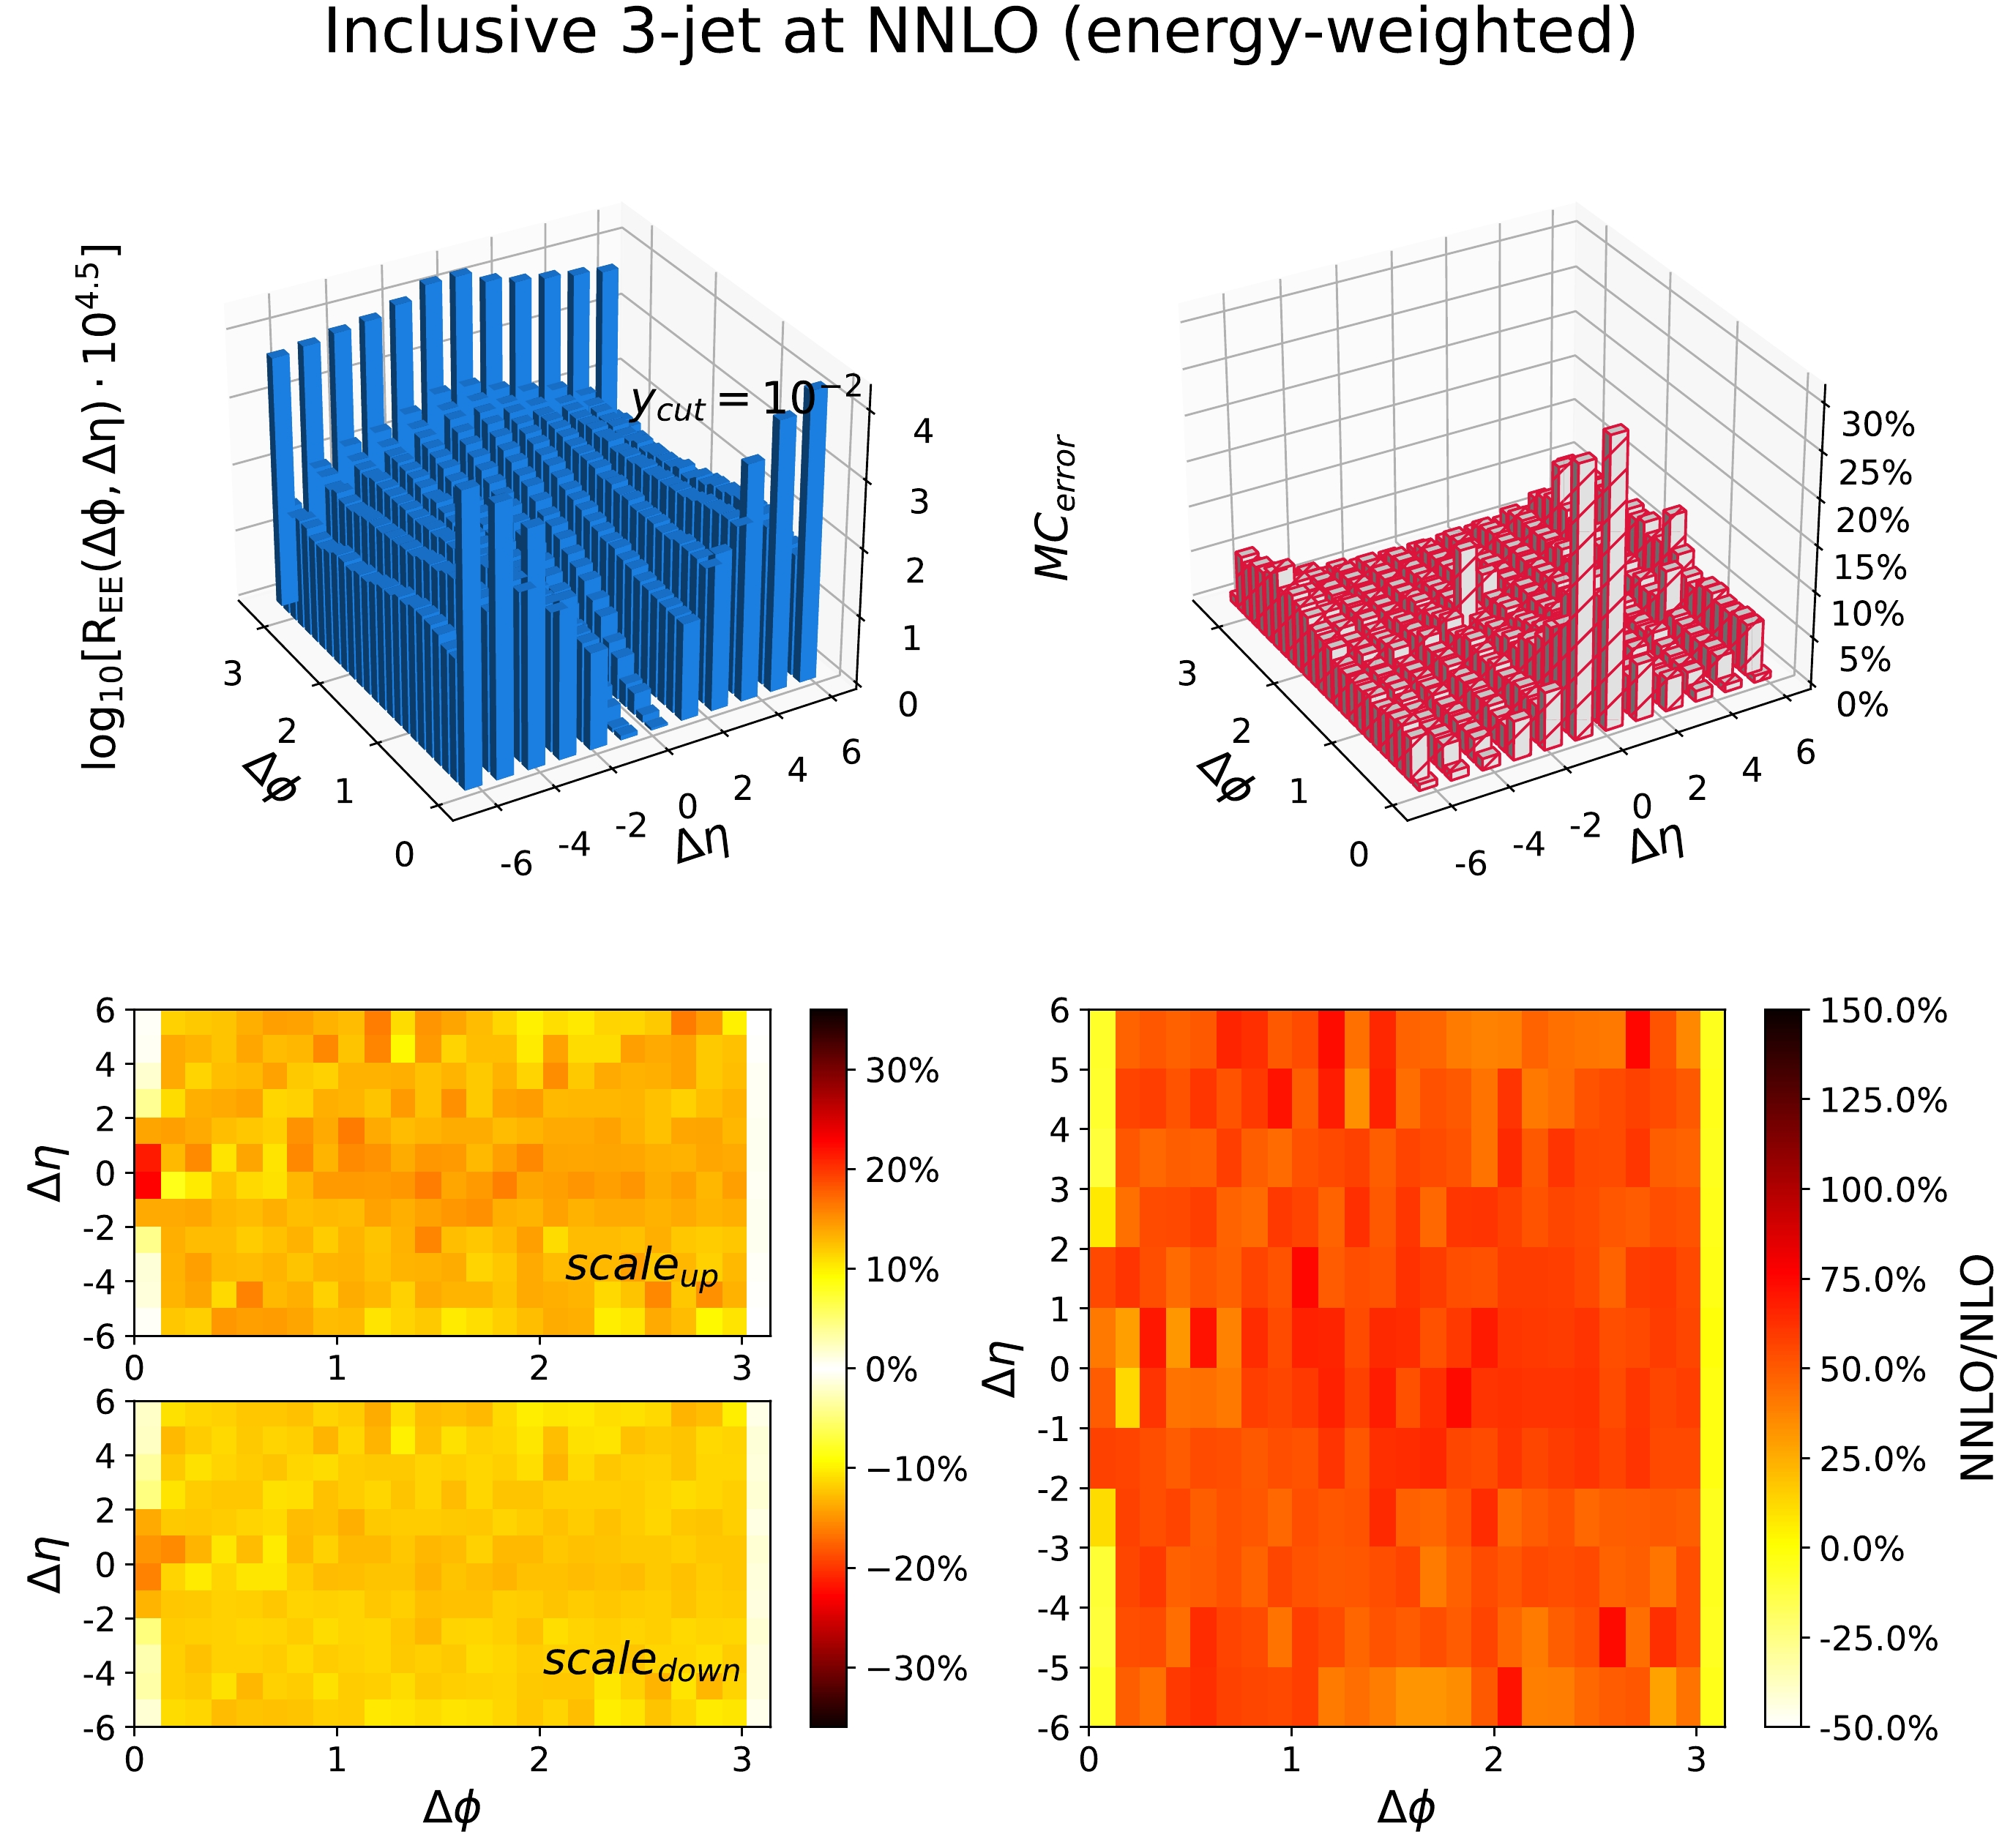
Figure 13. (color online) Long pseudo-rapidity range ϕ correlation weighted by
$ \dfrac{4E_{i}E_{j}}{s} $ ($ R_{EE} $ ) in the inclusive 3-jet events at NNLO with$ y_{\text{cut}} = 10^{-2} $ . The upper left panel shows the result at the central scale choice; the upper right panel shows the relative statistical error; the lower left panel illustrates the systematic error due to the scale variation, as given by Eq. (10), where$ \text{scale}_{\text{up}} $ ($ \text{scale}_{\text{down}} $ ) is the largest positive (negative) correction relative to the central scale; the lower right panel displays the relative correction of the NNLO results to the NLO results at the central scale.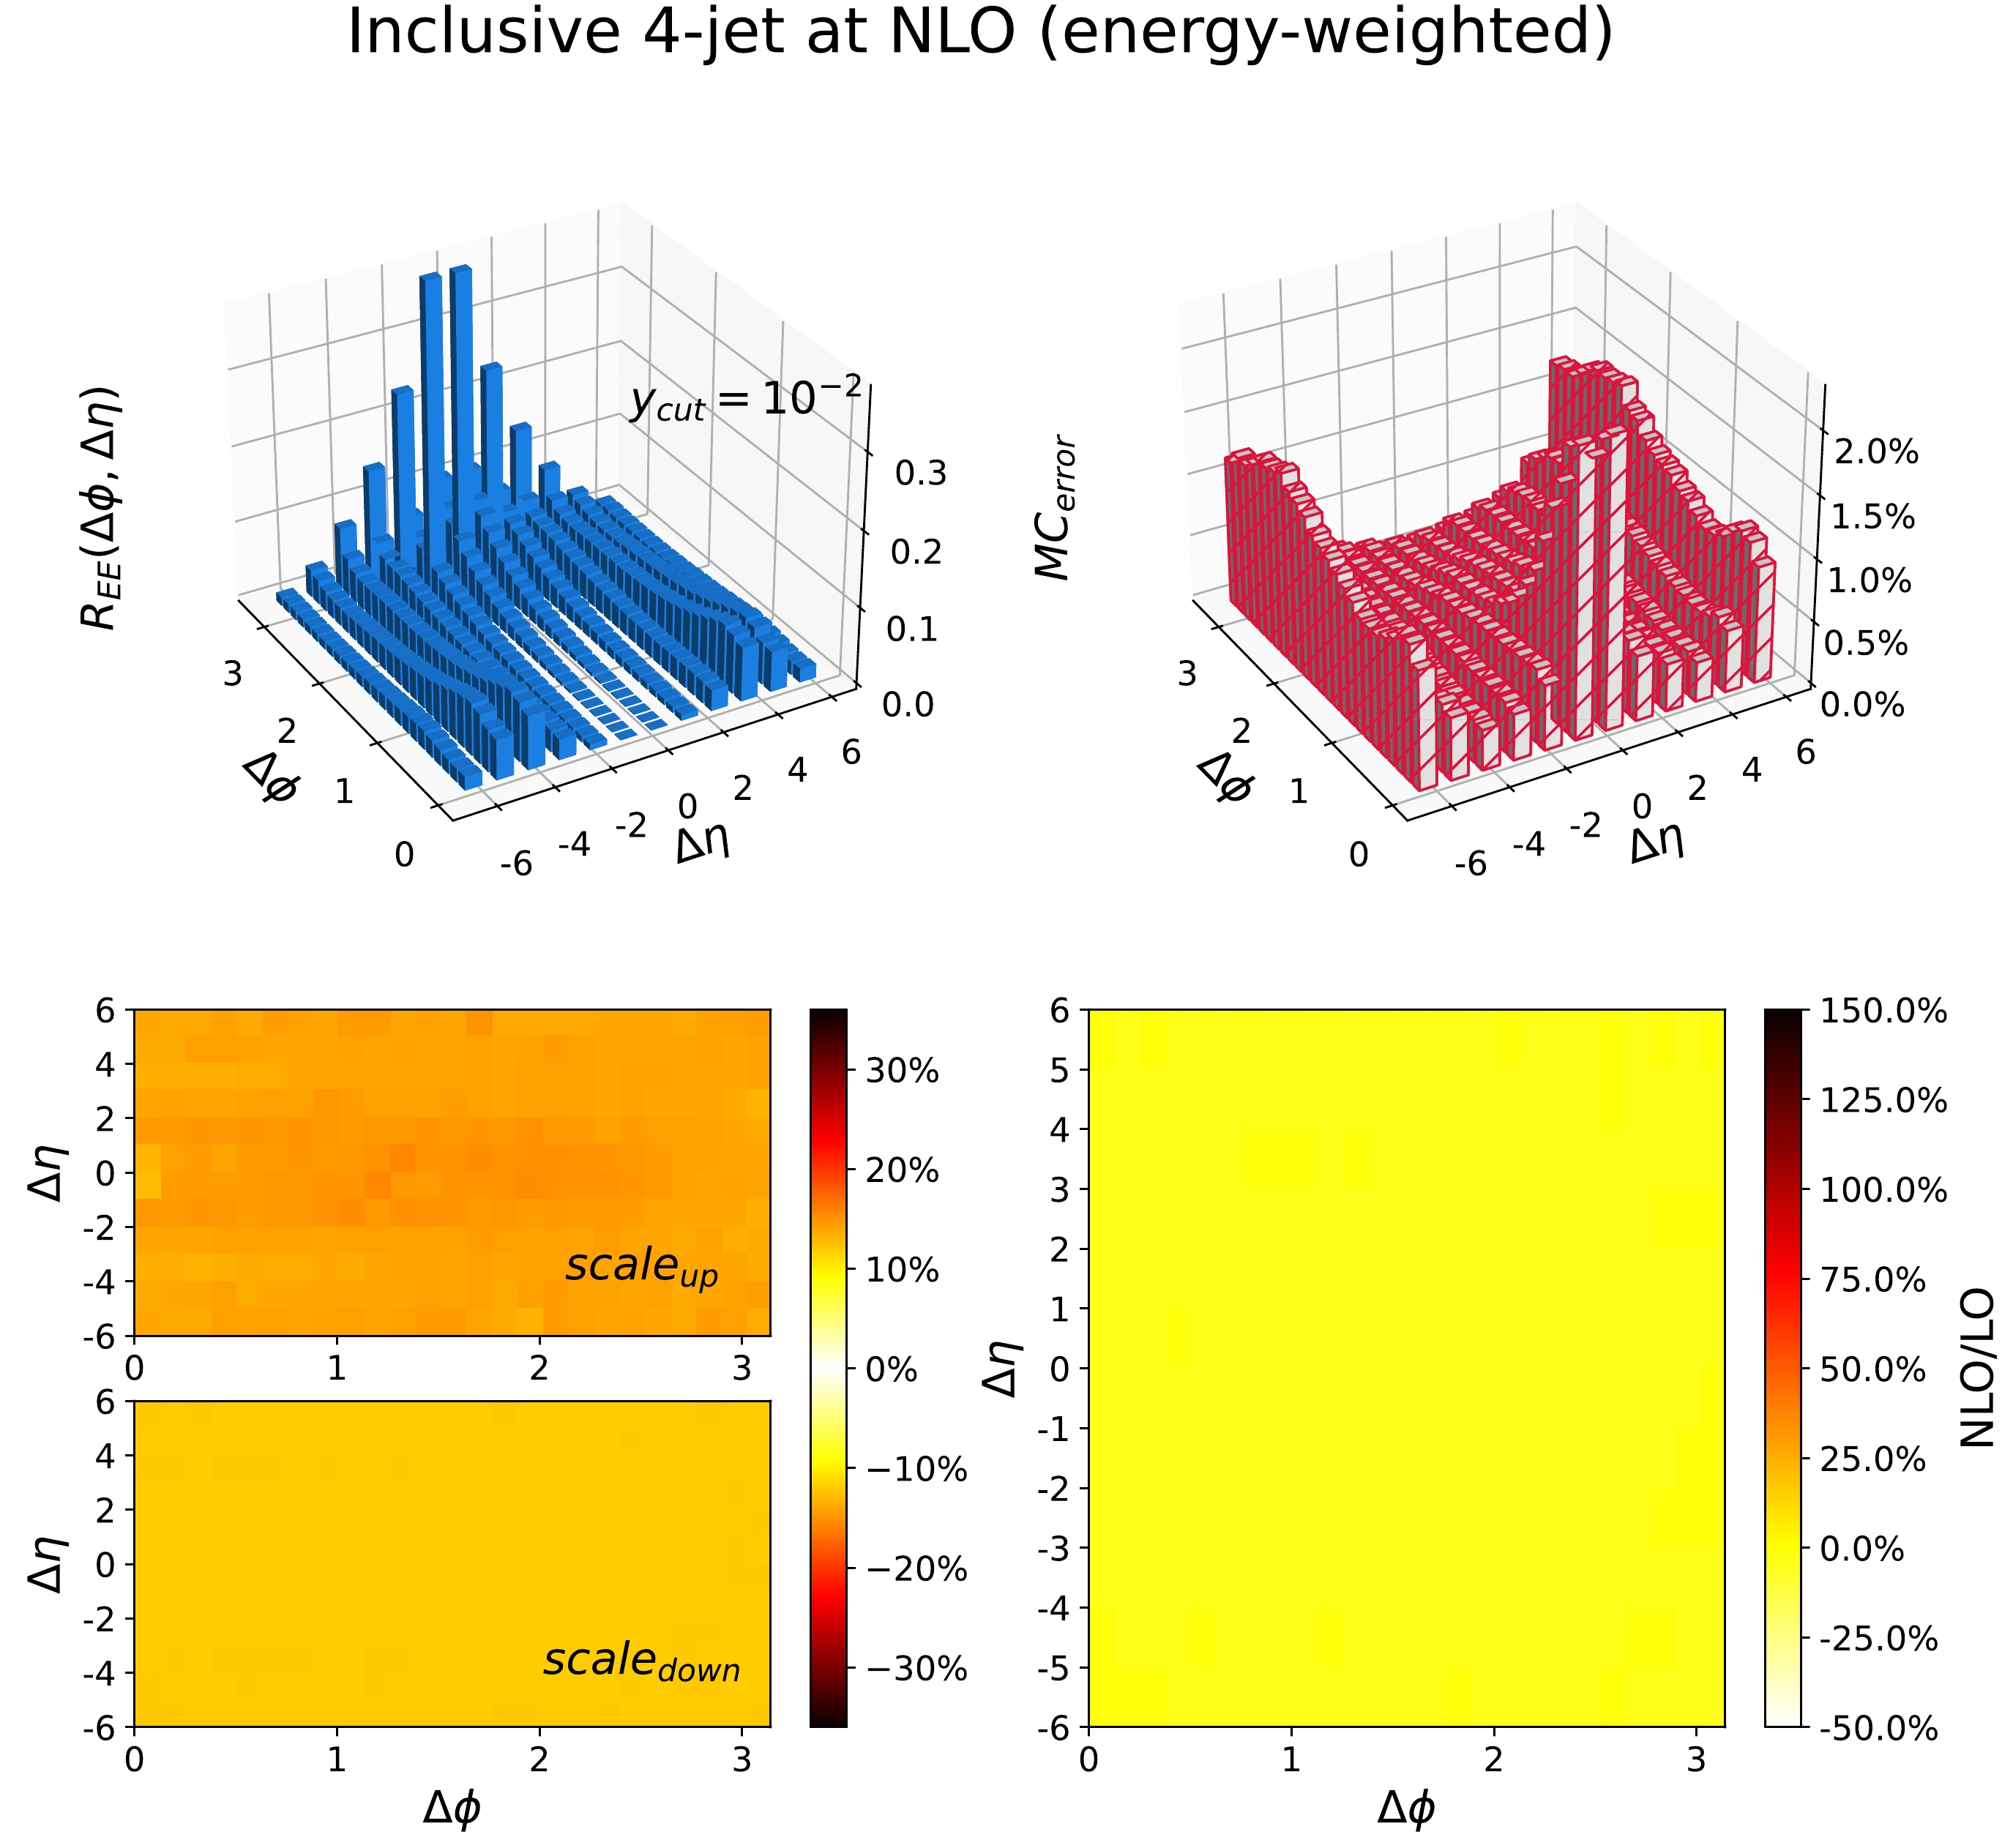
Figure 14. (color online) Long pseudo-rapidity range ϕ correlation weighted by
$ \dfrac{4E_{i}E_{j}}{s} $ ($ R_{EE} $ ) in the inclusive 4-jet events at NLO with$ y_{\text{cut}} = 10^{-2} $ . The upper left panel shows the result at the central scale choice; the upper right panel shows the relative statistical error; the lower left panel illustrates the systematic error due to the scale variation, as given by Eq. (10), where$ \text{scale}_{\text{up}} $ ($ \text{scale}_{\text{down}} $ ) is the largest positive (negative) correction relative to the central scale; the lower right panel displays the relative correction of the NLO results to the LO results at the central scale. -
The
$ e^+e^- $ annihilation process provides a clean environment for studying the anisotropy from the pQCD hard interactions. In this paper, the precise fixed order QCD predictions of high multiplicity final states are provided. By employing the event shape observables relevant to the anisotropy of the global shape of the phase space of an event, i.e., the eigenvalues of the sphericity tensor ($ \lambda_{1} $ ,$ \lambda_{2} $ ,$ \lambda_{3} $ ) and the modified planarity ($ \tilde{P} $ ) as the combination of$ \lambda_{2} $ ,$ \lambda_{3} $ , we illustrate that the multiple jet (number of jets n = 3, 4, 5) final states in$ e^+e^- $ annihilation are highly planar. As suggested in [60], we find that this fact leads to a significant Ridge-like correlations among the jet momenta. These predictions can be directly compared with the LEP data and tested in future$ e^+e^- $ colliders.This study applies NNLO QCD corrections to the inclusive 3-jet production with various values of jet resolution parameter. This is first time that NNLO corrections are considered for the Ridge-like correlations among the jet momenta. The anisotropy in the phase space is determined by the momentum conservation and the intrinsic dynamics of pQCD. We observe marginal fixed order corrections between LO and NLO distributions for
$ \lambda_{1} $ ,$ \lambda_{2} $ ,$ \lambda_{3} $ , and$ \tilde{P} $ and identify fiducial regions where the resummation of the large algorithmic terms is required. For$ \lambda_{1} $ and$ \lambda_{2} $ , we observe that the pQCD corrections converge at NNLO with reduced scale dependence at$ \pm 10 $ %. With high precision, we sharpen the fact that the global shapes of most events are oblate rather than isotropic. The difference is illustrated by the peak regions of the distributions between$ \lambda_{2} $ and$ \lambda_{3} $ . The peak of the modified planarity$ \tilde{P} $ around 1 (Fig. 8) is a strong evidence for the anisotropy in the transverse direction perpendicular to the eigenvector of$ \lambda_{1} $ . The Ridge-like correlation are confirmed in both the inclusive 3-jet final states at NNLO and inclusive 4-jet final states at NLO. In the region where$ \Delta\phi \sim \pi $ , a significant enhancement is observed, attributed to the higher order pQCD corrections. For$ \Delta\phi $ away from π and 0, where the inclusive 3-jet results at NNLO are equivalent to the 4-jet case at NLO, we observe the non-flat higher order corrections for both the Ridge and$ R_{EE} $ distributions between$ (\Delta\phi,\Delta\eta) \sim (0,0) $ and$ (\Delta\phi,|\Delta\eta|) \gt (2,3) $ regions. In the fixed order region where$ y_\text{{cut}}\geqslant 10^{-3} $ , we have not observed the convergence of pQCD for the Ridge and$ R_{EE} $ distributions. These distributions may require higher order corrections of$ e^+e^-\rightarrow $ 4-jet production at NNLO QCD accuracy in the future. Additionally, our study suggests that the resummation effects should be considered when$ y_\text{{cut}} $ is below$ 10^{-3} $ . From the results calculated using PYTHIA, we observe that the parton shower effects do not change the picture that most of events have high planarity for both inclusive 3-jet and 4-jet events.The Ridge correlations have been employed to study various non-perturbative effects of the strong interaction employing the final state hadron momenta. This means the effects of soft partons, hadronizations should be considered. Although these are beyond the approach of pQCD, by clarifying the connections between the planar property and Ridge-like correlations for multi-jet systems, this work provides precise fixed order pQCD benchmarks for probing the non-perturbative effects based on hadronic data. Similar studies on the anisotropy can be extended to hadronic (nuclear) collisions to elucidate the various properties of the strong interaction.
-
The authors would like to thank Yi Jin, Haitao Li, and Qun Wang for enlightening discussions. We are indebted to Elliot Fox, Thomas Gehrmann, Nigel Glover, Alexander Huss, and Matteo Marcoli for their feedback and encouragement to pursue this work.
-
For a cubic equation with one unknown X,
$ a X^3+b X^2+c X+d=0\enspace(a, b, c, d \in \mathbb{R}, a \neq 0), $
(A1) there are three double root discriminants
$ \left\{\begin{array}{l} A=b^2-3 a c \\ B=b c-9 a d \\ C=c^2-3 b d \end{array}\right., $
(A2) and one total discriminant
$ \Delta=B^2-4 AC . $
(A3) For
$ A=B=0 $ , we derive$ X_1=X_2=X_3=\dfrac{-b}{3 a}=\dfrac{-c}{b}=\dfrac{-3 d}{c}. $
(A4) For
$ A,B\neq 0 $ , while$ \Delta=0 $ , we obtain$ \begin{aligned}[b] & X_1=\dfrac{-b}{a}+K \\ & X_{2,3}=\dfrac{-K}{2}, \end{aligned} $
(A5) where
$ K=\dfrac{B}{A}\enspace(A \neq 0). $
(A6) For
$ \Delta>0 $ , we obtain$ \begin{aligned}[b] & X_1=\dfrac{-b-\left(\sqrt[3]{Y_+}+\sqrt[3]{Y_-}\right)}{3 a} \\ & X_{2,3}=\dfrac{-b+\dfrac{1}{2}\left(\sqrt[3]{Y_+}+\sqrt[3]{Y_-}\right) \pm {\rm{i}}\dfrac{\sqrt{3}}{2}\left(\sqrt[3]{Y_+}-\sqrt[3]{Y_-}\right) }{3 a}, \end{aligned} $
(A7) where
$ Y_{\pm}=A b+3 a\left(\dfrac{-B \pm \sqrt{B^2-4 A C}}{2}\right). $
(A8) For
$ \Delta<0 $ , we obtain$ \begin{aligned}[b] & X_1=\dfrac{-b-2 \sqrt{A} \cos \dfrac{\theta}{3}}{3 a} \\ & X_{2,3}=\dfrac{-b+\sqrt{A}\left(\cos \dfrac{\theta}{3} \pm \sqrt{3} \sin \dfrac{\theta}{3}\right)}{3 a}, \end{aligned} $
(A9) where
$ \begin{aligned}[b] & \theta=\arccos T \\ & T=\dfrac{2 A b-3 a B}{2 \sqrt{A^3}}\enspace(A>0,\enspace-1<T<1). \end{aligned} $
(A10) -
The production rate of n-jet events in electron-positron annihilation is defined as the ratio of the cross section for the exclusive n-jet events
$ \sigma_{n\text{-jet}} $ divided by the total hadronic cross section$ \sigma_{0} $ . The production rates have the following perturbative expansions, as detailed in [93]:$ \begin{aligned}[b] & \dfrac{\sigma_{3\text{-}{\rm jet}}(\mu)}{\sigma_0(\mu)}=\dfrac{\alpha_s(\mu)}{2 \pi} A_3(\mu)+\left(\dfrac{\alpha_s(\mu)}{2 \pi}\right)^2 B_3(\mu)\\ &\qquad\qquad\;\;+\left(\dfrac{\alpha_s(\mu)}{2 \pi}\right)^3 C_3(\mu)+O\left(\alpha_s^4\right), \\ & \dfrac{\sigma_{4\text{-}{\rm jet}}(\mu)}{\sigma_0(\mu)}=\quad\left(\dfrac{\alpha_s(\mu)}{2 \pi}\right)^2 B_4(\mu)+\left(\dfrac{\alpha_s(\mu)}{2 \pi}\right)^3 C_4(\mu)+O\left(\alpha_s^4\right), \\ & \dfrac{\sigma_{5\text{-}{\rm jet}}(\mu)}{\sigma_0(\mu)}=\quad\left(\dfrac{\alpha_s(\mu)}{2 \pi}\right)^3 C_5(\mu)+O\left(\alpha_s^4\right), \end{aligned} $
(B1) where μ denotes the renormalization scale. The corresponding coefficients
$ C_3 $ ,$ C_4 $ , and$ C_5 $ are derived from the coefficients of the exclusive (NNLO) three-, (NLO) four-, and (LO) five-jet rates. We compare the perturbative coefficients of the jet rate,$ C_3 $ ,$ C_4 $ under NNLOJET and CoLoRFulNNLO, and$ C_{5} $ under NNLOJET, CoLoRFulNNLO, and Sherpa at Z-pole with different values of$ y_\text{cut} $ . In the calculation of the jet rates, we select the QCD coupling constant$ \alpha_{s}=0.118 $ and total hadronic cross section$ \sigma_{0} = 4.03538(3)\times 10^{7} $ fb. -
Table B1 shows a comparison of
$ C_3 $ between NNLOJET and CoLoRFulNNLO [94]. Specifically, the first column lists different values of$ y_{\text{cut}} $ , whereas the second and third columns present the calculated values of$ C_3 $ from NNLOJET and CoLoRFulNNLO, respectively. The last column of the table indicates the deviation between the results of NNLOJET and CoLoRFulNNLO. For$ y_{\text{cut}} = 2.49\times 10^{-4} $ , a large deviation is observed between the results obtained from NNLOJET and CoLoRFulNNLO. However, when$ y_{\text{cut}} $ lies in the middle regions ($ 6.76\times 10^{-4} \leqslant y_{\text{cut}}\leqslant 2.243\times10^{-3} $ ), the deviations between the results of NNLOJET and CoLoRFulNNLO are within$ 1\sigma $ , which indicates that the results of the two methods are in agreement. As the value of$ y_{\text{cut}} $ increases,$ C_{3} $ approaches zero and then becomes positive. In this case (for$ y_{\text{cut}} \geqslant 6.097\times10^{-3} $ ), the relative statistical error of$ C_{3} $ is significant, which makes a reliable comparison difficult. In conclusion, with the current computing power, for$ C_{3} $ , the accurately-calculated results are consistent in the middle$ y_{\text{cut}} $ regions but not at$ y_{\text{cut}} = 2.49\times10^{-4} $ .$ y_{\text{cut}} $ $ C_{3} $ (NNLOJET)$ C_{3} $ (CoLoRFulNNLO)Deviation $ 6.097\cdot10^{-3} $ $ -2.92(8)\cdot10^{3} $ $ -3.09\cdot10^{3} $ $ 2.13\sigma $ $ 2.243\cdot10^{-3} $ $ -1.28(2)\cdot10^{4} $ $ -1.2771\cdot10^{4} $ $ 0.15\sigma $ $ 1.836\cdot10^{-3} $ $ -1.576(23)\cdot10^{4} $ $ -1.5681\cdot10^{4} $ $ 0.34\sigma $ $ 6.76\cdot 10^{-4} $ $ -3.415(27)\cdot 10^{4} $ $ -3.3891\cdot 10^{4} $ $ 0.96\sigma $ $ 2.49\cdot 10^{-4} $ $ -5.364(32)\cdot 10^{4} $ $ -5.2708\cdot 10^{4} $ $ 2.91\sigma $ Table B1. Comparison of
$ C_3 $ between NNLOJET and CoLoRFulNNLO [94]. The first column lists different values of$ y_{\text{cut}} $ , whereas the second and third columns present the calculated values of$ C_3 $ from NNLOJET and CoLoRFulNNLO, respectively. The last column indicates the deviation between the results of NNLOJET and CoLoRFulNNLO. -
Table B2 shows the comparison of
$ C_4 $ between NNLOJET and CoLoRFulNNLO [94]. Specifically, the first column lists different values of$ y_{\text{cut}} $ . The second and third columns present the calculated values of$ C_4 $ obtained from NNLOJET and CoLoRFulNNLO, respectively. The last column of the table indicates the deviation between the results of these two methods. We observe that all deviations between CoLoRFulNNLO and NNLOJET are within$ 2\sigma $ , except for the case corresponding to the smallest value of$ y_{\text{cut}} $ . For$ y_{\text{cut}} = 2.49\times 10^{-4} $ , we attribute the large deviation to the insufficient statistical data. Then, we selected a$ y_{\text{cut}} $ value slightly larger than$ y_{\text{cut}} = 2.49\times 10^{-4} $ (specifically,$ y_{\text{cut}} = 3.04\times 10^{-4} $ ) and found that the two results are in agreement. Thus, taking into account the influence of statistical errors, the results of$ C_{4} $ calculated by NNLOJET and CoLoRFulNNLO are in agreement.$ y_{\text{cut}} $ $ C_{4} $ (NNLOJET)$ C_{4} $ (CoLoRFulNNLO)Deviation $ 3.6883\cdot10^{-2} $ $ 2.600(7)\cdot10^{2} $ $ 2.607\cdot10^{2} $ $ 0.99\sigma $ $ 1.3569\cdot10^{-2} $ $ 1.876(4)\cdot10^{3} $ $ 1.8684\cdot10^{3} $ $ 1.63\sigma $ $ 6.097\cdot10^{-3} $ $ 4.90(1)\cdot10^{3} $ $ 4.8976\cdot10^{4} $ $ 0.63\sigma $ $ 2.243\cdot10^{-3} $ $ 1.004(5)\cdot10^{4} $ $ 1.0084\cdot10^{4} $ $ 1.00\sigma $ $ 1.231\cdot10^{-3} $ $ 1.180(6)\cdot10^{4} $ $ 1.1905\cdot10^{4} $ $ 1.65\sigma $ $ 6.76\cdot10^{-4} $ $ 9.40(8)\cdot 10^{3} $ $ 9.2938\cdot10^{3} $ $ 1.33\sigma $ $ 3.04\cdot10^{-4} $ $ -9.63(19)\cdot10^{3} $ $ -9.434\cdot10^{3} $ $ 0.94\sigma $ $ 2.49\cdot10^{-4} $ $ -1.86(2)\cdot 10^{4} $ $ -1.8059\cdot 10^{4} $ $ 2.39\sigma $ Table B2. Comparison of
$ C_4 $ between NNLOJET and CoLoRFulNNLO [94]. The first column lists different values of$ y_{\text{cut}} $ . The second and third columns present the calculated values of$ C_4 $ obtained from NNLOJET and CoLoRFulNNLO, respectively. The last column indicates the deviation between the results of these two methods. -
Table B3 shows the comparison of the total cross sections for the exclusive 5-jet events at LO between NNLOJET and Sherpa. Specifically, the first column lists the different Durham
$ y_{\text{cut}} $ values. The second and third columns present the total cross sections obtained from NNLOJET and Sherpa, respectively. The last column indicates the deviation between the results of NNLOJET and Sherpa. We observe that the deviation is within$ 2\sigma $ for all values of$ y_{\text{cut}} $ . Thus, the results of the total cross sections for the exclusive 5-jet events at LO between NNLOJET and Sherpa are consistent.$ y_{\text{cut}} $ $ \sigma_{\text{total}} $ (NNLOJET)$ \sigma_{\text{total}} $ (Sherpa)Deviation $ 1\cdot10^{-2.0} $ $ 4.789(1)\cdot 10^{4} $ $ 4.794(4)\cdot 10^{4} $ $ 1.21\sigma $ $ 1\cdot10^{-2.5} $ $ 5.523(4)\cdot10^{5} $ $ 5.526(6)\cdot10^{5} $ $ 0.41\sigma $ $ 1\cdot10^{-3.0} $ $ 3.017(2)\cdot 10^{6} $ $ 3.018(4)\cdot10^{6} $ $ 0.23\sigma $ $ 1\cdot10^{-3.5} $ $ 1.1181(5)\cdot10^{7} $ $ 1.118(1)\cdot10^{7} $ $ 0.09\sigma $ $ 1\cdot10^{-4.0} $ $ 3.261(5)\cdot10^{7} $ $ 3.259(5)\cdot10^{7} $ $ 0.20\sigma $ Table B3. Comparison of the total cross sections for the exclusive 5-jet events at LO between NNLOJET and Sherpa. The first column lists the different Durham
$ y_{\text{cut}} $ values. The second and third columns present the total cross sections obtained from NNLOJET and Sherpa, respectively. The last column indicates the deviation between the results of NNLOJET and Sherpa.Table B4 presents the comparison of the
$ C_5 $ values among CoLoRFulNNLO [94], Sherpa, and NNLOJET at different Durham$ y_{\text{cut}} $ values (listed in the first column). Specifically, the second, third, and fourth columns show the$ C_5 $ values calculated by NNLOJET, CoLoRFulNNLO, and Sherpa, respectively. The fifth, sixth, and seventh columns display the deviations between (Sherpa and CoLoRFulNNLO), (NNLOJET and CoLoRFulNNLO), and (NNLOJET and Sherpa), respectively. We observe that the deviation between NNLOJET and Sherpa is within$ 2\sigma $ across all the values of$ y_{\text{cut}} $ except for$ y_{\text{cut}} = 6.097\times10^{-4} $ . Similar to the results of$ C_4 $ , when comparing CoLoRFulNNLO with Sherpa and NNLOJET separately, the deviation is larger for$ y_{\text{cut}} = 2.49\times 10^{-4} $ than when it takes other values. We also selected$ y_{\text{cut}} = 3.04\times 10^{-4} $ , which is slightly larger than$ y_{\text{cut}} = 2.49\times 10^{-4} $ but found that the results of NNLOJET and CoLoRFulNNLO are not in agreement. In summary, considering the influence of statistical errors, the results of$ C_{5} $ calculated by NNLOJET, CoLoRFulNNLO, and Sherpa are consistent at relatively large values of$ y_{\text{cut}} $ . Specifically, for$ y_{\text{cut}}\sim 3\times 10^{-4} $ , the results from NNLOJET and Sherpa are in agreement within$ 2\sigma $ . However, the results from NNLOJET do not agree with those from CoLoRFulNNLO.$ y_{\text{cut}} $ $ C_{5}(N) $ $ C_{5}(C) $ $ C_{5}(S) $ $ \text{Dev}_{S-C} $ $ \text{Dev}_{N-C} $ $ \text{Dev}_{S-N} $ $ 1.3569\cdot10^{-2} $ $ 7.406(6)\cdot10^{1} $ $ 7.407\cdot10^{1} $ $ 7.4068(6)\cdot10^{1} $ $ 0.33\sigma $ $ 0.17\sigma $ $ 0.13\sigma $ $ 6.097\cdot10^{-3} $ $ 5.8639(24)\cdot 10^{2} $ $ 5.869\cdot10^{2} $ $ 5.855(5)\cdot10^{2} $ $ 2.8\sigma $ $ 2.13\sigma $ $ 1.60\sigma $ $ 1.836\cdot10^{-3} $ $ 4.906(2)\cdot10^{3} $ $ 4.91\cdot10^{3} $ $ 4.904(5)\cdot10^{3} $ $ 1.2\sigma $ $ 2.0\sigma $ $ 0.37\sigma $ $ 6.76\cdot 10^{-4} $ $ 1.8231(5)\cdot 10^{4} $ $ 1.8248\cdot 10^{4} $ $ 1.8258(8)\cdot 10^{4} $ $ 1.25\sigma $ $ 3.4\sigma $ $ 2.86\sigma $ $ 3.04\cdot10^{-4} $ $ 4.357(1)\cdot10^{4} $ $ 4.3613\cdot10^{4} $ $ 4.3607(19)\cdot10^{4} $ $ 0.32\sigma $ $ 4.3\sigma $ $ 1.79\sigma $ $ 2.49\cdot 10^{-4} $ $ 5.314(1)\cdot 10^{4} $ $ 5.2659\cdot 10^{4} $ $ 5.316(2)\cdot 10^{4} $ $ 25\sigma $ $ 48\sigma $ $ 0.89\sigma $ Table B4. Comparison of
$ C_5 $ values among CoLoRFulNNLO [94], Sherpa, and NNLOJET at different Durham$ y_{\text{cut}} $ values (listed in the first column). The second, third, and fourth columns show the$ C_5 $ values calculated by NNLOJET, CoLoRFulNNLO, and Sherpa, respectively. The fifth, sixth, and seventh columns display the deviations between (Sherpa and CoLoRFulNNLO), (NNLOJET and CoLoRFulNNLO), and (NNLOJET and Sherpa), respectively. -
Large logarithmic divergences in the back-to-back fiducial regions limit the prediction power of fixed order QCD calculations. We used PYTHIA 8.3 [96] to resum the leading log divergences for inclusive 3, 4-jet events to extend and exam our study. Figure 4 and Fig. 5 show the distributions of
$ \lambda_1 $ and$ \lambda_2 $ in inclusive 3-jet events for$ y_{\text{cut}} = 10^{-2} $ (left panel) and$ 10^{-3} $ (right panel). Figure C1 shows the distributions of$ \lambda_3 $ in inclusive 3-jet events for$ y_{\text{cut}} = 10^{-2} $ (left panel) and$ 10^{-3} $ (right panel). Figure C2 and Fig. C3 show the distributions of$ \tilde{P} $ in inclusive 3, 4-jet events for$ y_{\text{cut}} = 10^{-2} $ (left panel) and$ 10^{-3} $ (right panel). Figure C4 shows the distributions of the Ridge correlation in inclusive 3-jet events (left panel) and inclusive 4-jet (right panel) for$ y_{\text{cut}} = 10^{-2} $ . For the distributions of$ \lambda_1 $ ,$ \lambda_2 $ ,$ \lambda_3 $ , and$ \tilde{P} $ , we observe the same shape and peak region as in the above fixed order calculations. For the distributions of the Ridge correlation, we observe the ridge phenomenon both in inclusive 3-jet and 4-jet events. Thus, the parton shower does not change the picture that most of events have high planarity in both inclusive 3-jet and 4-jet events for$ y_{{\rm{cut}}}=10^{-2} \sim 10^{-3} $ .
Figure C1. (color online) Distribution of the event shape observable
$ \lambda_3 $ in the inclusive 3-jet events at the center-of-mass energy$ \sqrt{s}=m_Z $ for$ y_{\text{cut}} = 10^{-2} $ (left panel) and$ 10^{-3} $ (right panel), based on PYTHIA 8.3 [96].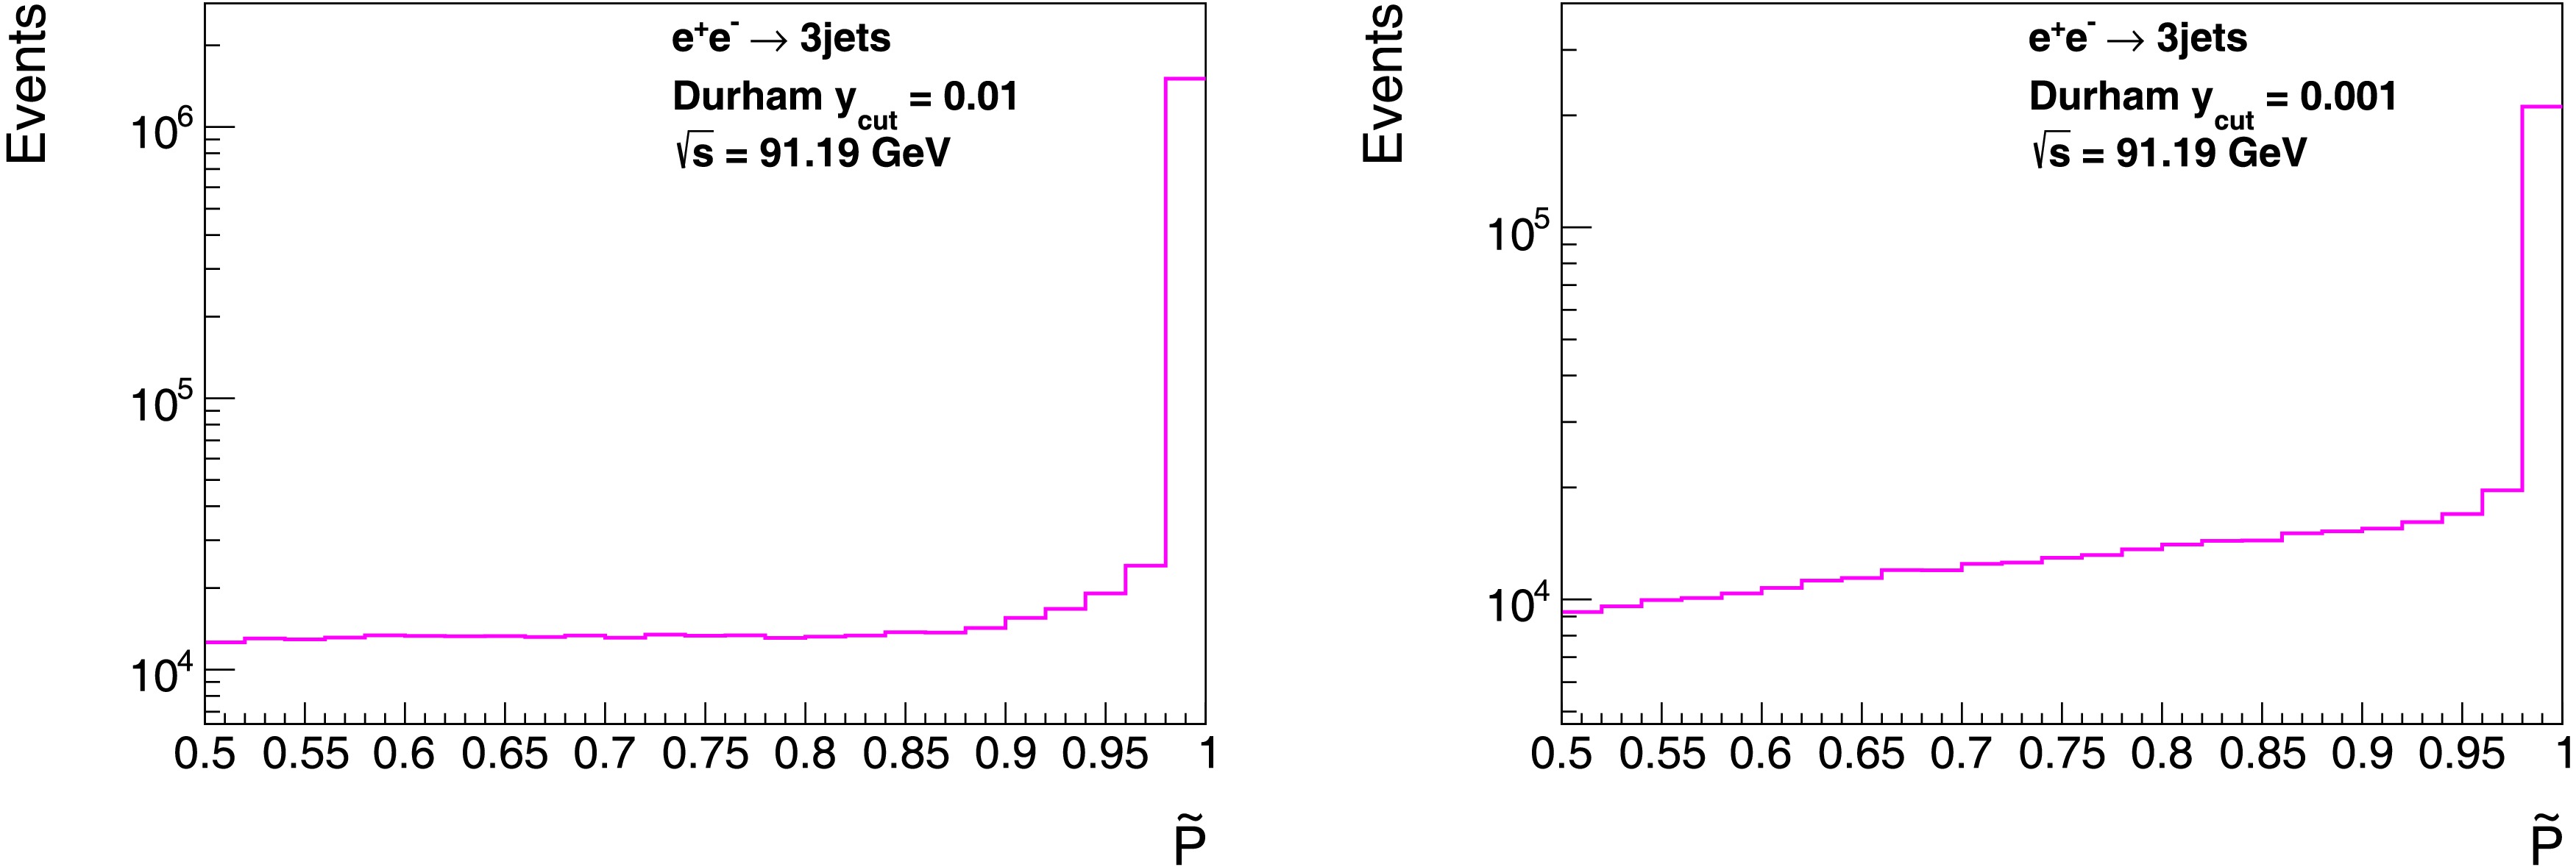
Figure C2. (color online) Distribution of the event shape observable
$ \tilde{P} $ in the inclusive 3-jet events at the center-of-mass energy$ \sqrt{s}=m_Z $ for$ y_{\text{cut}} = 10^{-2} $ (left panel) and$ 10^{-3} $ (right panel), based on PYTHIA 8.3 [96].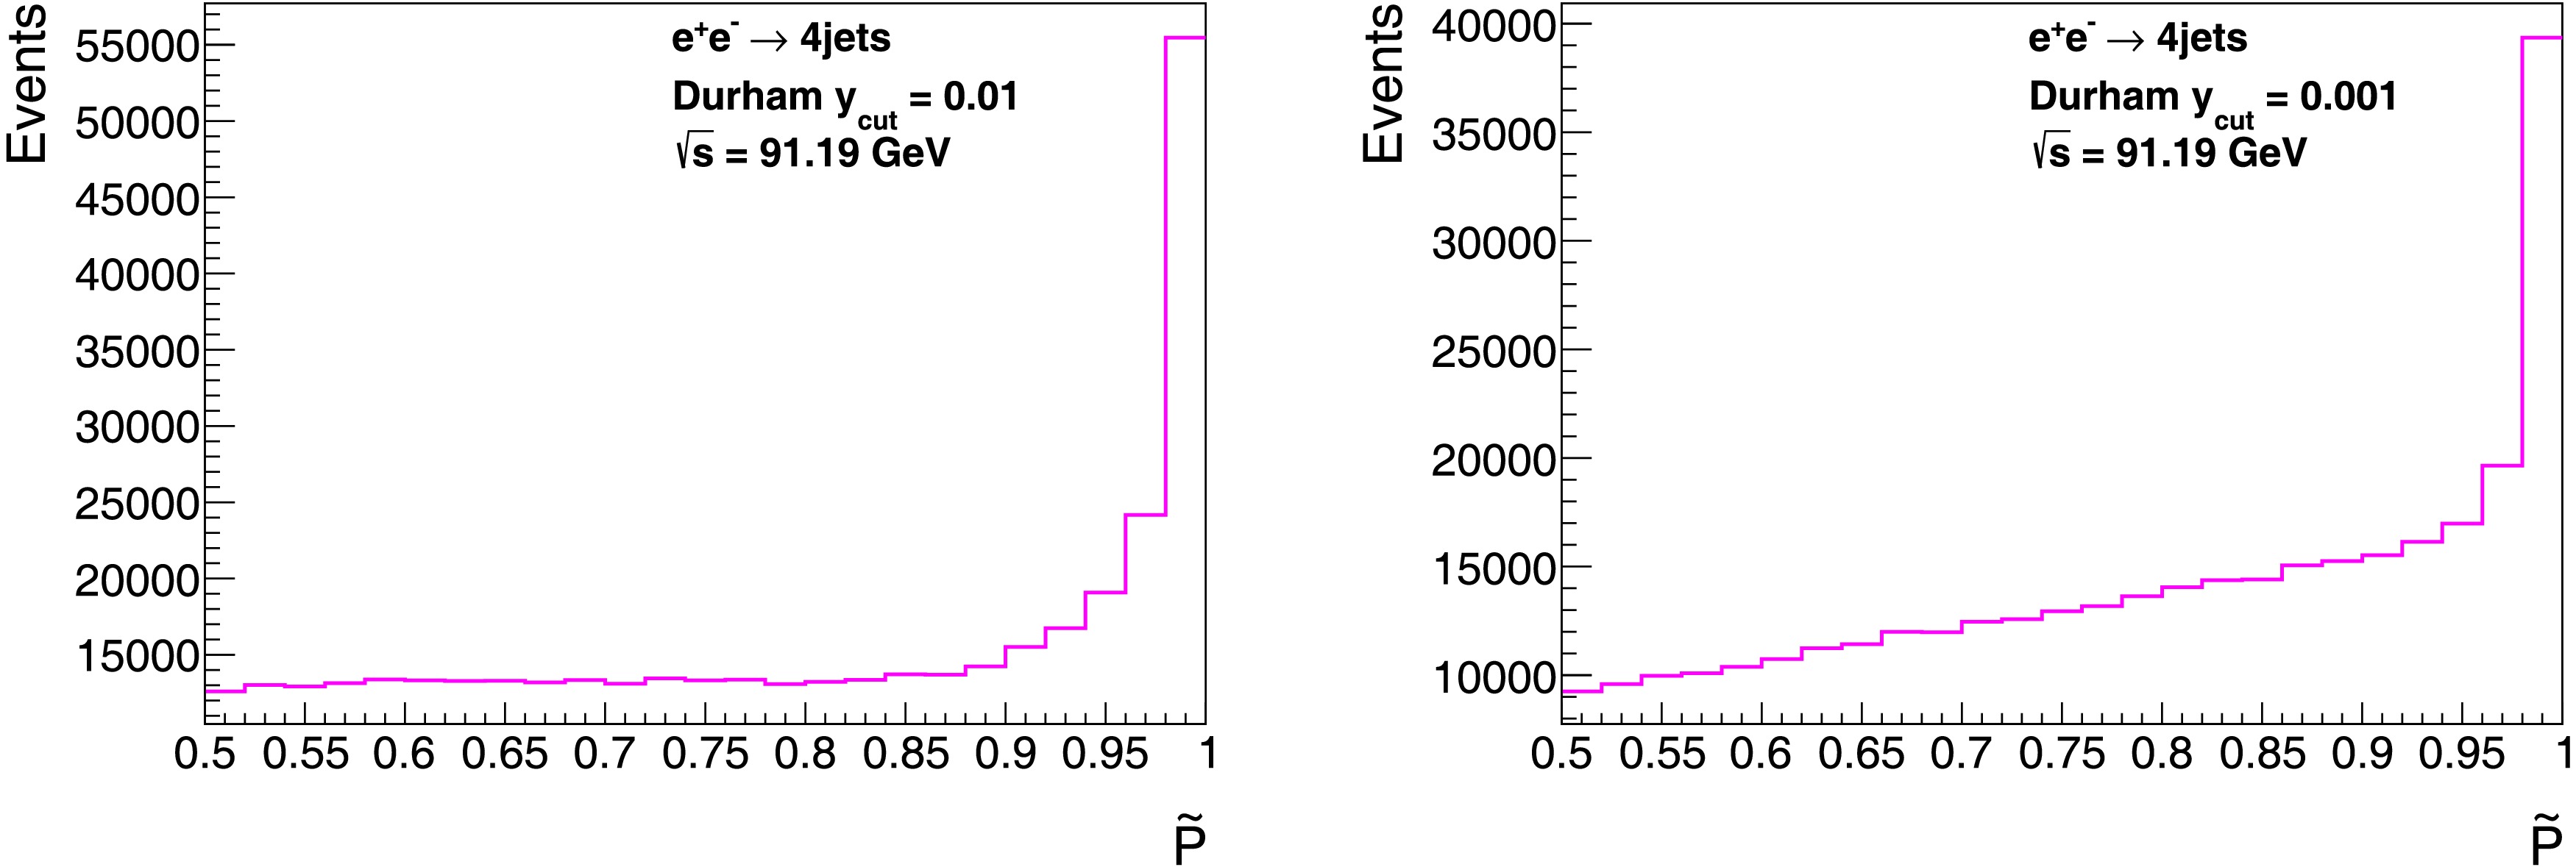
Figure C3. (color online) The distribution of the event shape observable
$ \tilde{P} $ in the inclusive 4-jet events at the center-of-mass energy$ \sqrt{s}=m_Z $ for$ y_{\text{cut}} = 10^{-2} $ (left panel) and$ 10^{-3} $ (right panel), based on PYTHIA 8.3 [96].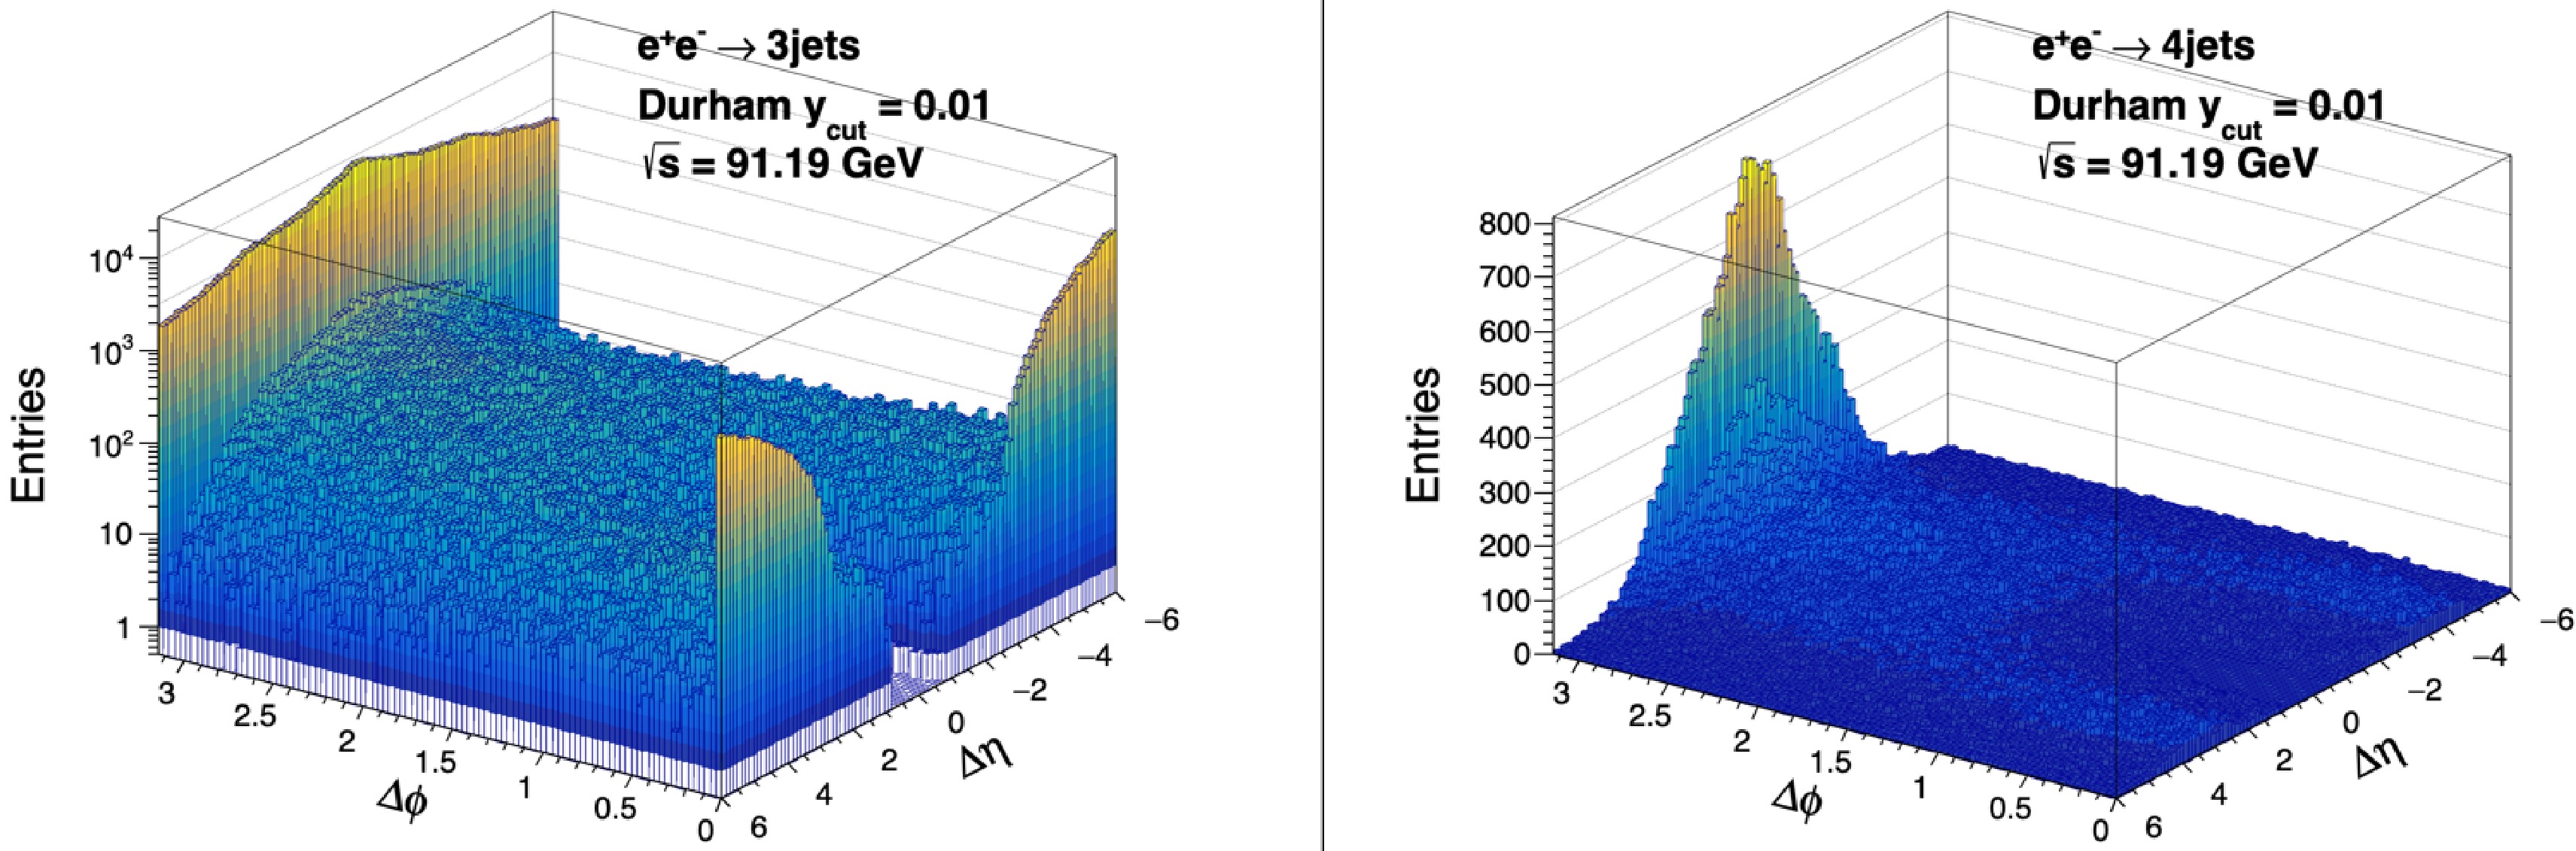
Figure C4. (color online) The distributions of the Ridge correlation in inclusive 3-jet events (left panel) and inclusive 4-jet (right panel) at the center-of-mass energy
$ \sqrt{s}=m_Z $ for$ y_{\text{cut}} = 10^{-2} $ based on PYTHIA 8.3 [96].
Planar property and long-range azimuthal correlation in e+e– annihilation
- Received Date: 2025-12-01
- Available Online: 2026-04-15
Abstract: The $ e^+e^- $ annihilation of unpolarized beams is free from initial hadron states or initial anisotropy around the azimuthal angle. Hence, it is ideal for studying the correlations of dynamical origin via final state jets. We investigate the planar properties of multi-jet events employing the relevant event-shape observables at next-to-next-to-leading order ($ {\cal{O}} $($ \alpha_{s}^{3} $)) in perturbative Quantum Chromodynamics (QCD). In particular, the azimuthal angle correlations on the long pseudo-rapidity (polar angle) range (Ridge correlation) between the inclusive jet momenta are calculated. We demonstrate that the significant planar properties and the strong correlations as the consequence are natural results of the energy-momentum conservation of the perturbative QCD radiation dynamics. Our study provides benchmarks of a hard strong interaction background for investigating the collective and/or thermal effects via the Ridge-like correlation observables for various scattering processes.


 DownLoad: