


 Abstract
 HTML
HTML Reference
 Related
 PDF
PDF


-
Accurate fission cross section data are in high demand in nuclear science and engineering [1]. For the calculation of nucleosynthesis and the design of new reactors, the uncertainties of fission cross sections are expected to be less than 1% [2]. As the main detector for fission cross section measurement, although the fission ionization chamber has several advantages including a high energy resolution, its lack of particle identification capacity for low energy events limits further improvement of measurement accuracy [3, 4]. A detector with particle identification capacity may contribute to high accuracy fission cross section measurement.
The Time Projection Chamber (TPC), proposed by David R. Nygren, is a detector with particle identification capacity [5, 6]. The TPC has the capacity for three-dimensional track (3D-Track) reconstruction of charged particles. According to the 3D-Tracks, the types of charged particles can be distinguished. In the fission cross section measurement, a major source of uncertainty is the identification between fission fragments and light-charged particles [4, 7]. The fission fragments are generated from the fission reaction, which are the events to be measured. The light-charged particles are generated from two processes. The first process is the α decay of the sample nuclei, while the second process involves the (n, lcp) reactions (neutron induced light-charged-particle emission reaction) and the recoil nuclei from neutron scattering in the sensitive region of the detector. When using the fission ionization chamber, it is difficult to separate low energy fission fragments from the light-charged particles only according to the signals of the anode and cathode. However, when using the TPC, the track parameters can be used in the particle identification process for low energy events. Therefore, the TPC is a suitable detector for high accuracy fission cross section measurement.
Many studies have investigated fission cross section measurement using the TPC. The Neutron Induced Fission Fragment Tracking Experiment (NIFFTE) project at LANSCE is a representative study [4, 8]. The NIFFTE TPC is the first TPC specialized for fission cross section measurement. In measuring the α/SF branching ratio of 252Cf, the capacity for distinguishing between the fission fragments and light-charged particles of the NIFFTE TPC has been examined [9]. Furthermore, the fission cross section ratios of 238U/235U in the 2~30 MeV region and 239Pu/235U in the 100 keV~100 MeV region have been measured, and results with uncertainties less than 1.5% have been obtained [10−12], inspiring the prospect of high accuracy fission cross section measurement using the TPC. In addition to the NIFFTE project, other studies have been devoted to the fission TPC, including the Fission Detector at the Interface with AStrophysics (FIDIAS) project of CEA-Irfu (France) and NCRS-Demokritos (Greece) [13, 14] and the f-TPC project of China Academy of Engineering Physics (CAEP) (China) [15]. Fission cross section measurement has become a frontier of TPC related research.
The authors have been working on fission cross section measurement using the TPC. The Multi-purpose Time Projection Chamber (MTPC) has been built at the China Spallation Neutron Source (CSNS) Back-n white neutron source for cross section measurement of different types of nuclear reactions [16]. The electronics, amplification structure, and track reconstruction capacity of the MTPC have been examined using several test experiments [17−19]. Using the early version of the MTPC set at Peking University (PKU), the method of measuring the fission cross section based on the mono-energetic neutron source has been established and optimized [20], and the fission cross sections of 232Th at five neutron energies in the 4.50~5.40 MeV region have been measured [21]. The results are consistent with the evaluation data in the CENDL-3.2, ENDF/B-VIII.0, JENDL-4.0, BROND-3.1, and ROSFOND-2010 libraries with uncertainties less than 5%, showing the potential of high accuracy fission cross section measurement using the MTPC [22]. In this study, measurement of fission cross sections using the MTPC was extended from mono-energetic to Back-n white neutron sources at CSNS.
The CSNS Back-n white neutron source can provide neutrons from the thermal energy to several hundreds of MeV [23]. The fission cross sections of 232Th are smaller than 10-3 b in the region of En < 1 MeV [24], which are too low for initiating measurement. Therefore, for the first fission cross section measurement using the MTPC at the CSNS Back-n white neutron source, the 235U(n, f) reaction was measured. The measurement method of the cross sections of the 235U(n, f) reaction was established, and the cross sections were measured both at 43 and 215 energies from 0.5 eV to 10 keV. The Time-Of-Flight (TOF) method was used to determine the neutron energy, and the Li-Si detector array was used to measure the neutron energy spectrum [25, 26].
This study involves the first fission cross section measurement at the CSNS Back-n using the MTPC as the fission detector. The remainder of this paper is organized as follows. The experimental details are described in Sec. II. The data processing is outlined in Sec. III. The results and discussion are presented in Sec. IV. Finally, the conclusions are drawn in Sec. V.
-
The experiment was performed at Endstation #2 of the CSNS Back-n white neutron source. Figure 1 shows a schematic of the experimental setup, which consisted of four parts from right to left: neutron source, Li-Si detector array as the neutron detector, MTPC as the particle detector, and 235U sample. The neutron flight path was 77.0 ± 0.1 m. All the instruments were placed in the 0° direction with respect to the neutron beam line.
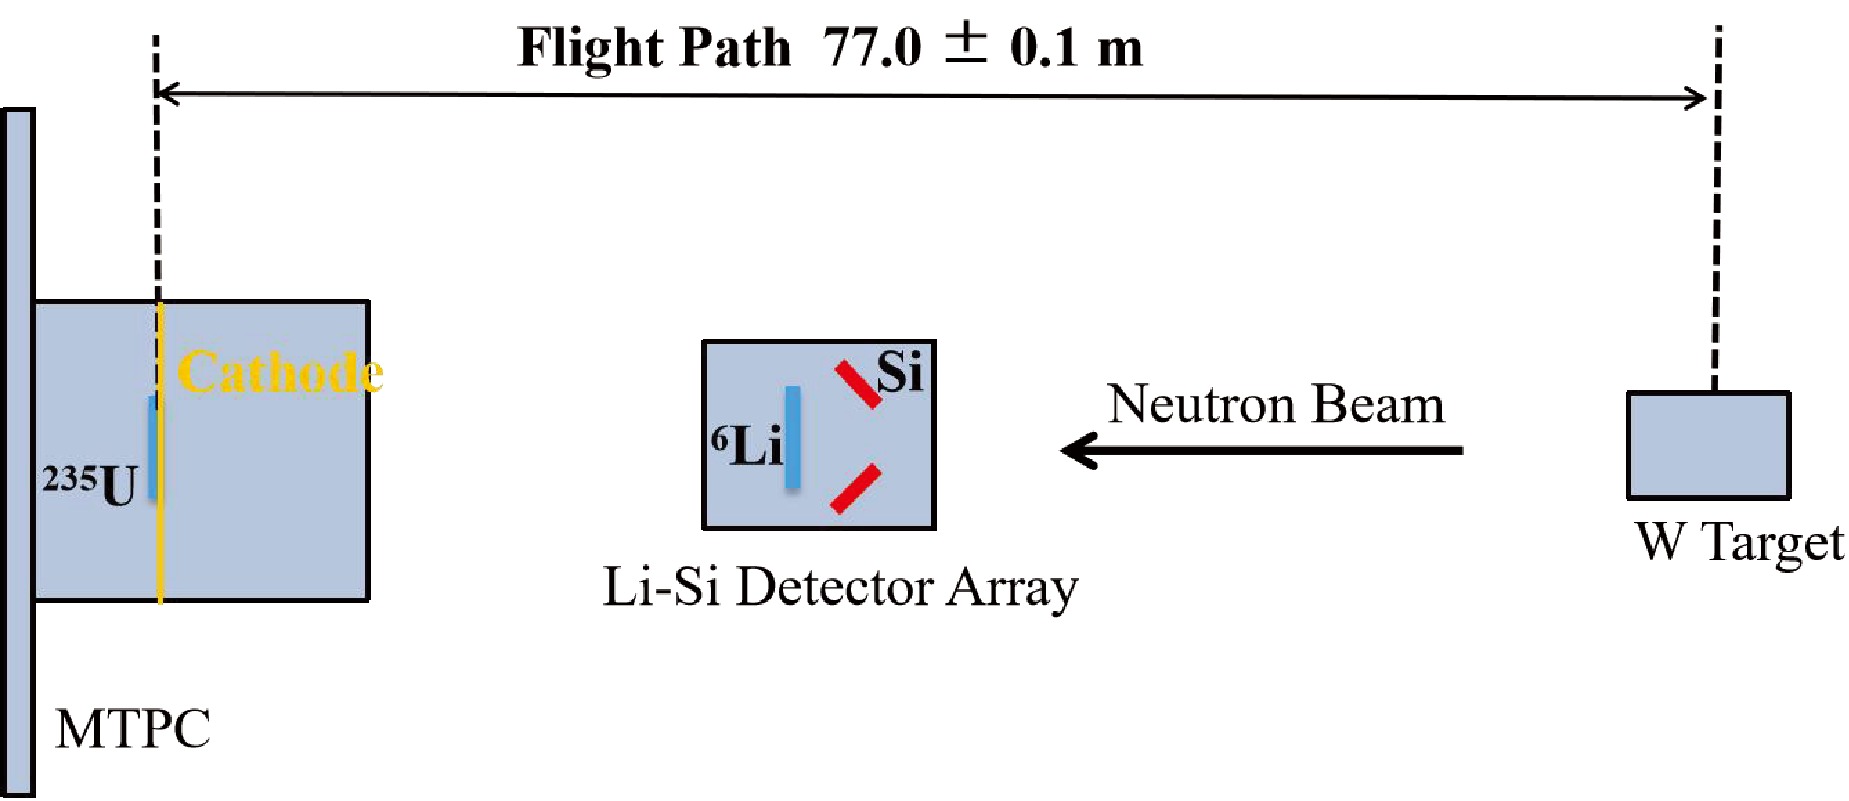
Figure 1. (color online) Schematic of the experimental setup.
-
The CSNS neutron source is a spallation neutron source designed for nuclear science and basic scientific research [27]. Numerous experiments based on CSNS have been conducted since 2018. The neutrons were generated from the proton-induced spallation reaction. The pulsed protons with 25 Hz repetition frequency were accelerated to 1.6 GeV through the linear accelerator and the rapid cycling synchrotron. The protons bombarded the tungsten target, and the neutrons with the energy range from thermal to several hundreds of MeV were produced [22, 28]. Utilizing the back-streaming neutrons, the CSNS Back-n white neutron source was established for measurements of nuclear data, and a schematic of the white neutron source is presented in Ref. [23]. During this study, the beam power was 170 kW, and the beamline configurations were Φ12 mm (shutter) + Φ15 mm (collimator1) + Φ40 mm (collimator2) with a beam profile of Φ30 mm at Endstation #2.
The neutron energy range used in this study was from 0.5 eV to 10 keV. In this study, the neutron energy bins were distributed in equal logarithm intervals both at 43 energies (10 energy bins per magnitude in equal logarithm intervals) and at 215 energies (50 energy bins per magnitude in equal logarithm intervals). When the neutron energy bins were distributed at 43 energies, the fission counts in most neutron bins were more than 500, with statistical uncertainty less than 4.5%.
The TOF method was adopted for the measurement of the energy of the incident neutron inducing the fission event [29]. The time when the proton bunch hit the tungsten target was recorded as T0. The cathode and anode pad signals of the MTPC also carried time information, from which the time of the fission reaction, T1, could be determined. The time information of the cathode signals was normally used in the TOF method. If the cathode signals were unavailable, the time information of the pad signals was used. The TOF of the neutron, ΔT, could be calculated by
$ \Delta {T=}{T}_{1}-{T}_{0}\text{,} $
(1) where
$ \Delta {T} $ is the neutron energy. Thus, the neutron energy could be determined. -
The Li-Si detector array was adopted as the neutron detector for measuring the neutron energy spectrum and monitoring the neutron flux at the CSNS Back-n white neutron source [25]. Two Li-Si detector arrays were set at Endstations #1 and #2, respectively. The thin 6LiF sample with a diameter of 80 mm was installed inside the neutron pipeline. The thickness of the 6LiF sample was ~350 μg/cm2. In the direction of 135° with respect to the neutron beam direction, eight identical Si detectors were installed isotropically around the 6LiF sample. The sensitive area of each Si detector was 20 mm × 20 mm, and the distance between the centers of the Si detector and the 6LiF sample was 50 mm. The Si detector was used for the detection of the α particles and tritons from the 6Li(n, t)4He reaction. The differential cross sections of the 6Li(n, t)4He reaction have already been measured systematically by us based on the CSNS Back-n white neutron source [29]. Therefore, the neutron energy spectrum can be calculated from the spectrum of the α particles and tritons measured by the Si detectors. In this study, the Li-Si detector array at Endstation #2 was used for the measurement of the neutron energy spectrum, and the data from seven Si detectors were used in the data analysis.
-
The MTPC was adopted as the particle detector in the measurement. The basic structure of the MTPC was almost the same as that in Refs. [20, 21]. The electronics of the MTPC were detailed in Ref. [17]. The 235U sample was mounted at the center of the cathode, and the forward fission fragment of the 235U(n, f) reaction could be detected.
The MTPC adopted in this study has one major difference from the previous version described in Refs. [20, 21]. The chamber and the anode plane were redesigned, so that the pressure of the working gas could be adjusted. Therefore, an appropriate gas pressure could be selected for better measurement results. Two principles were adopted in the selection of the gas pressure. Firstly, the track length of the fission fragment was as large as possible, which benefited the track reconstruction process. Secondly, the fission fragment deposited all the energy in the sensitive volume of the MTPC. The 75% Ar + 25% CH4 mixture was chosen as the working gas. The rather higher CH4 content was adopted to reduce the electrode spark caused by the recoil nuclei from experience. Based on the two principles and from previous tests, the appropriate gas pressure of the 75% Ar + 25% CH4 mixture was 6.0×10⁴ Pa.
The determination of the electrode voltages of the MTPC was mainly based on the test experiment in which the 252Cf spontaneous fission source was used. The 252Cf source was mounted at the center of the cathode of the MTPC, and the counting rate of the spontaneous fission fragments was measured when the voltages of the mesh and the cathode changed. According to the test experiment result, when the absolute value of the mesh voltage was above 200 V, the measured counting rate of the fission fragments was almost unchanged, consistent with the fission rate of the 252Cf source. However, the measured counting rate of the decay α particles from the 252Cf source increased rapidly when the absolute value of the mesh voltage increased. For the fission cross section measurement, the decay α particles constituted the major interference events; therefore, the measured α counting rate was sufficiently low. Thus, the mesh voltage was chosen as −240 V, and the corresponding cathode voltage was chosen as −1080 V [20].
-
Figure 2 shows the picture of the 235U sample. The material of the 235U sample was 235U(OH)4. The diameter of the circular 235U sample was 40 mm, and the substrate was tantalum foil with a diameter of 50 mm. Using the small solid angel method [30, 31], the number of nuclei was measured based on the energy spectrum of the decay α particles. The number of 235U nuclei was (1.76±1.1%)×1018.
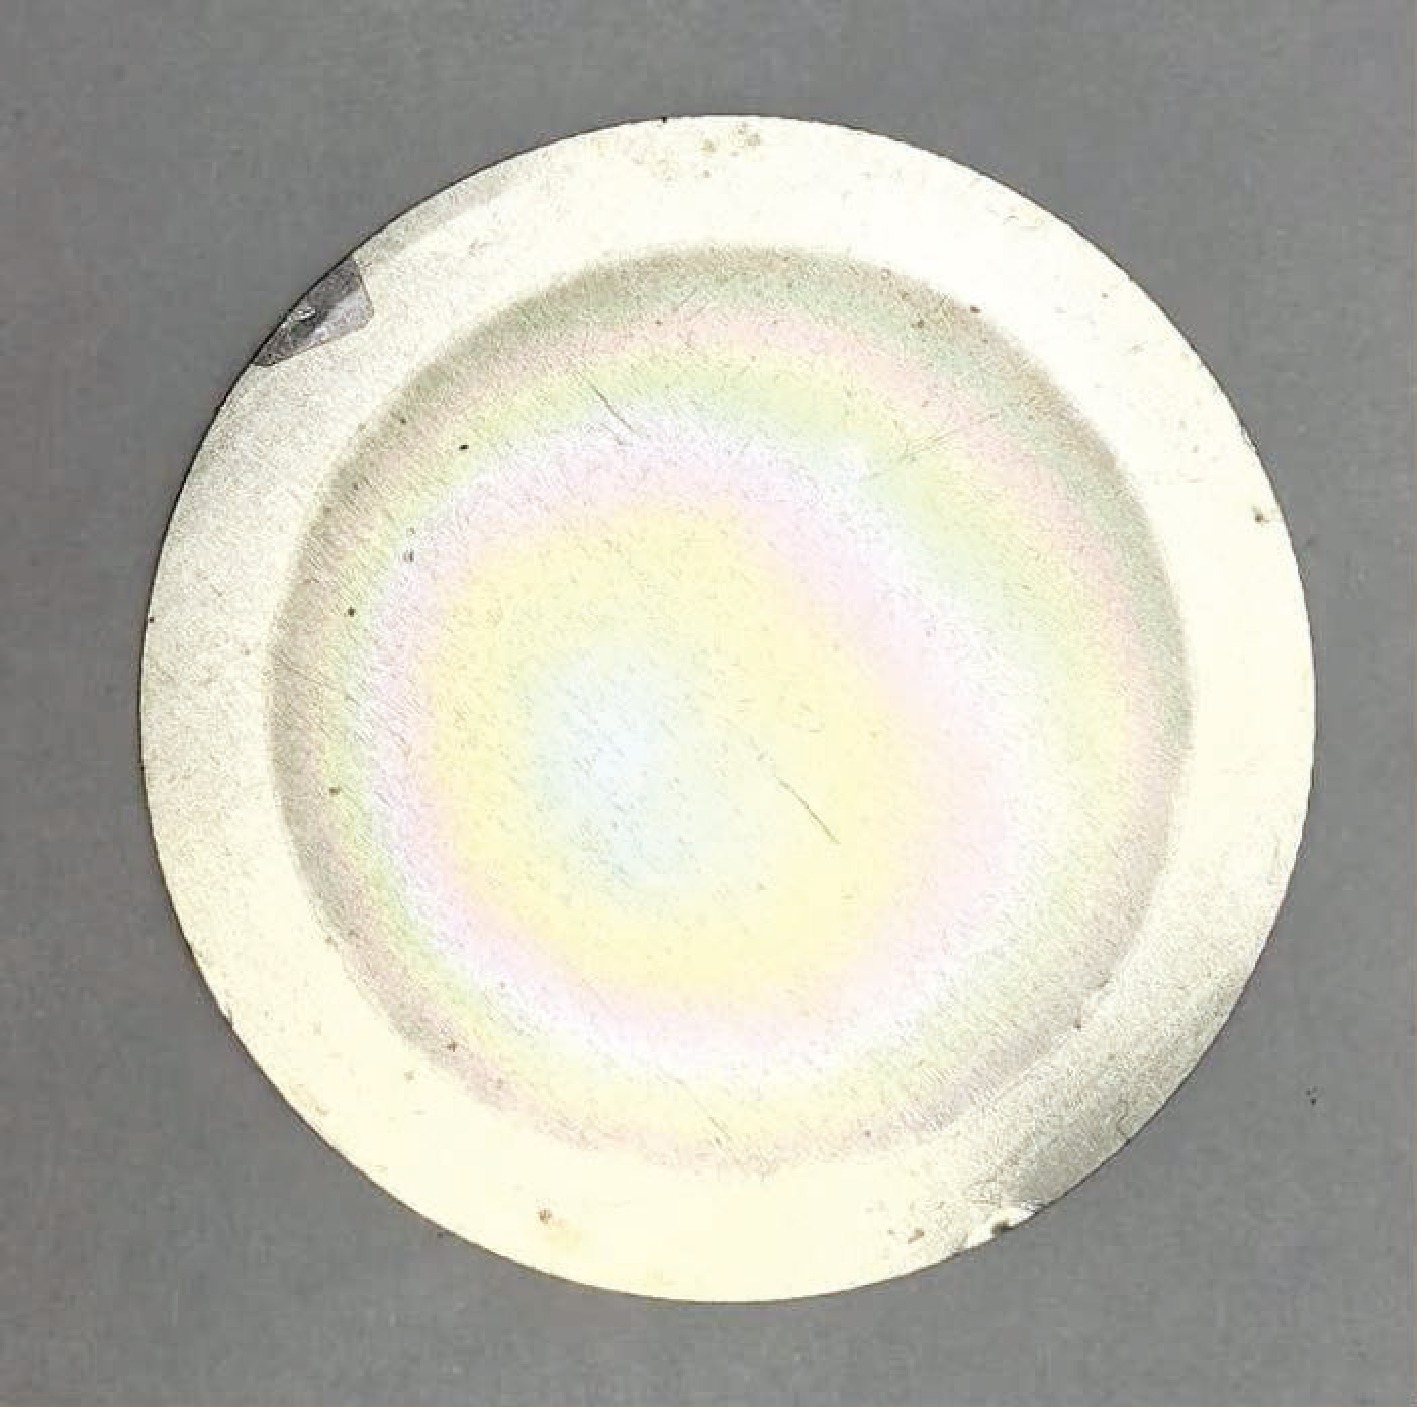
Figure 2. (color online) Picture of the 235U sample.
-
The 235U(n, f) reaction was measured between 0.5 eV and 10 keV based on the Back-n white neutron source at CSNS. The total measurement duration was ~100 h. The signals of the MTPC including the pad, cathode, and mesh signals were recorded for data analysis. The seven Si detectors of the Li-Si detector array kept running for the measurement of the neutron spectrum.
-
The cross section of the 235U(n, f) reaction at each neutron energy point,
$ {\text{σ}}_{\mathrm{U}} $ , was calculated by the following formula:$ \sigma_{\mathrm{U}}=\frac{C_{\mathrm{U}, \text { all }}}{N_{\mathrm{U}} \cdot \varPhi_{\mathrm{U}}}\text{,} $
(2) where
$ {C}_{\text{U,all}} $ is the total fission count of the 235U(n, f) reaction,$ {\varPhi}_{\text{U}} $ is the neutron flux through the 235U sample in the MTPC, and$ {\text{N}}_{\text{U}} $ is the number of the 235U nuclei in the sample. In the following sections, four steps to calculate the cross sections of the 235U(n, f) reaction are presented. -
The total fission count of the 235U(n, f) reaction,
$ {C}_{\text{U,all}} $ , was calculated using$ {C}_{\text{U,all}}\text=\frac{{C}_{\text{U}}}{{\text{ε}}_{\text{U}}}\text{,} $
(3) where
$ {C}_{\text{U}} $ is the net fission count of the 235U(n, f) reaction detected by the MTPC, and$ {\text{ε}}_{\text{U}} $ is the detection efficiency of the fission fragments. The calculation method of the detection efficiency of the MTPC has been detailed in Refs. [20, 21]. According to the simulation, the value of$ {\text{ε}}_{\text{U}} $ was 0.985 at En = 1.0 eV. In the 0.5 eV–10 keV neutron energy region, the energy of the incident neutron was significantly lower than the fission energy. As a result, the detection efficiency of the fission fragments was supposed to be the same in the 0.5 eV–10 keV neutron energy region.The details of the data analysis have been presented in Ref. [20]. Similar to previous fission cross section measurements using the MTPC in Refs. [20, 21], the two-dimensional spectrum of the track length vs total amplitude of all events was used for particle identification. In the data analysis process, the total data files were divided into two parts. Figure 3 shows the two-dimensional spectrum of the track length vs total amplitude of the events in the first half of data files. The fission fragments existed in three areas: A (total-amplitude 0~200 channel, track-length 0~40 mm), B (total-amplitude 200~1000 channel, track-length 0~80 mm), and C (total-amplitude > 1000 channel). The determination of the areas obeyed two principles: covering all fission events and improving the selection efficiency. The net fission count,
$ {C}_{\text{U}} $ , was calculated by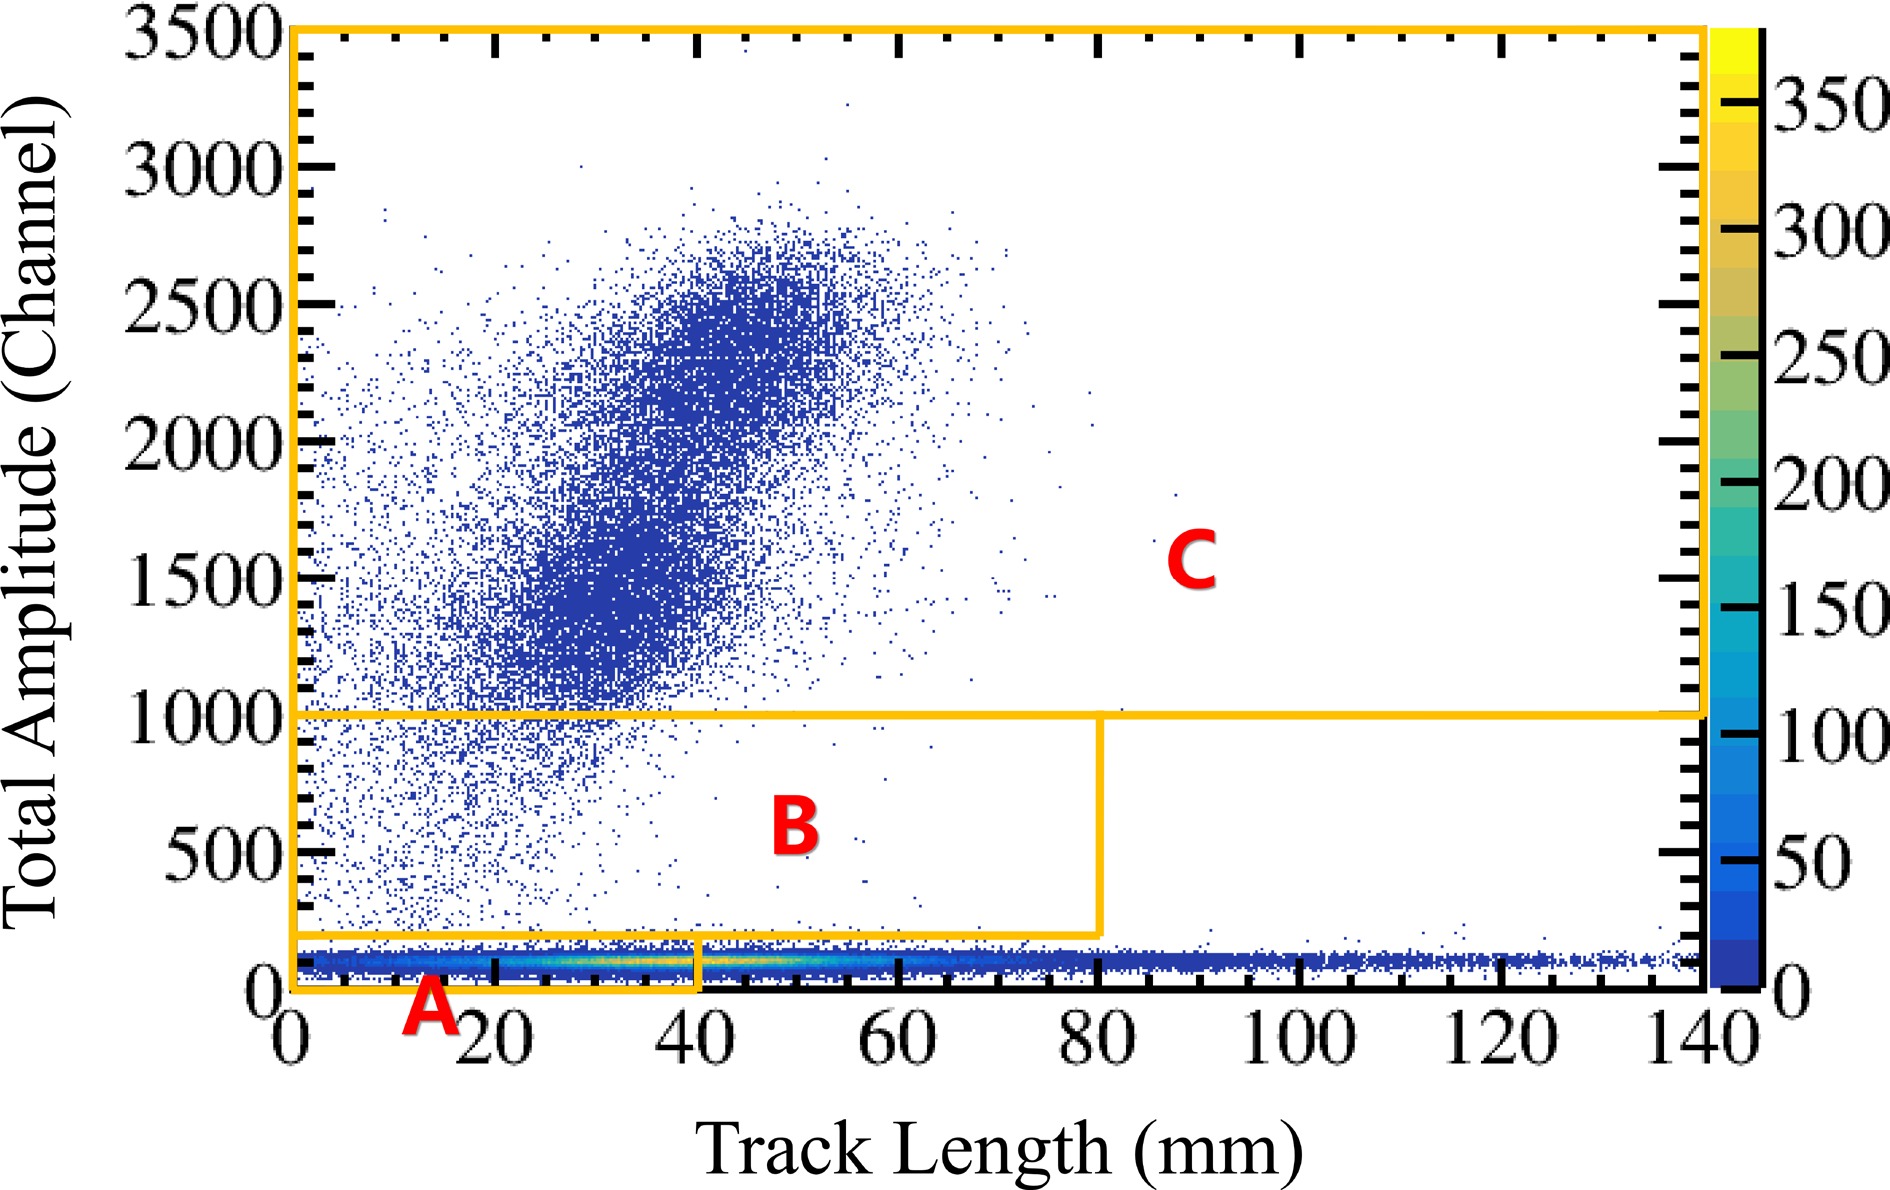
Figure 3. (color online) Two-dimensional event spectrum of the track length vs. total amplitude.
$ {{C}}_{\text{U}}=C_{\text{U}}^{\text{A}}+{C}_{\text{U}}^{\text{B}}+{C}_{\text{U}}^{\text{C}}\text{.} $
(4) For the first half of the data files, the differentiation between the low-energy fission fragments and the α particles (in areas A and B) was realized according to the figures of the 3D-Tracks [20, 21]. The parameter for particle identification was found in this process. For the second half of the data files, the differentiation between the low-energy fission fragments and the α particles was realized according to the founded parameter (presented in the following text) instead of the figures of the 3D-Tracks, which led to higher data analysis efficiency. The total fission counts were then determined. The portions of the total fission counts in areas A, B, and C were 0.14%, 6.28%, and 93.58%, respectively.
The one-by-one method of selecting the fission events by examining each 3D-Track figures has a major limitation in that it is time-consuming. In the present study, as part of an exploratory measurement of the fission cross section using the MTPC at the CSNS Back-n white neutron source, the total fission count was not too high due to the short measurement duration. The total fission count was less than 7.0 × 10⁴; therefore, the one-by-one selection method was barely feasible. However, the aim of the high accuracy fission cross section measurement using the MTPC is that the uncertainty should be smaller than 1%. As a result, significantly more counts should be involved in future measurements, and a new selection method based on track parameters should be developed.
The key point of the new method is to find the proper track parameter for the selection of the tracks between the fission fragments and the α particles. In the one-by-one event method, the 3D-Track figures of the fission fragments and the α particles were compared. The difference in the 3D-Track figures between the two types of events can be summarized as one parameter, and a new method based on track parameters was established, which was adopted in this study. Figures 4 and 5 show the 3D-Track figures of the low energy fission fragment and the α particle, respectively. For the low energy fission fragment, the hit points (blue points) were gathered in the Z direction. In contrast, for the α particles, the hit points were scattered in the Z direction because only the α particles emitted along the Z direction were detected due to the low detector gain and gas pressure. Therefore, only one track parameter was found. Firstly, for each event, the Z coordinate of the center of the ionization density,
$ {{Z}}_{\text{C}} $ , was determined by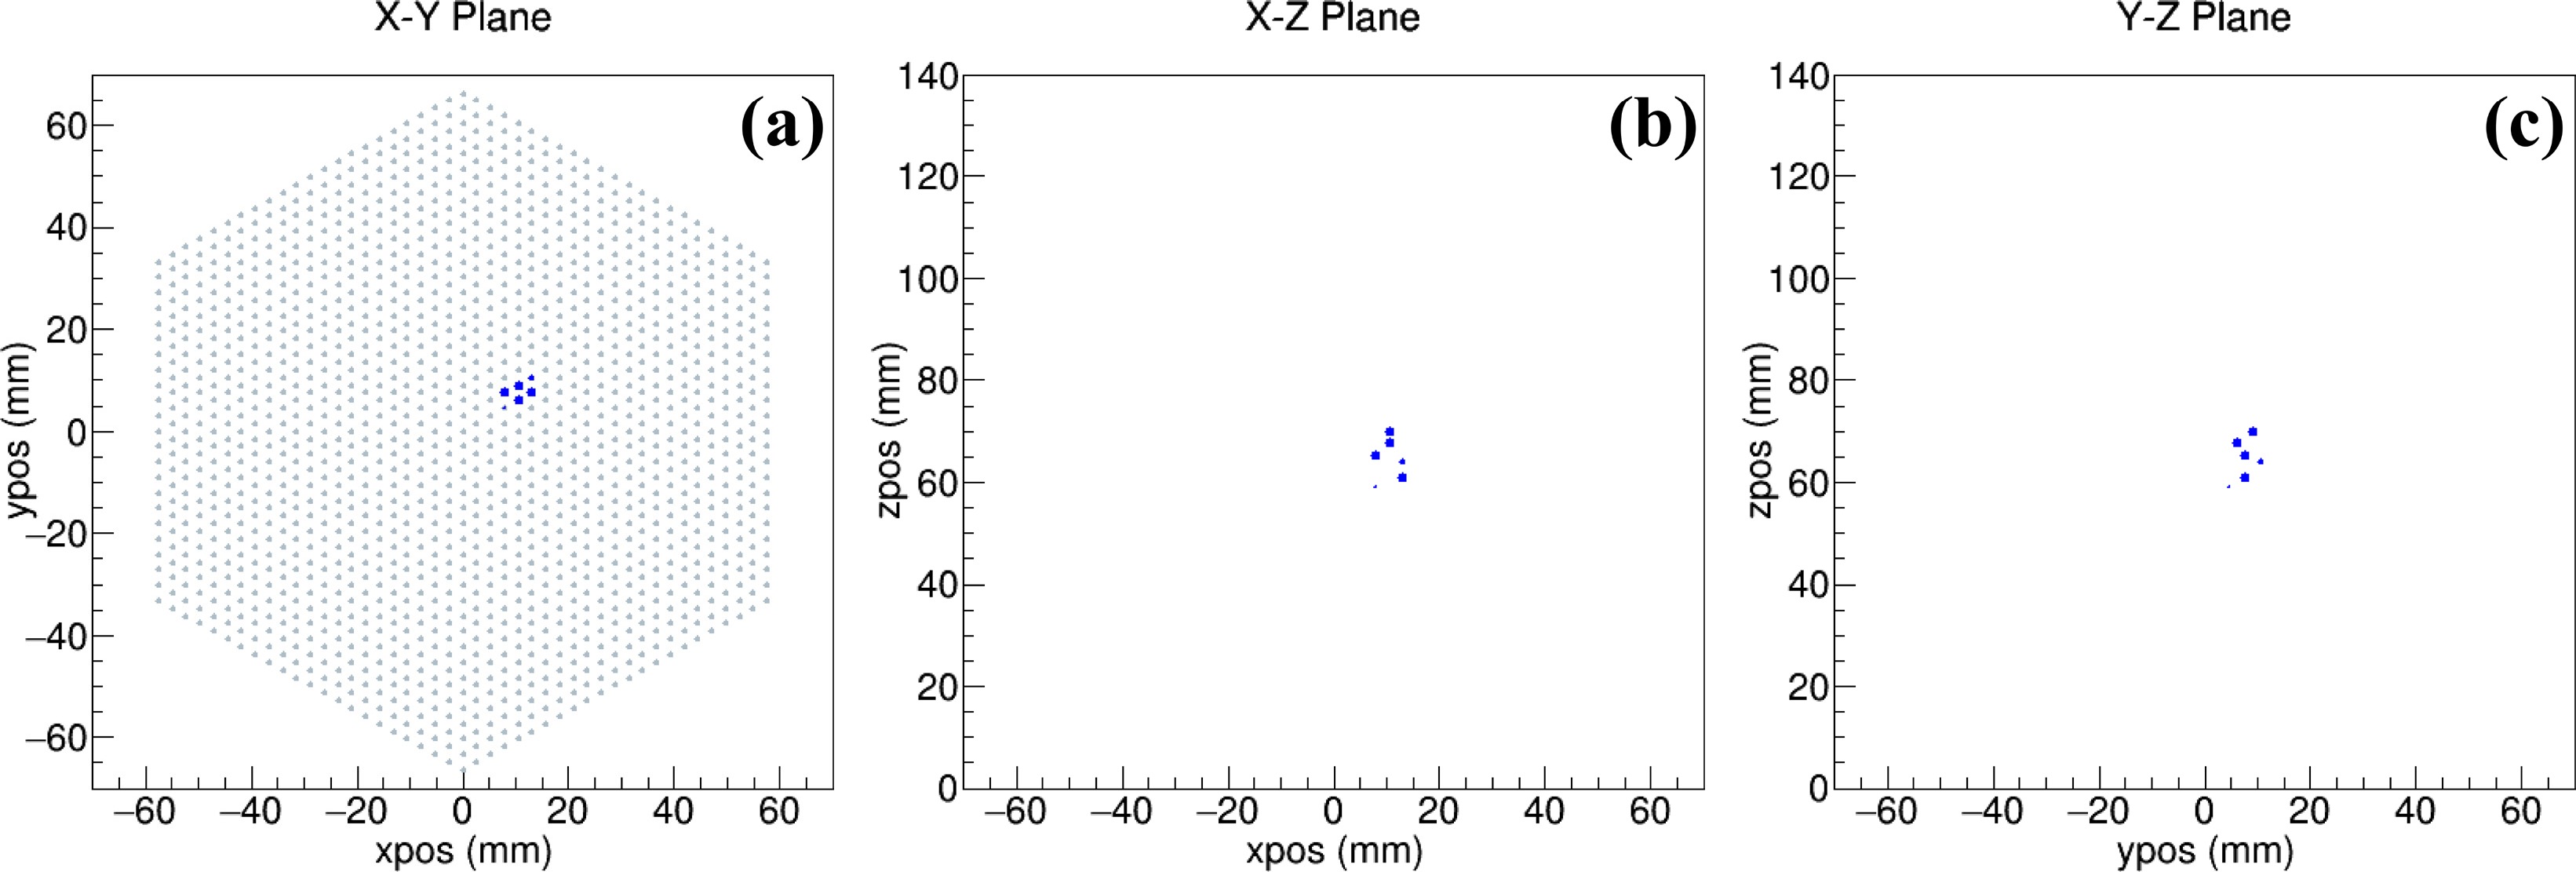
Figure 4. (color online) 3D-Track figures of the low-energy fission fragments in the (a) X-Y plane; (b) X-Z plane; and (c) Y-Z plane.
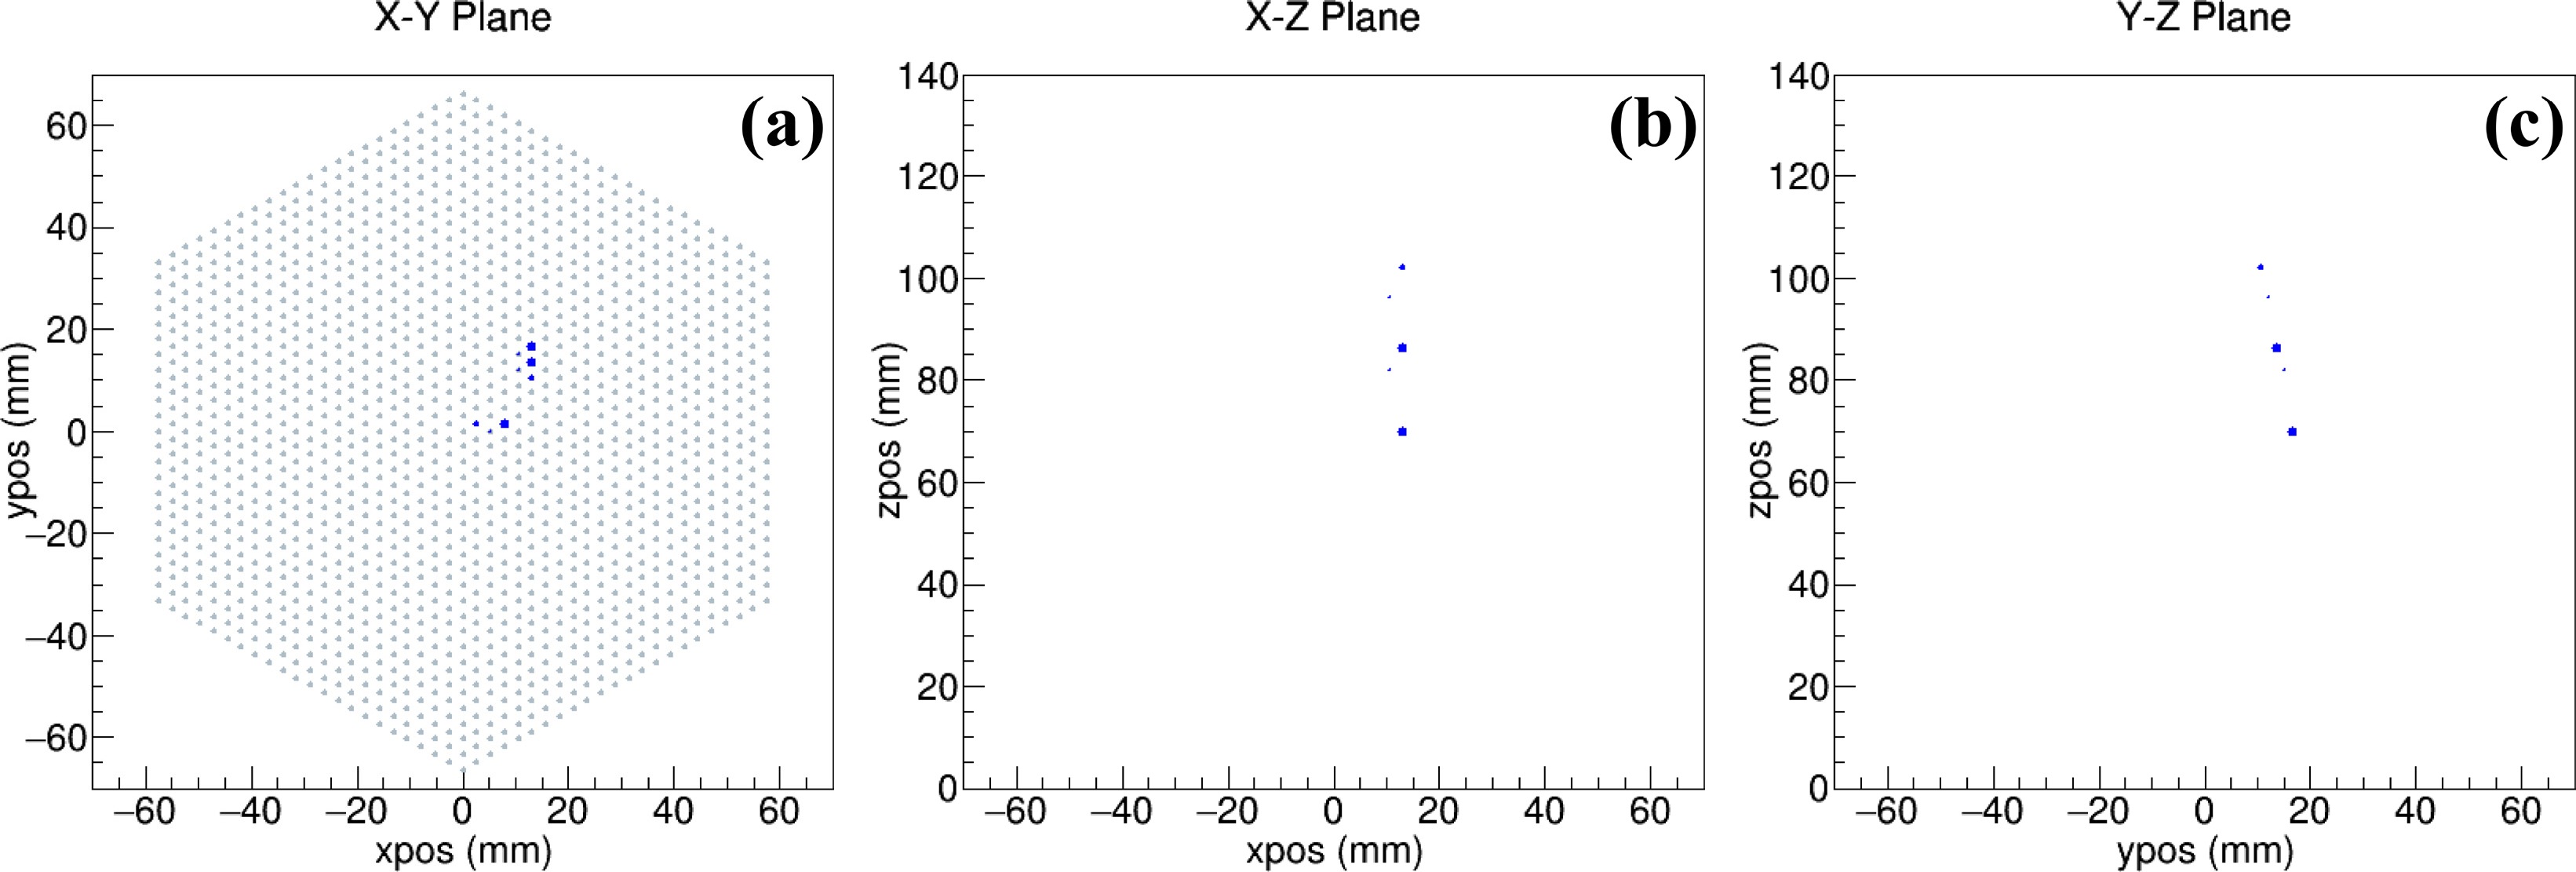
Figure 5. (color online) 3D-Track figures of the α particle in the (a) X-Y plane; (b) X-Z plane; and (c) Y-Z plane.
$ {{Z}}_{\text{C}}=\frac{\underset{i}{\sum }{{A}}_{{i}}\cdot {{Z}}_{{i}}}{\underset{i}{\sum }{{A}}_{{i}}}\text{,} $
(5) where
$ {{A}}_{\text{i}} $ is the signal amplitude of the hit point, and$ {{Z}}_{\text{i}} $ is the Z coordinate of the hit point. The signal amplitude of the hit point is proportional to the ionization density. Secondly, for each event, the standard deviation of the Z-direction distance between each hit point and the center of the ionization density,$ {{s}}_{\text{Z}} $ , was determined by$ {{s}}_{\text{Z}}=\sqrt{\frac{\underset{i}{\sum }{{A}}_{{i}}\cdot {\left({{Z}}_{{i}}-{{Z}}_{\text{C}}\right)}^{2}}{\underset{i}{\sum }{{A}}_{{i}}}}. $
(6) The track parameter,
$ {{s}}_{\text{Z}} $ , is the proper track parameter for the selection of the fission events.For the fission event selection in area B, as shown in Fig. 3, the two-dimensional spectrum of
$ {{s}}_{\text{Z}} $ vs. total amplitude was introduced, as shown in Fig. 6. Most events in area B were fission events; however, some α events still existed. Using the 3D-Track figures method, all α events in area B were selected. The$ {{s}}_{\text{Z}} $ of all α events was greater than 10.0 mm, and the total amplitude was less than 260 channels. Thus, the α event zone is marked out in Fig. 6, and the two types of events are well separated.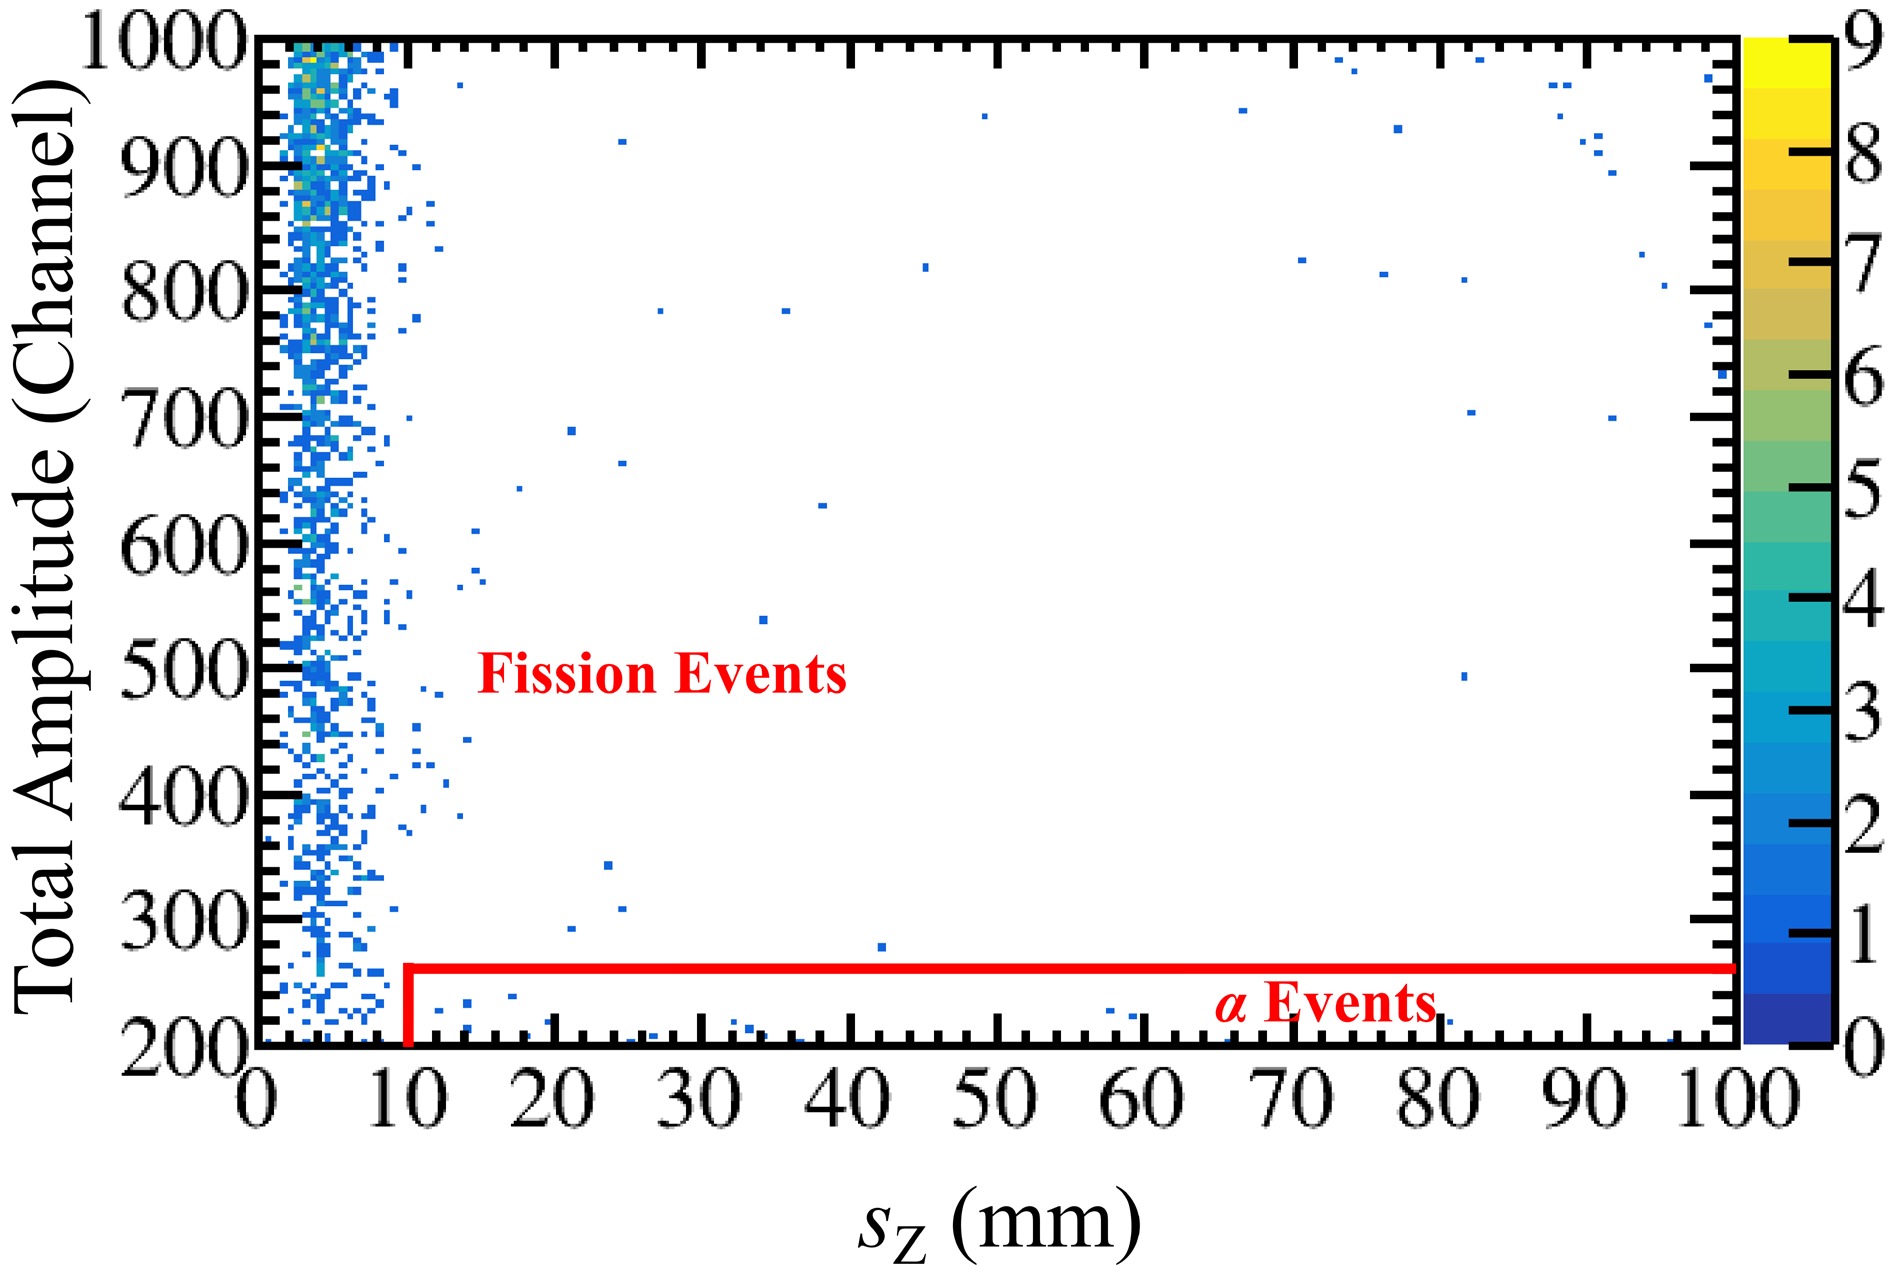
Figure 6. (color online) Two-dimensional spectrum of
$ {{s}}_{\text{Z}} $ vs. total amplitude of events in area B.For the fission event selection in area A, the situation is rather complicated, as the number of hit points, Nhit, should also be used as well as the two-dimensional spectrum of
$ {{s}}_{\text{Z}} $ vs. total amplitude. In contrast to area B, only a few events in area A were fission events. The minimum value of the number of hits was 5, as the event can be considered as the fission event [21]. Therefore, three conditions of Nhit were considered according to experience: Nhit = 5, Nhit = 6, and Nhit > 6. The fission event selection criteria of the three conditions were different. Figure 7 shows the two-dimensional spectrum of$ {{s}}_{\text{Z}} $ vs. total amplitude of the events in the three conditions. The type of each event in area A was already determined using the existing method based on the 3D-Track figures, and the total number of events was 39. When Nhit = 5, all events with$ {{s}}_{\text{Z}} $ < 4.0 mm were fission events, and the number of fission events was 10. When Nhit = 6, all events with$ {{s}}_{\text{Z}} $ < 6.0 mm were fission events, and the number of fission events was 9. When Nhit > 6, all events with$ {{s}}_{\text{Z}} $ < 9.0 mm were fission events, and the number of fission events was 8. Thus, based on the track parameter$ {{s}}_{\text{Z}} $ , 27 fission events were selected, constituting 70% of the total fission events in area A. Even though the selection accuracy based on the track parameter$ {{s}}_{\text{Z}} $ was not very high in area A, it barely affected the net fission count,$ {C}_{\text{U}} $ , as the proportion of the fission count in area A was only 0.14%. Thus, using the first half of the measured data files, the new fission event selection method based on the track parameter$ {{s}}_{\text{Z}} $ was established. According to this method, the fission count in the second half of the data files can be determined instead of checking the figures of the 3D-Tracks. Moreover, this new method can be adopted in future measurements, which should significantly improve the efficiency of data processing.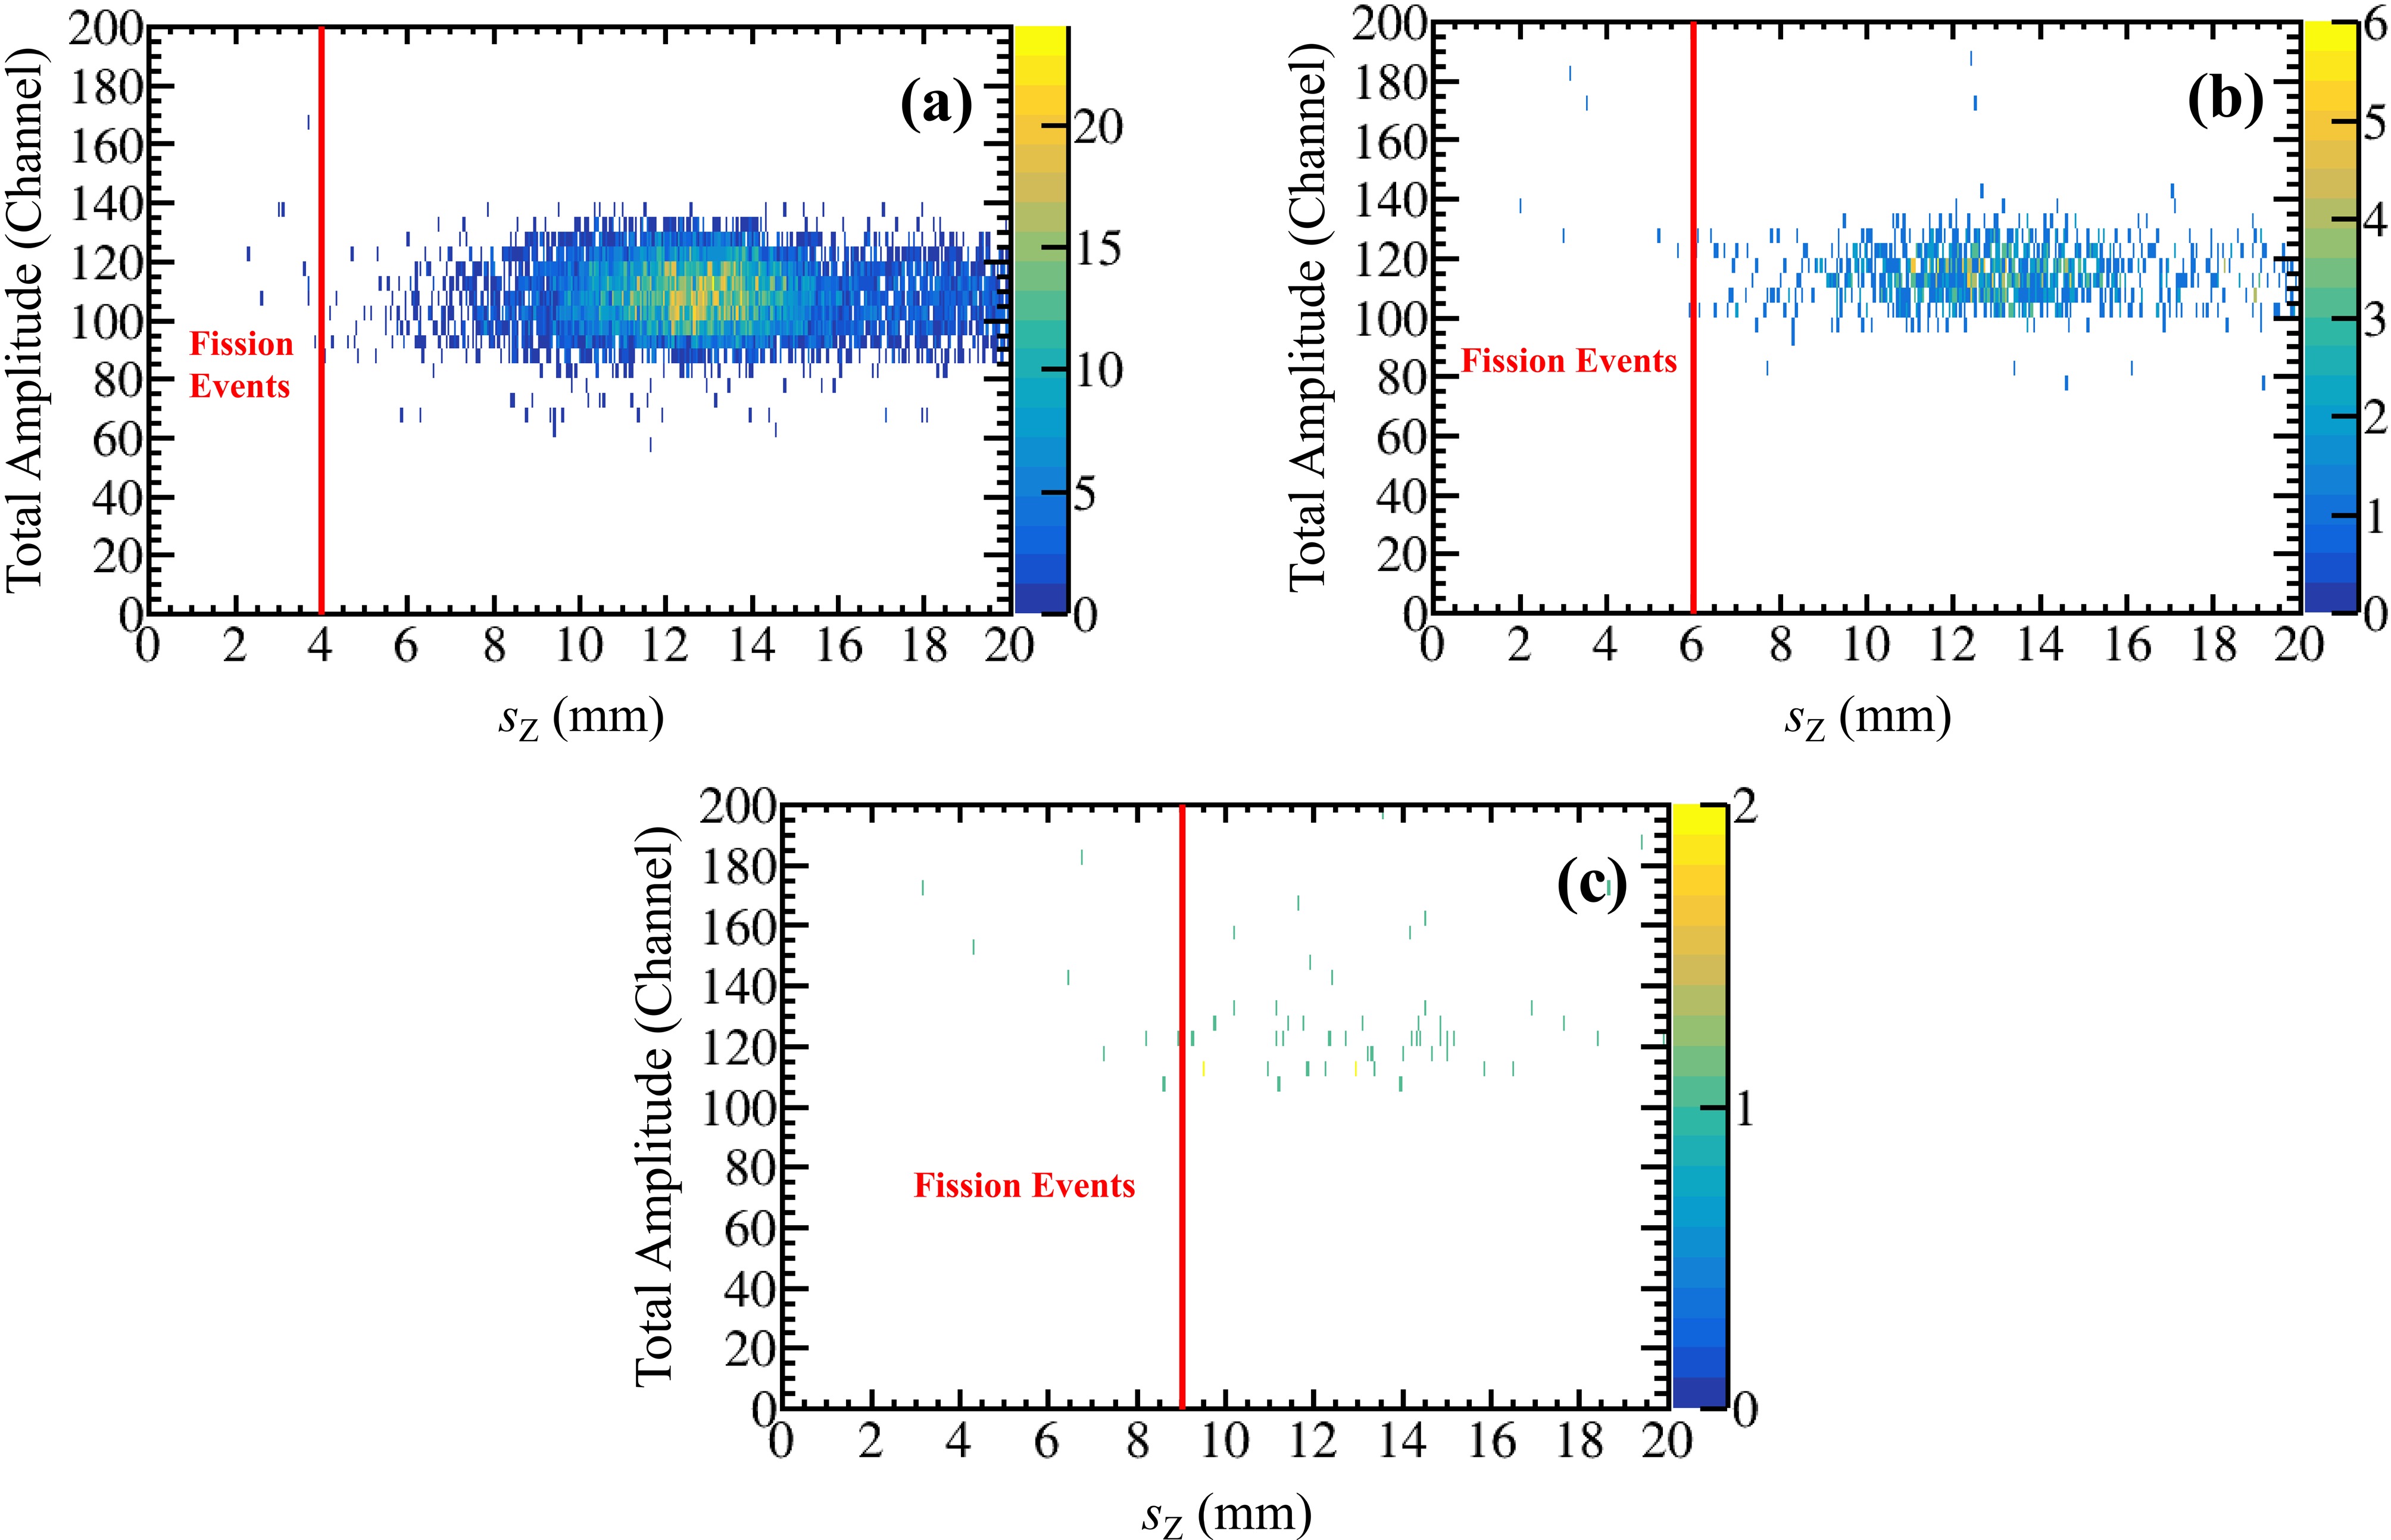
Figure 7. (color online) Two-dimensional spectrum of
$ {{s}}_{\text{Z}} $ vs. total amplitude of events in area A in different conditions. (a) Nhit = 5; (b) Nhit = 6; (c) Nhit > 6. -
After the selection of all fission events, the energy of the induced neutron for each fission event was determined. The TOF method was adopted, and the crucial information was the time of the fission event. The determination of the time of the fission event was based on the pad signals, as the cathode signals were not available for En > 1.0 keV because of the 40 μs dead time. When using the pad signals, the key was to find the pad representing the vertex of the track of the fission fragment. The 235U sample was mounted on the cathode of the TPC, meaning that the Z coordinate of the vertex of the track of the fission fragment was fixed and the length of the neutron flight path was constant. The pad representing the vertex had the latest signal in principle, for the electron drift distance was the longest with the largest Z coordinate of the hit point. According to this principle, the vertex was found, and the time of the fission reaction, T1, was determined. Figure 8 shows the results of finding the vertex of the track of one fission fragment.
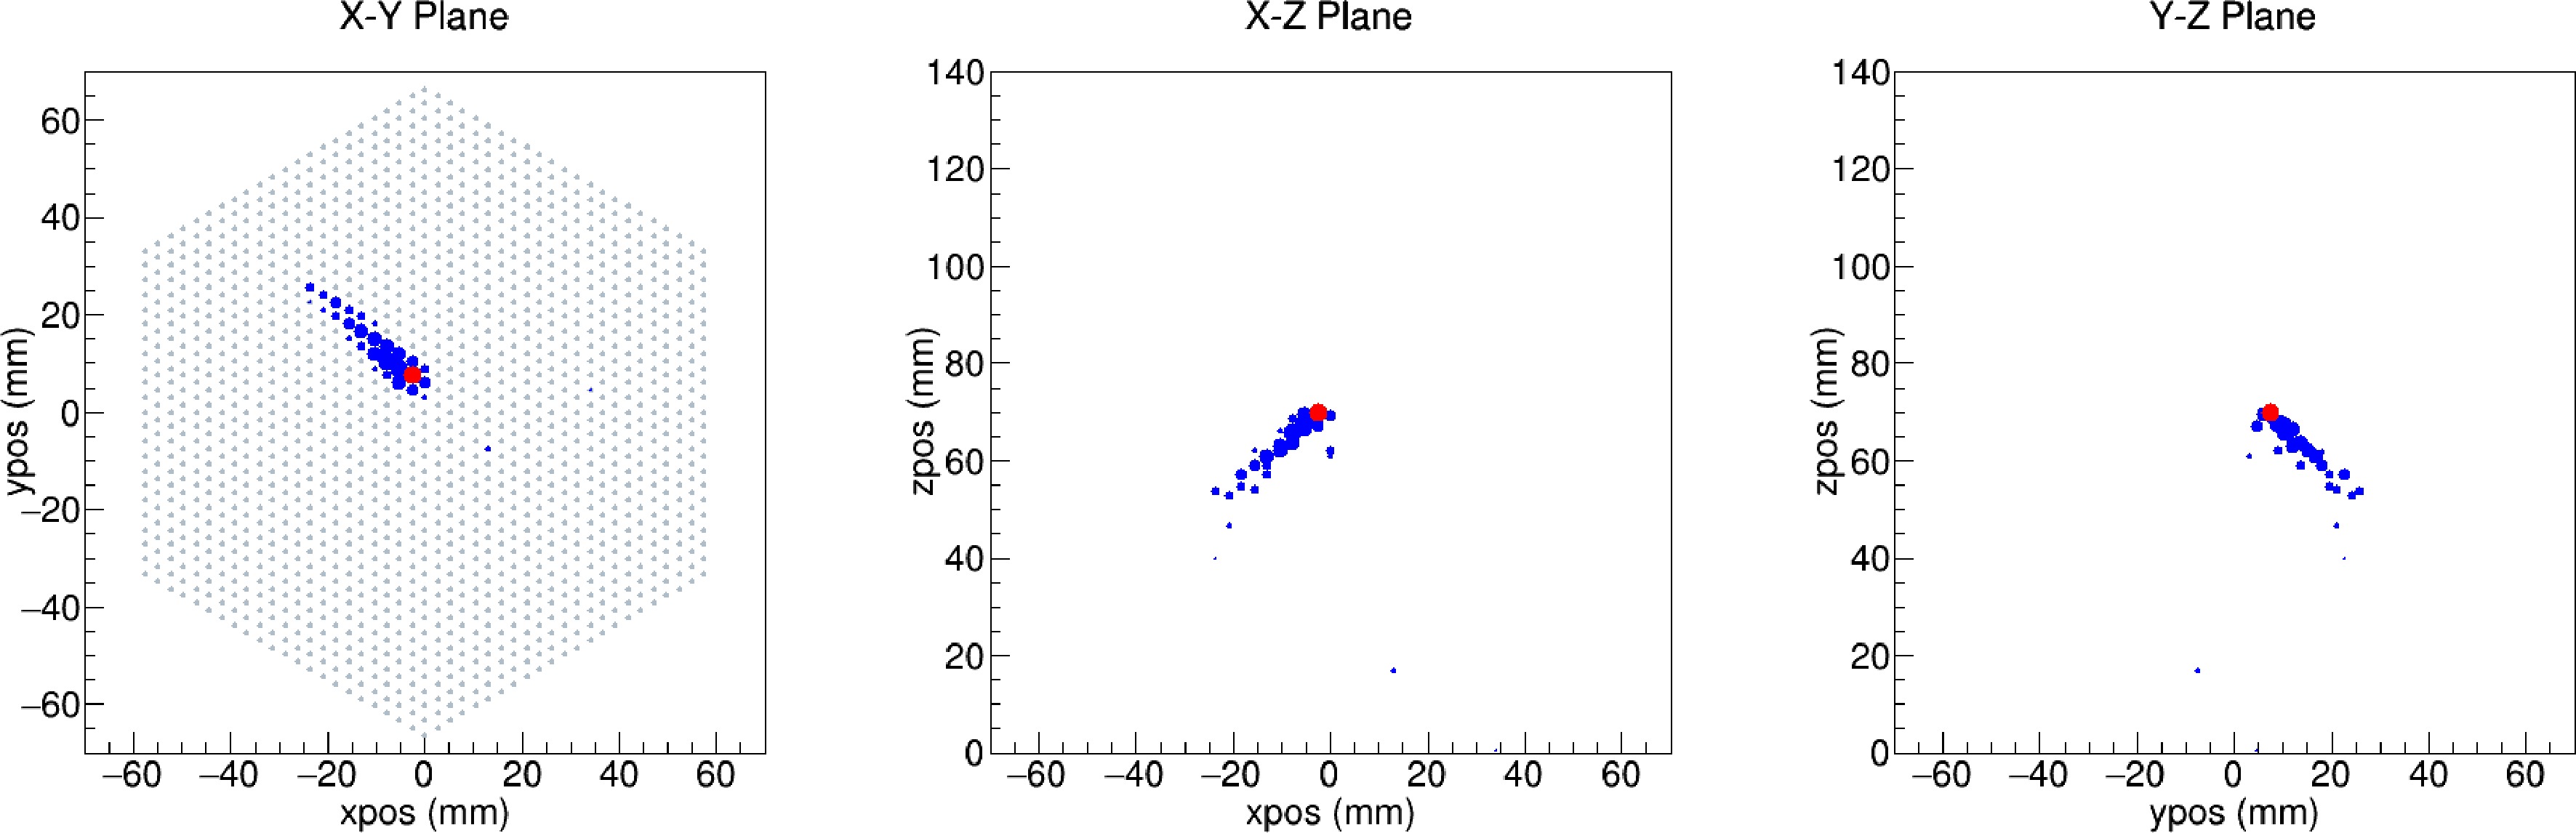
Figure 8. (color online) Results of finding the vertex of the track of one fission fragment. The red point represents the vertex that was found.
Using the time when the proton bunch hit the tungsten target, T0, and the time when the fission event occurred, T1, the TOF of the neutron,
$ \Delta {T} $ , was determined. Thus, the energy of the incident neutron was calculated. Figures 9 (a) and (b) show the energy spectra of the incident neutrons that induced the 235U(n, f) reactions divided into 10 and 50 bins with equal logarithm intervals for each neutron energy magnitude, respectively.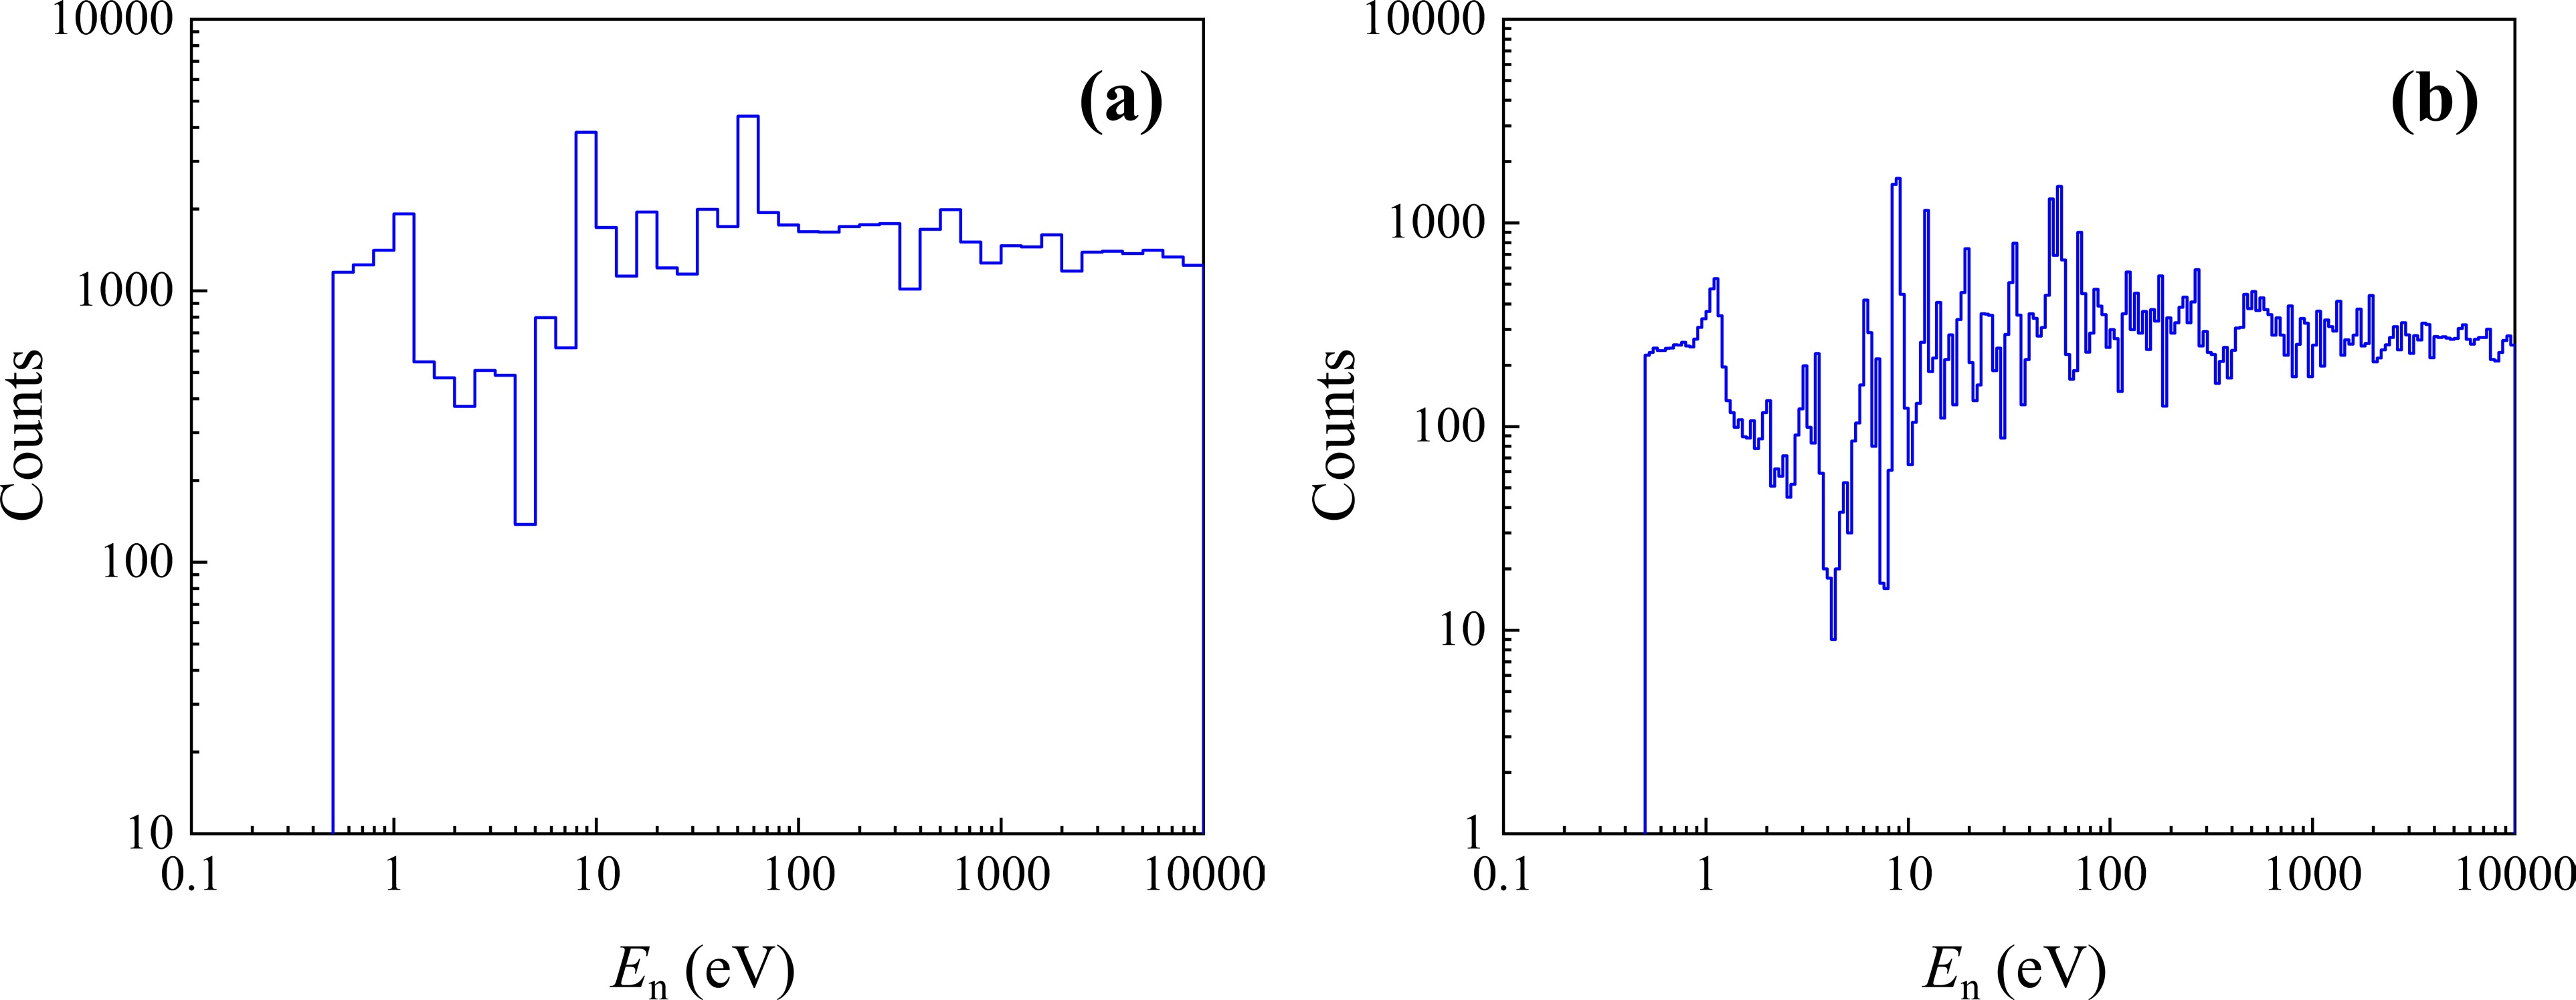
Figure 9. (color online) Energy spectra of the incident neutrons of the 235U(n, f) reaction. (a) 10 bins are divided with equal logarithm intervals; (b) 50 bins are divided with equal logarithm intervals.
-
The Si detectors of the Li-Si detector array measured the α particles and tritons from the 6Li(n, α)4He reaction. The α and triton counts in each neutron energy bin indicated the neutron flux in each bin. Figure 10 shows the two-dimensional spectrum of En vs. amplitude of the events measured by one Si detector. Compared with the α particles, the tritons from the 6Li(n, α)4He reaction had higher kinetic energies. The triton event zone was clearer than the α event zone. As a result, the subthreshold correction of the triton count was smaller than that of the α count, resulting in a more accurate count of the 6Li(n, α)4He reaction. Therefore, the triton count was used in the determination of the neutron flux.
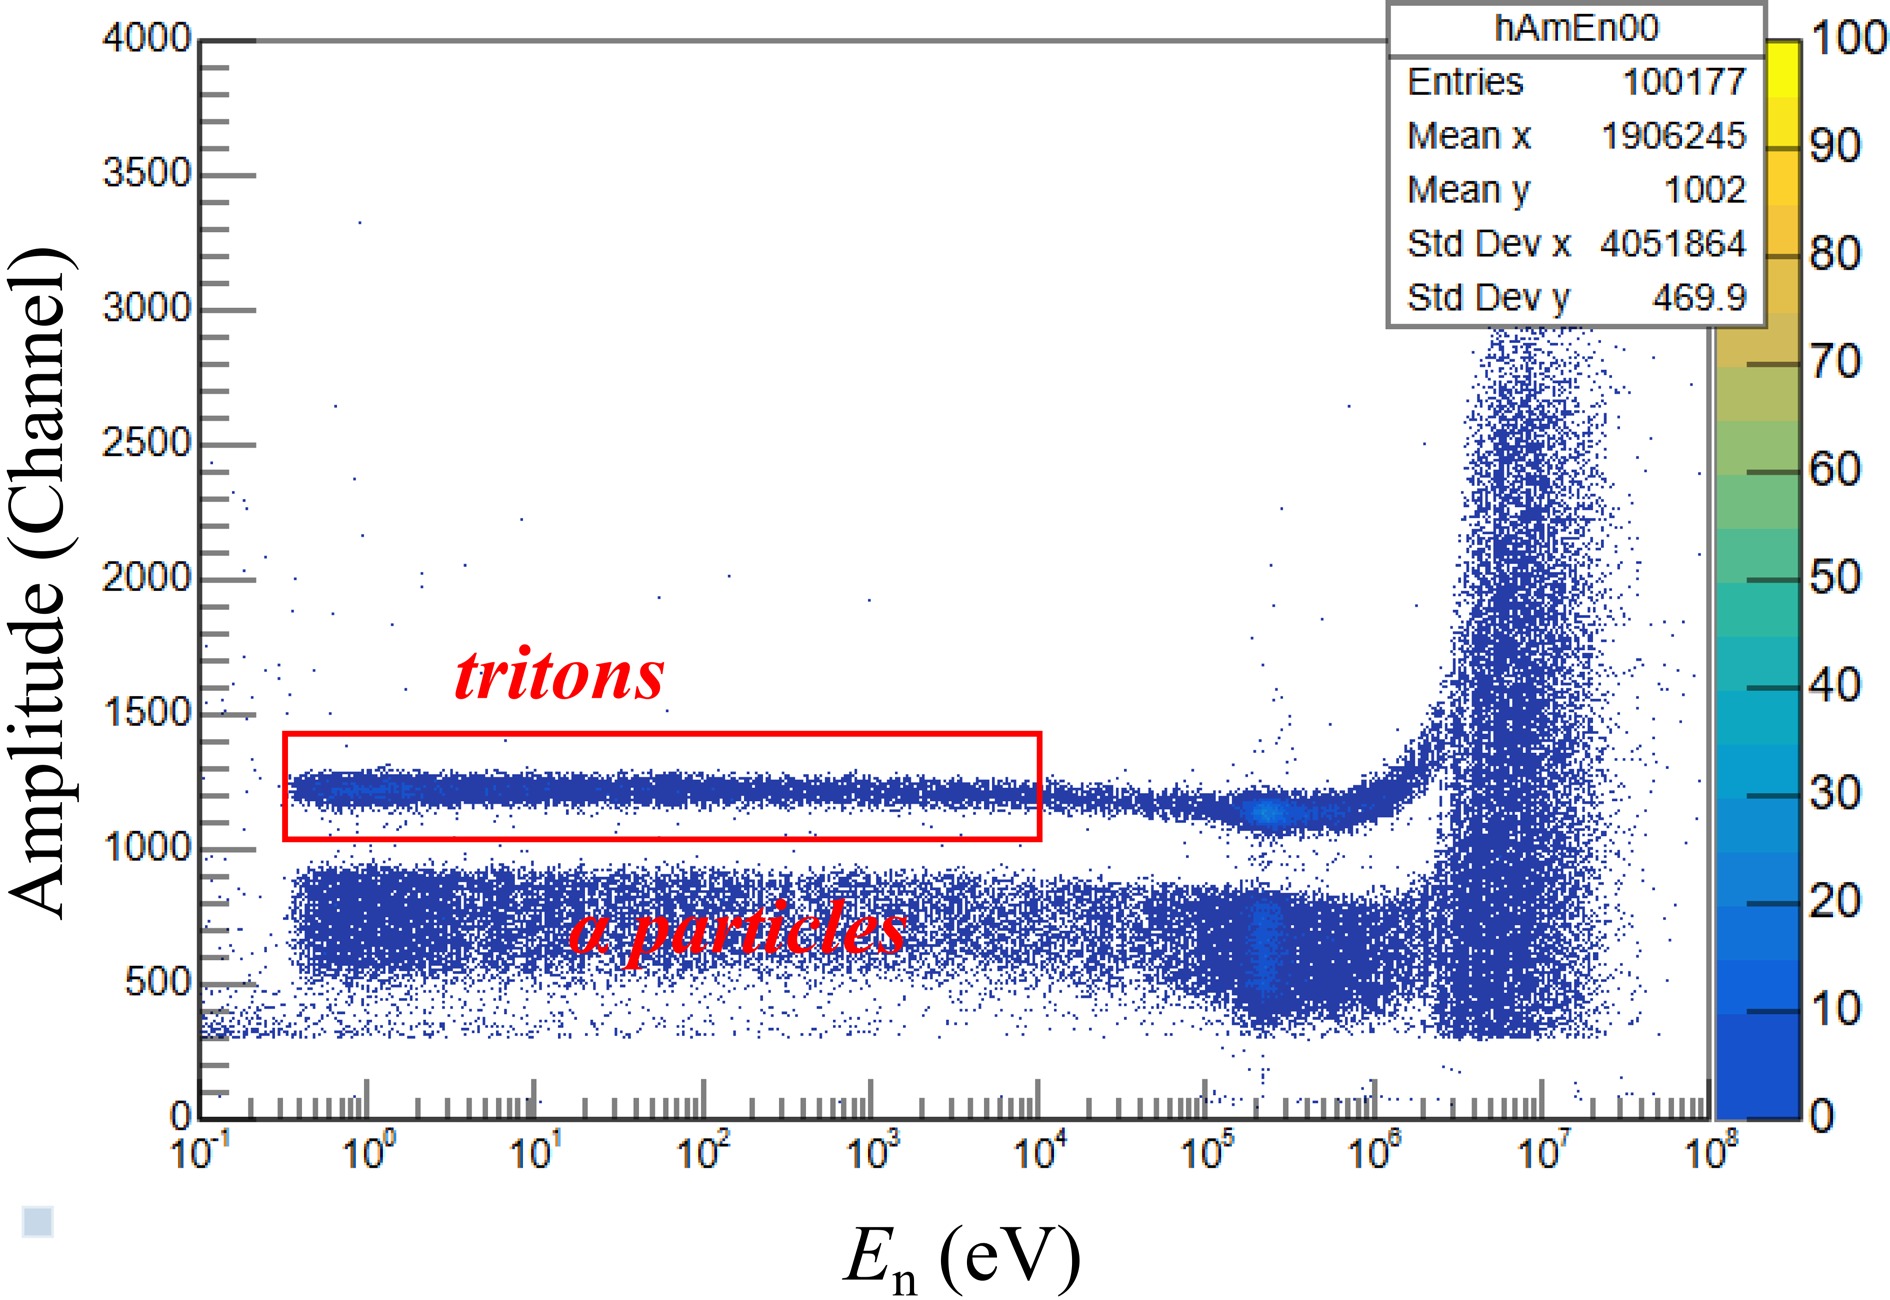
Figure 10. (color online) Two-dimensional spectrum of the En vs amplitude of the events measured by one Si detector.
In each neutron energy bin, the total count t measured by all Si detectors,
$ {\text{C}}_{\text{Li}} $ , was determined by$ {{C}}_{\text{Li}}={\varPhi }_{\text{Li}}\cdot {{N}}_{\text{Li}}\cdot \frac{\partial \sigma }{\partial {\Omega }}\cdot \Delta \mathit{\Omega }. $
(7) where
$ {N}_{\text{Li}} $ is the number of 6Li nuclei in the LiF sample;$ {\varPhi}_{\text{Li}} $ is the neutron flux;$ \dfrac{\partial \sigma }{\partial \mathit{\Omega }} $ is the angular differential cross section of the 6Li(n, α)4He reaction near θ = 135°, which was determined according to the differential cross sections measured by us [29]; and$ \Delta \mathit{\Omega } $ is the solid angle covered by the Si detectors. Thus, the neutron flux in each neutron energy bin was determined by the count of the 6Li(n, α)4He reaction. -
The neutron fluxes through the 235U sample in the MTPC and the 6LiF sample in the Li-Si detector array were not identical because of the different measurement durations and positions. Thus, the neutron fluxes through the 235U sample,
$ {\varPhi}_{\text{U}} $ , and the the 6LiF sample,$ {\varPhi}_{\text{Li}} $ , were related by$ {\varPhi}_{\text{U}}=\frac{{\varPhi}_{\text{Li}}}{{G}}\text{,} $
(8) where G is the ratio of the neutron flux through the 6LiF sample to that through the 235U sample. According to Eqs. (2), (3), (7), and (8), the cross section of the 235U(n, f) reaction in each neutron energy bin,
$ {\text{σ}}_{\mathrm{U}} $ , was calculated by$ \sigma_{\mathrm{U}}=\frac{\partial \sigma}{\partial \mathit{\Omega }} \cdot \frac{C_{\mathrm{U}}}{C_{\mathrm{Li}}} \cdot \frac{N_{\mathrm{Li}} G \Delta \mathit{\Omega }}{N_{\mathrm{U}} \varepsilon_{\mathrm{U}}}=\frac{\partial \sigma}{\partial \mathit{\Omega }} \cdot \frac{C_{\mathrm{U}}}{C_{\mathrm{Li}}} \cdot \frac{1}{\rho}\text{,} $
(9) where
$ \dfrac{\partial \sigma }{\partial \mathit{\Omega }} $ is the angular differential cross section of the 6Li(n, α)4He reaction near θ = 135°,$ {C}_{\text{U}} $ is the fission count of 235U measured by the MTPC, and$ {C}_{\text{Li}} $ is the count of the 6Li(n, α)4He reaction measured by the Li-Si detector array. All quantities that did not change with neutron energy were combined as a single parameter,$ \rho $ . The parameter$ \rho $ was determined by the normalization of the evaluation cross section data of the 235U(n, f) reaction from ENDF/B-VIII.1 in the 0.5~1.0 eV neutron energy region . -
The cross sections of the 235U(n, f) reaction from 0.5 eV to 10 keV were calculated according to Eq. (9). The results of the cross sections where 10 bins are distributed in equal logarithm intervals for each neutron energy magnitude are presented in Fig. 11 and Table A1 (total of 43 energies). The results of the cross sections where 50 bins are distributed in equal logarithm intervals for each neutron energy magnitude are presented in Fig. 12 and Table B1 (total of 215 energies). The results of this study are compared with the data from five evaluation data libraries in Figs. 11 and 12. The ratio between the measurement results in this study and the evaluation data in the ENDF/B-VIII.0 library from 0.5 eV to 100 eV is presented in Fig. 13. In the neutron energy range from 0.5 eV to 10 keV, the relative differences between the data in different evaluation libraries are smaller than 4%. According to Fig. 12 (a), the results of this study are consistent with the data from the evaluations, particularly for the resonance peak areas, which confirms the capacity of the MTPC for fission cross section measurement based on the white neutron source. The results of this study are the first cross sections measured by the MTPC based on the CSNS Back-n white neutron source.
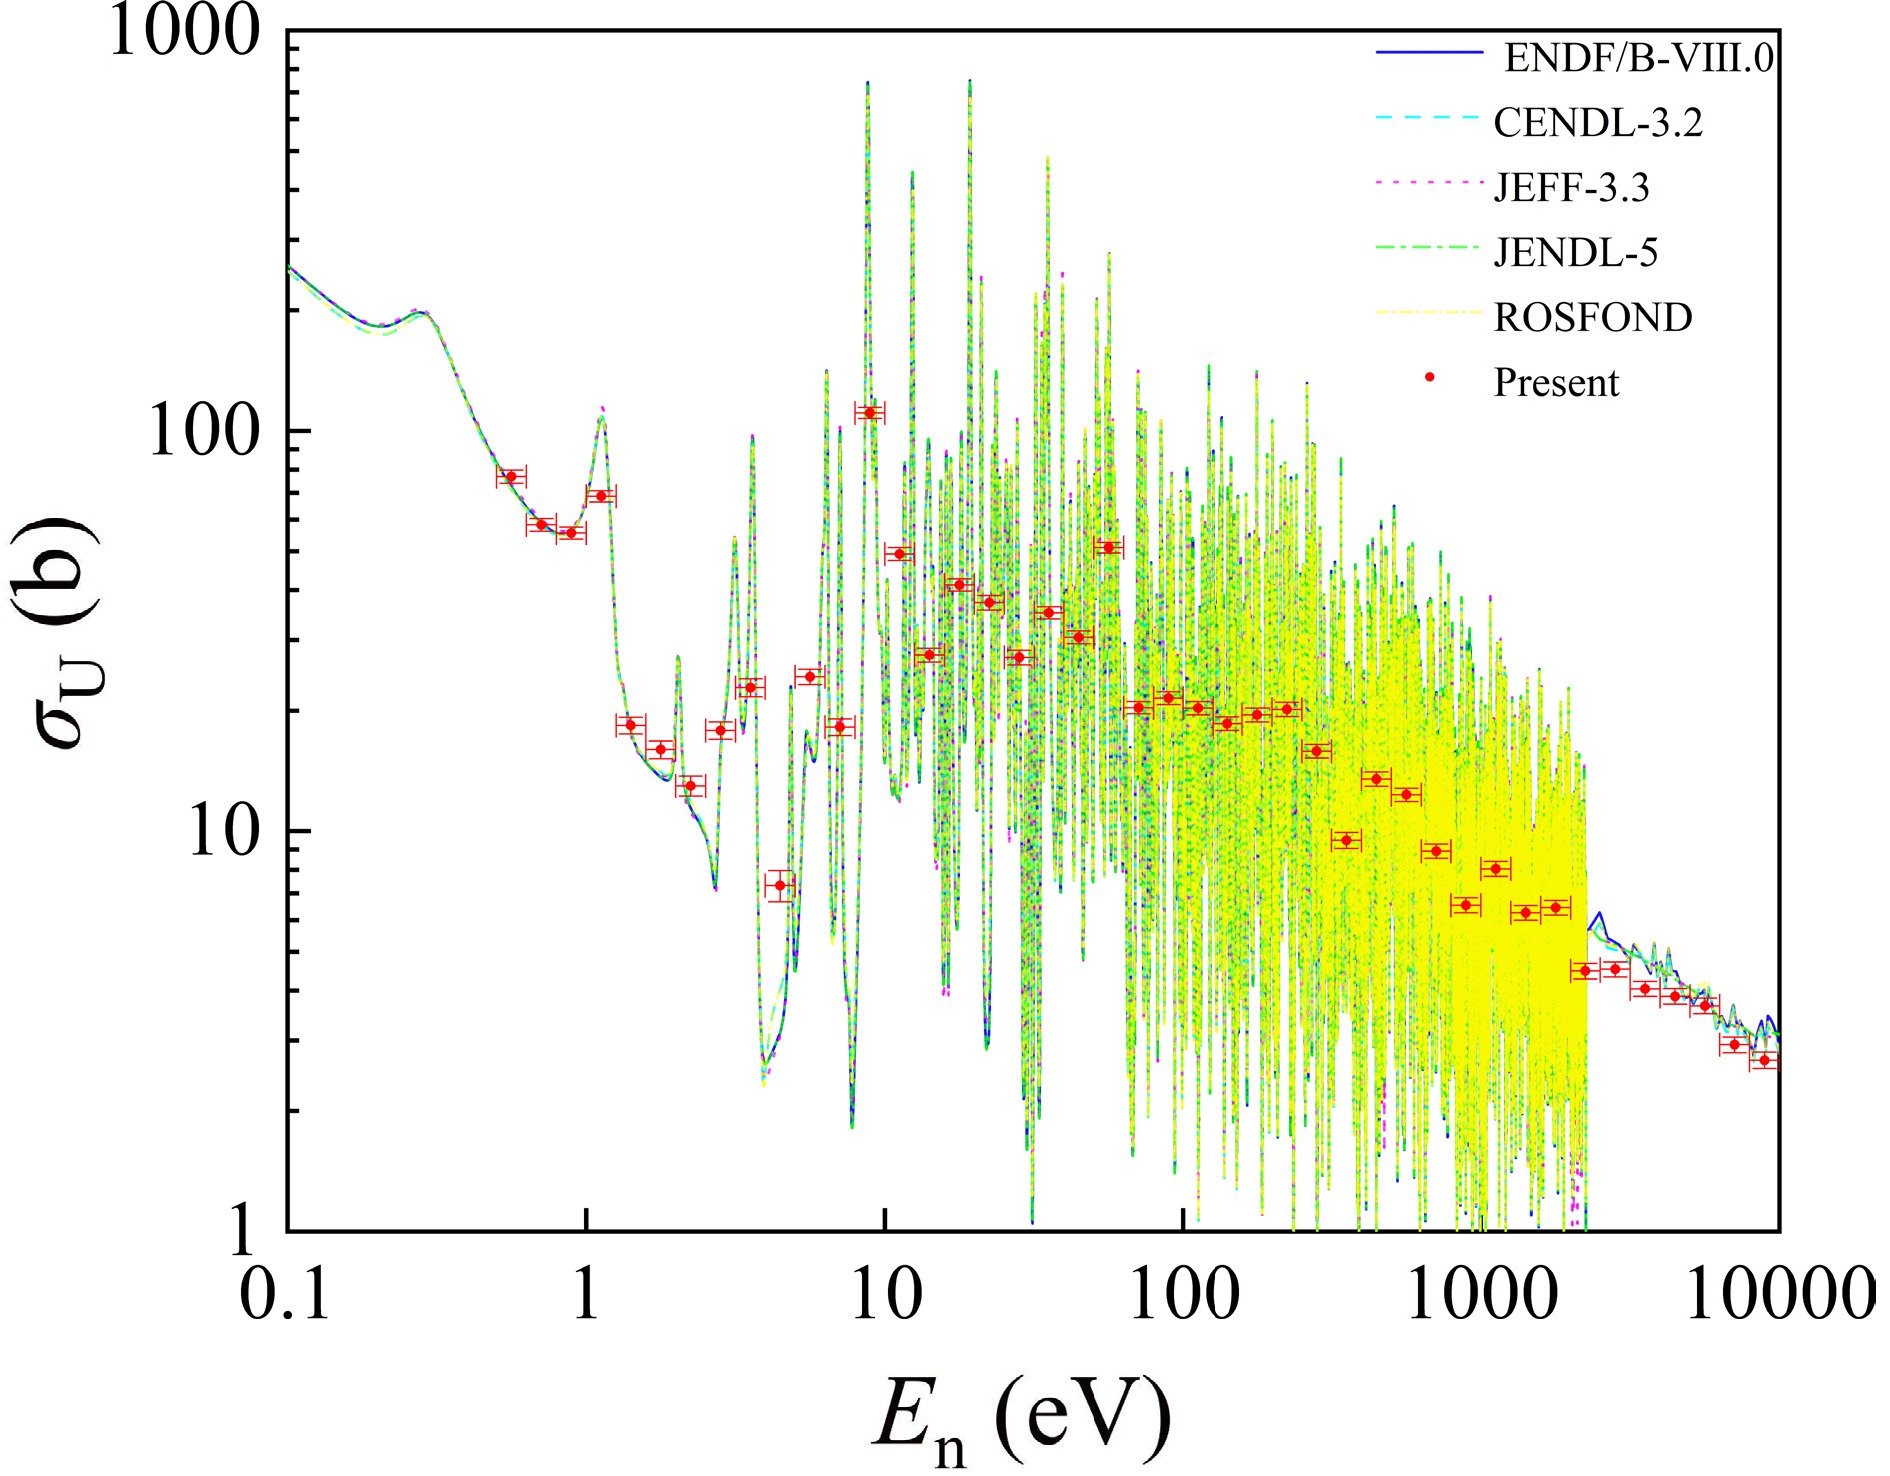
Figure 11. (color online) Measured 235U(n, f) cross sections at 43 energies from 0.5 eV to 10 keV compared with the data from five evaluation libraries.
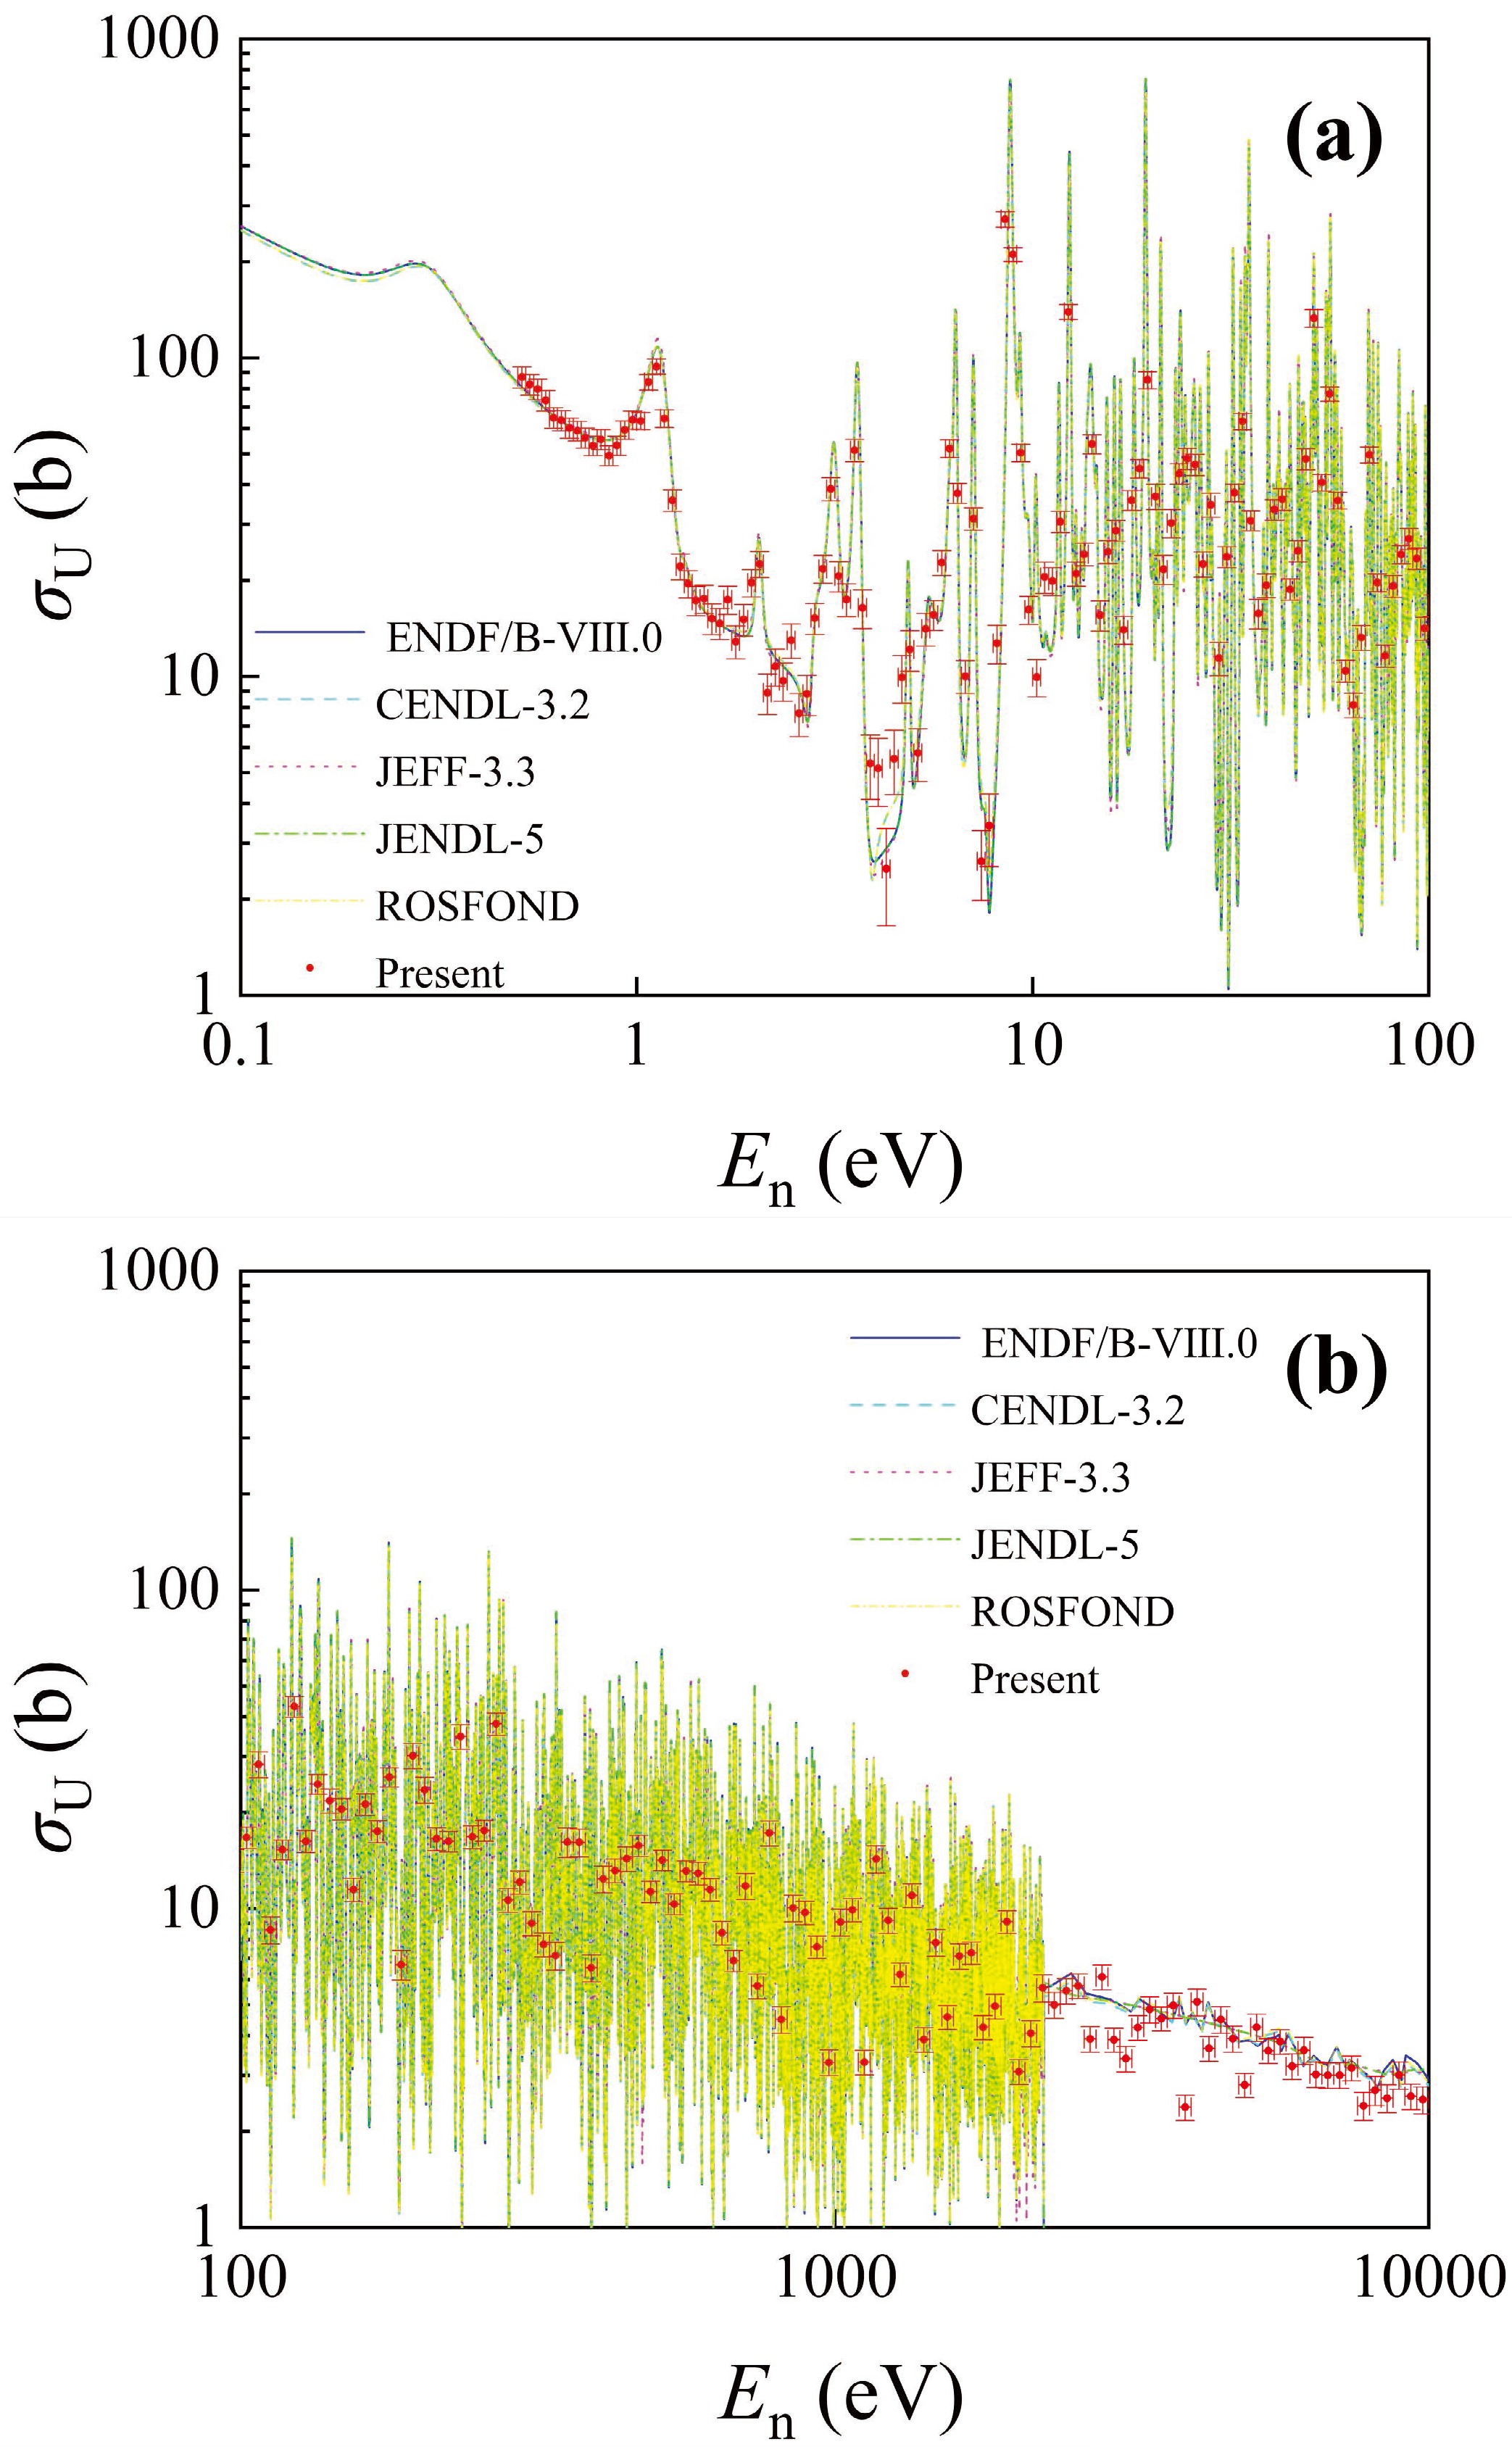
Figure 12. (color online) Measured 235U(n, f) cross sections at 215 energies compared with the data from five evaluation libraries. (a) From 0.5 to 100 eV. (b) From 100 eV to 10 keV.
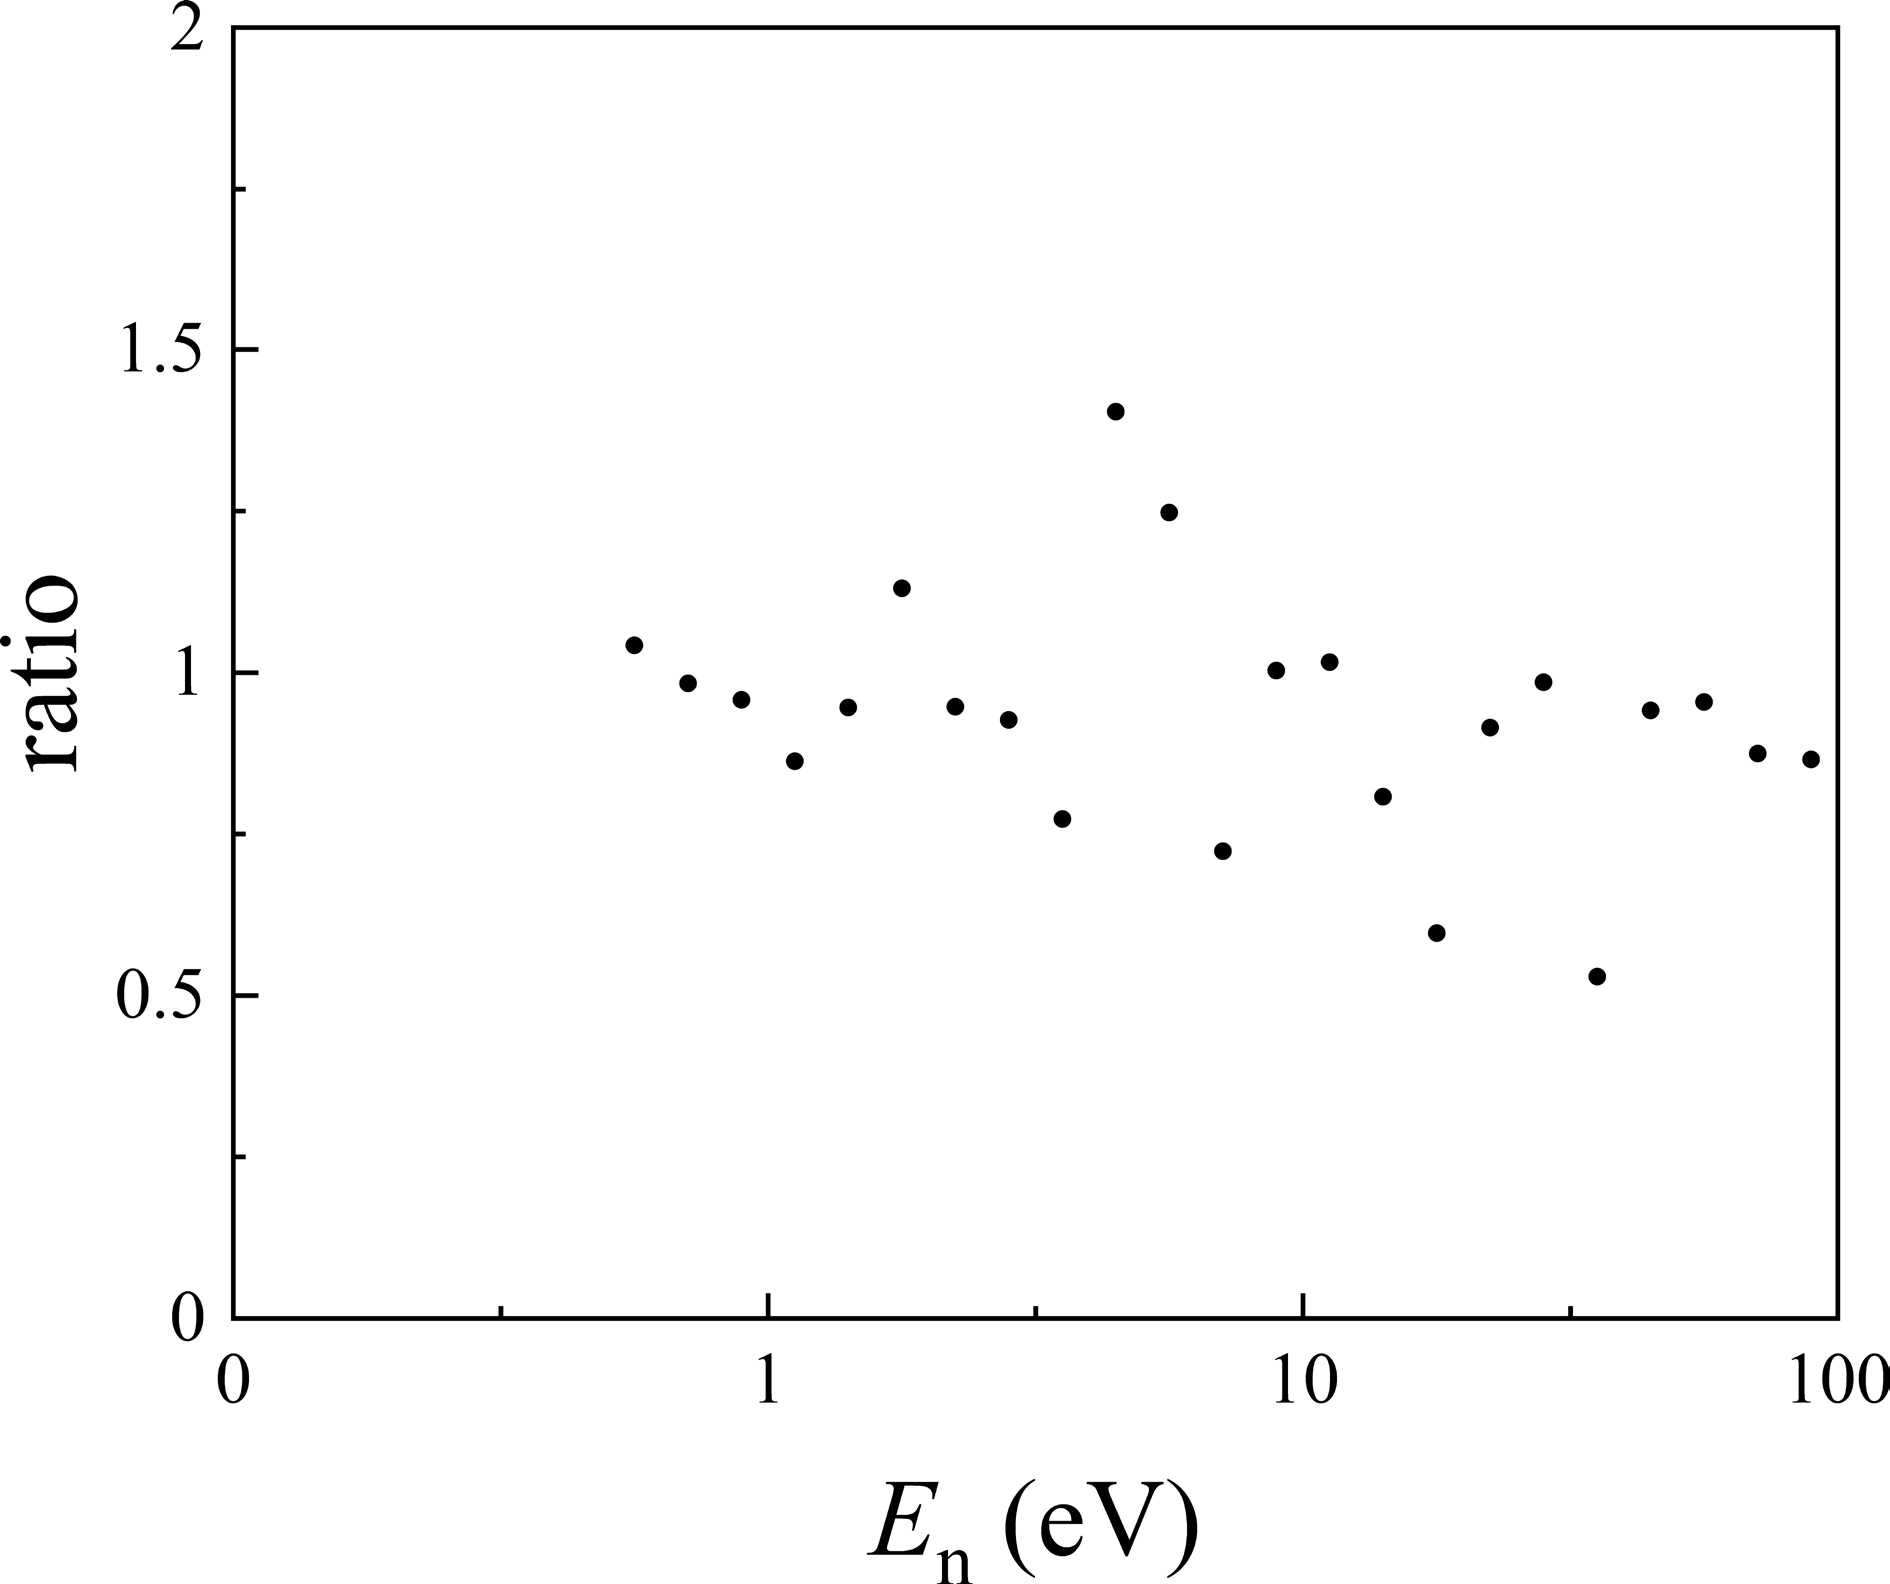
Figure 13. Ratio between the present measurement results and the evaluation data in the ENDF/B-VIII.0 library from 0.5 to 100 eV.
Tables 1 and 2 list the sources and magnitudes of the uncertainties of the measured 235U(n, f) cross sections from 0.5 eV to 10 keV at 43 and 215 energies, respectively. The parameters in Tables 1 and 2 are consistent with the quantities in Eq. (9). According to Tables 1 and 2, the main sources of uncertainty are the fission count of 235U,
$ {C}_{\text{U}} $ , and that of the 6Li(n, α)4He reaction,$ {C}_{\text{Li}} $ , in each neutron energy bin. Both the uncertainties are statistical, resulting from the limited measurement duration. With a longer measurement duration, the uncertainty of the fission cross sections would be significantly reduced. For example, if the measurement duration was expended by 10 times, the uncertainties of$ {C}_{\text{U}} $ and$ {C}_{\text{Li}} $ in Table 1 would be reduced to 0.5%~2.7% and 0.4%~1.0%, respectively, and the uncertainty of σU would be reduced to 2.0%~3.4%. In addition, the uncertainties of the angular differential cross section of the 6Li(n, α)4He reaction and the normalization parameter contribute to the total uncertainty. The uncertainty of the normalization process is owing to the uncertainty of the linear fitting, which is related to the uncertainties in the evaluated cross section and fission count in the 0.5~1.0 eV region. It is clear that the normalization process is also an important source of uncertainty. The uncertainty of the angular differential cross sections of the 6Li(n, α)4He reaction and the uncertainty of the normalization process contribute to the systematic uncertainty. The angular differential cross sections have not been adopted as standard values at present. With more measurements in the future, the uncertainty of the angular differential cross sections should be reduced. In the future, by adopting the absolute measurement method rather than the relative measurement method, the systematic uncertainty from the normalization process should also be reduced.Source Magnitude /(%) $ \dfrac{\partial \sigma }{\partial \mathit{\Omega }} $ 1.1 $ {C}_{\text{U}} $ 1.5 ~ 8.5 $ {C}_{\text{Li}} $ 1.2 ~ 3.2 $ \rho $ 1.5 $ {\text{σ}}_{\text{U}} $ 3.1 ~ 9.0 Table 1. Sources and magnitudes of uncertainties of the measured cross sections at 43 energies.
Source Magnitude /(%) $ \dfrac{\partial \sigma }{\partial \mathit{\Omega }} $ 1.1 $ {C}_{\text{U}} $ 2.5 ~ 33.3 $ {C}_{\text{Li}} $ 2.7 ~ 8.0 $ \rho $ 1.5 $ {\text{σ}}_{\text{U}} $ 5.0 ~ 33.7 Table 2. Sources and magnitudes of uncertainties of the measured cross sections at 215 energies.
-
In this study, the measurement method of the fission cross sections using the MTPC is expended from the mono-energetic neutron source [20, 21] to the white neutron source. The uncertainties of the present 235U(n, f) cross sections are larger than those of the previously measured 232Th(n, f) cross sections. The statistical uncertainty mainly contributes to the total uncertainty of the 235U(n, f) cross sections. To reduce the uncertainty, the beam duration should be extended. Although the measurement based on the white neutron source has a relatively low accuracy compared with the measurement based on the mono-energetic neutron source, it has the advantage of measuring at multiple energies simultaneously. The fission cross sections in a large neutron energy range at multiple energies can be measured in one experiment based on the white neutron source, which is a key benefit compared with the measurement based on the mono-energetic neutron source.
Globally, many studies have investigated fission cross section measurement using the TPC, and a representative study is that of the NIFFTE project [4, 8]. As the first specialized TPC for fission cross section measurement, the NIFFTE TPC measured a series of actinides including 235U, 238U, and 239Pu based on the white neutron source at LANSCE, and the uncertainties of the cross section ratios of 238U/235U and 239Pu/235U were less than 2% [10−12]. Compared with the results of this study, the statistical uncertainty of the NIFFTE project was much smaller. Although the accuracy of this study cannot yet reach the same level, the measurement and analysis methods are meaningful, forming the basis of higher accuracy fission cross section measurements using the MTPC based on the white neutron source at CSNS in the future.
The advantages of the fission cross section measurement using the MTPC include the particle identification of the low-energy fission events and the capacities for measuring the uniformity of the sample and the neutron beam. Based on the track reconstruction capacities of the MTPC, the positions of the vertexes of the charged-particles can be reconstructed, from which the uniformities of both the sample and the neutron beam can be determined. With the measurements of the distributions of the vertexes of the decay α particles and the recoil nuclides from the working gas using the upgraded MTPC in the future, the uniformity of both the sample and the neutron beam can be measured. After adopting the absolute measurement, the present uncertainty caused by the normalization process can also be reduced to even less than 1%.
The present cross section measurement of the 235U(n, f) reaction has the following prospects for improvement. First, more actinides can be measured by using the MTPC, including those with shorter half-lives. The detector gain of the MTPC can be easily adjusted by changing the voltages. The interference decay α particles can be almost eliminated with low detector gain. With a sufficiently low gas gain of the MTPC, the counting rate owing to decay α particles can be reduced significantly, making accurate measurement of fission cross sections possible. Second, a thin sample that is suitable for fission cross section measurement should be used. This leads to a relatively weak self-absorption, which reduces the number of low-energy fission events that must be separated from decay α events, resulting in more accurate fission counts. Finally, the method of selecting low-energy fission events based on the parameter
$ {{s}}_{\text{Z}} $ should be developed. For future high-accuracy measurement, there will be significantly higher total fission counts. Then, the original selection method based on checking the 3D-Track figures one by one becomes impossible. However, using the new selection method based on the parameter$ {{s}}_{\text{Z}} $ , the efficiency of the selection process can be greatly improved, which benefits high accuracy measurement in the future. -
The cross sections of the 235U(n, f) reaction were measured at 43 and 215 energies in the neutron energy range from 0.5 eV to 10 keV using the MTPC based on the CSNS Back-n white neutron source. The results were highly consistent with the evaluation data, particularly for the resonance peak area, suggesting that the MTPC has the capacity for accurate fission cross section measurement based on the white neutron source. With a longer beam time, the uncertainties of the measurement results are expected to be significantly reduced. The measurement method of the fission cross sections using the MTPC was extended from mono-energetic to white neutron sources. This study presents the first cross section results measured by the MTPC based on the CSNS Back-n white neutron source. This study confirmed the potential for high-accuracy fission cross section measurement using the MTPC, and more accurate fission cross sections should be measured based on the white neutron source in the future.
-
En /eV Cross Section /b 0.5623 76.9±2.9 0.7079 58.2±2.1 0.8913 55.6±1.9 1.122 68.6±2.2 1.413 18.38±0.89 1.778 15.99±0.82 2.239 12.99±0.74 2.818 17.85±0.90 3.548 22.8±1.2 4.467 7.32±0.66 5.623 24.3±1.1 7.079 18.22±0.87 8.913 110.8±3.4 11.22 49.3±1.8 14.13 27.5±1.1 17.78 41.2±1.4 22.39 37.3±1.6 28.18 27.2±1.1 35.48 35.1±1.3 44.67 30.5±1.1 56.23 51.1±1.6 70.79 20.35±0.71 89.13 21.50±0.80 112.2 20.30±0.78 141.3 18.58±0.72 177.8 19.53±0.77 223.9 20.16±0.82 281.8 15.85±0.62 354.8 9.49±0.43 446.7 13.50±0.55 562.3 12.34±0.47 707.9 8.92±0.37 891.3 6.54±0.28 1122 8.06±0.35 1413 6.26±0.26 1778 6.44±0.27 2239 4.48±0.20 2818 4.52±0.20 3548 4.04±0.17 4467 3.87±0.17 5623 3.66±0.16 7079 2.93±0.13 8912 2.68±0.13 Table A1. Measured 235U(n, f) cross sections at 43 energies from 0.5 eV to 10 keV.
-
En /eV σU /b En /eV σU /b En /eV σU /b 0.5129 86.9±6.7 14.13 53.7±3.7 389.0 6.53±0.63 0.5370 82.5±6.2 14.79 15.6±1.7 407.4 12.4±1.2 0.5623 79.8±5.9 15.49 24.7±2.0 426.6 13.2±1.1 0.5888 73.5±5.5 16.22 28.7±2.1 446.7 14.4±1.3 0.6166 64.9±4.8 16.98 14.0±1.4 467.7 15.8±1.2 0.6457 63.6±4.6 17.78 35.8±2.6 489.8 11.32±0.86 0.6761 60.3±4.4 18.62 44.9±2.9 512.9 14.2±1.1 0.7079 59.0±4.2 19.50 85.2±5.2 537.0 10.35±0.79 0.7413 56.2±4.0 20.42 36.7±3.4 562.3 13.1±1.0 0.7762 53.1±3.7 21.38 21.7±2.3 588.8 12.9±1.1 0.8128 55.5±4.0 22.39 30.3±3.1 616.6 11.50±0.93 0.8511 49.4±3.5 23.44 43.3±3.2 645.7 8.41±0.71 0.8913 53.1±3.7 24.55 48.3±3.7 676.1 6.87±0.51 0.9333 59.4±3.9 25.70 46.3±3.6 707.9 11.8±1.1 0.9772 63.9±4.1 26.91 22.6±2.0 741.3 5.73±0.51 1.023 63.4±3.9 28.18 34.6±3.0 776.2 17.3±1.6 1.072 83.9±4.7 29.51 11.4±1.4 812.8 4.50±0.43 1.122 93.9±5.1 30.90 23.8±1.8 851.1 10.06±0.97 1.175 64.5±4.1 32.36 37.7±2.4 891.3 9.73±0.81 1.230 35.8±2.8 33.88 63.2±3.7 933.3 7.60±0.62 1.288 22.2±2.1 35.48 30.9±2.3 977.2 3.30±0.31 1.349 19.6±1.9 37.15 15.8±1.7 1023 9.09±0.88 1.413 17.3±1.8 38.90 19.4±1.7 1072 9.93±0.82 1.479 17.6±1.8 40.74 33.4±2.5 1122 3.30±0.29 1.549 15.2±1.7 42.66 36.0±2.8 1175 14.3±1.4 1.621 14.7±1.6 44.67 18.8±1.4 1230 9.19±0.83 1.698 17.4±1.8 46.77 24.8±1.9 1288 6.23±0.52 1.778 12.9±1.5 48.98 48.2±3.7 1349 11.02±0.93 1.862 15.1±1.7 51.29 133.1±8.5 1413 3.89±0.34 1.950 19.7±2.0 53.70 40.6±2.4 1479 7.84±0.75 2.042 22.6±2.1 56.23 77.0±3.9 1549 4.58±0.39 2.138 8.9±1.3 58.88 35.7±2.1 1622 7.10±0.65 2.239 10.8±1.4 61.66 10.42±0.82 1698 7.28±0.59 2.344 9.7±1.3 64.57 8.15±0.72 1778 4.25±0.37 2.455 13.0±1.6 67.61 13.3±1.2 1862 4.95±0.44 2.570 7.7±1.2 70.79 49.6±2.9 1950 9.11±0.75 2.692 8.8±1.3 74.13 19.7±1.3 2042 3.08±0.28 2.818 15.3±1.7 77.62 11.62±0.94 2138 4.07±0.38 2.951 21.8±2.2 81.28 19.2±1.5 2239 5.65±0.55 3.090 38.8±3.2 85.11 24.2±1.6 2344 5.00±0.47 3.236 20.7±2.3 89.13 27.1±2.0 2455 5.53±0.51 3.388 17.5±2.1 93.33 23.5±1.8 2570 5.73±0.51 3.548 51.3±4.1 97.72 14.2±1.2 2692 3.91±0.36 3.715 16.4±2.3 102.3 16.7±1.3 2818 6.11±0.55 3.890 5.3±1.2 107.2 28.4±2.6 2951 3.88±0.33 4.074 5.2±1.2 112.2 8.60±0.84 3090 3.39±0.31 4.266 2.50±0.84 117.5 15.3±1.1 3236 4.24±0.38 4.467 5.5±1.3 123.0 43.1±3.2 3388 4.83±0.46 4.677 9.9±1.7 128.8 16.3±1.3 3548 4.52±0.39 4.898 12.2±1.8 134.9 24.6±1.8 3715 4.98±0.44 5.129 5.8±1.1 141.3 21.8±1.9 3890 2.39±0.22 5.370 14.1±1.7 147.9 20.5±1.6 4074 5.11±0.50 5.623 15.6±1.7 154.9 11.50±0.96 4266 3.65±0.33 5.888 22.8±2.0 162.2 21.3±1.7 4467 4.50±0.43 6.166 52.0±3.3 169.8 17.5±1.4 4677 3.91±0.37 6.457 37.6±2.7 177.8 25.9±1.8 4898 2.80±0.24 6.761 10.0±1.2 186.2 6.68±0.71 5129 4.25±0.41 7.079 31.3±2.5 195.0 30.2±2.8 5370 3.59±0.32 7.413 2.63±0.65 204.2 23.6±2.2 5623 3.83±0.34 7.762 3.41±0.87 213.8 16.6±1.3 5888 3.21±0.30 8.128 12.7±1.8 223.9 16.3±1.2 6166 3.60±0.35 8.511 272±15 234.4 34.7±3.1 6457 3.03±0.28 8.913 211±11 245.5 16.8±1.4 6761 3.01±0.28 9.333 50.4±3.2 257.0 17.6±1.3 7079 3.01±0.28 9.772 16.2±1.6 269.2 38.0±3.1 7413 3.17±0.29 10.23 10.0±1.3 281.8 10.65±0.92 7762 2.41±0.24 10.72 20.6±2.3 295.1 12.1±1.0 8128 2.70±0.28 11.22 20.0±2.0 309.0 9.01±0.78 8511 2.55±0.25 11.75 30.6±2.3 323.6 7.73±0.66 8913 3.01±0.29 12.30 139.4±7.6 338.8 7.13±0.71 9333 2.58±0.24 12.88 21.0±1.8 354.8 16.2±1.7 9772 2.52±0.24 13.49 24.2±2.0 371.5 16.1±1.6 Table B1. Measured 235U(n, f) cross sections at 215 energies from 0.5 eV to 10 keV
Cross section measurement for the 235U(n, f) reaction using the MTPC at the CSNS Back-n white neutron source
- Received Date: 2025-07-10
- Available Online: 2026-04-15
Abstract: Accurate fission cross section data are essential for nuclear science and engineering. Traditional fission cross section measurements using the fission ionization chamber struggle to satisfy the accuracy requirements. The Time Projection Chamber (TPC) is a potential detector for high accuracy fission cross section measurement based on its track reconstruction and particle identification capacities. Using the Multi-purpose Time Projection Chamber (MTPC) at the China Spallation Neutron Source (CSNS), we have previously measured the cross sections of the 232Th(n, f) reaction based on the mono-energetic neutron source at Peking University (PKU), showing the potential of high accuracy fission cross section measurement. In this study, cross sections of the 235U(n, f) reaction were measured at 43 energies (10 energy bins per magnitude in equal logarithm intervals) and 215 energies (50 energy bins per magnitude in equal logarithm intervals) in the neutron energy range from 0.5 eV to 10 keV using the MTPC based on the CSNS Back-n white neutron source. The results are consistent with the data in the evaluation libraries, showing the reliability of the fission cross section measurement method using the MTPC. The measurement of the fission cross sections using the MTPC is extended from mono-energetic to white neutron sources. This study presents the first cross section results measured by the MTPC based on the CSNS Back-n white neutron source. With a longer beam time in future measurements, the uncertainties of the fission cross sections are expected to be greatly reduced.


 DownLoad: