


 Abstract
 HTML
HTML Reference
 Related
 PDF
PDF


-
This paper was published online on 16 September 2025 with display errors in Figs. 1 and 2 and a symbol error in the caption of Fig. 9.
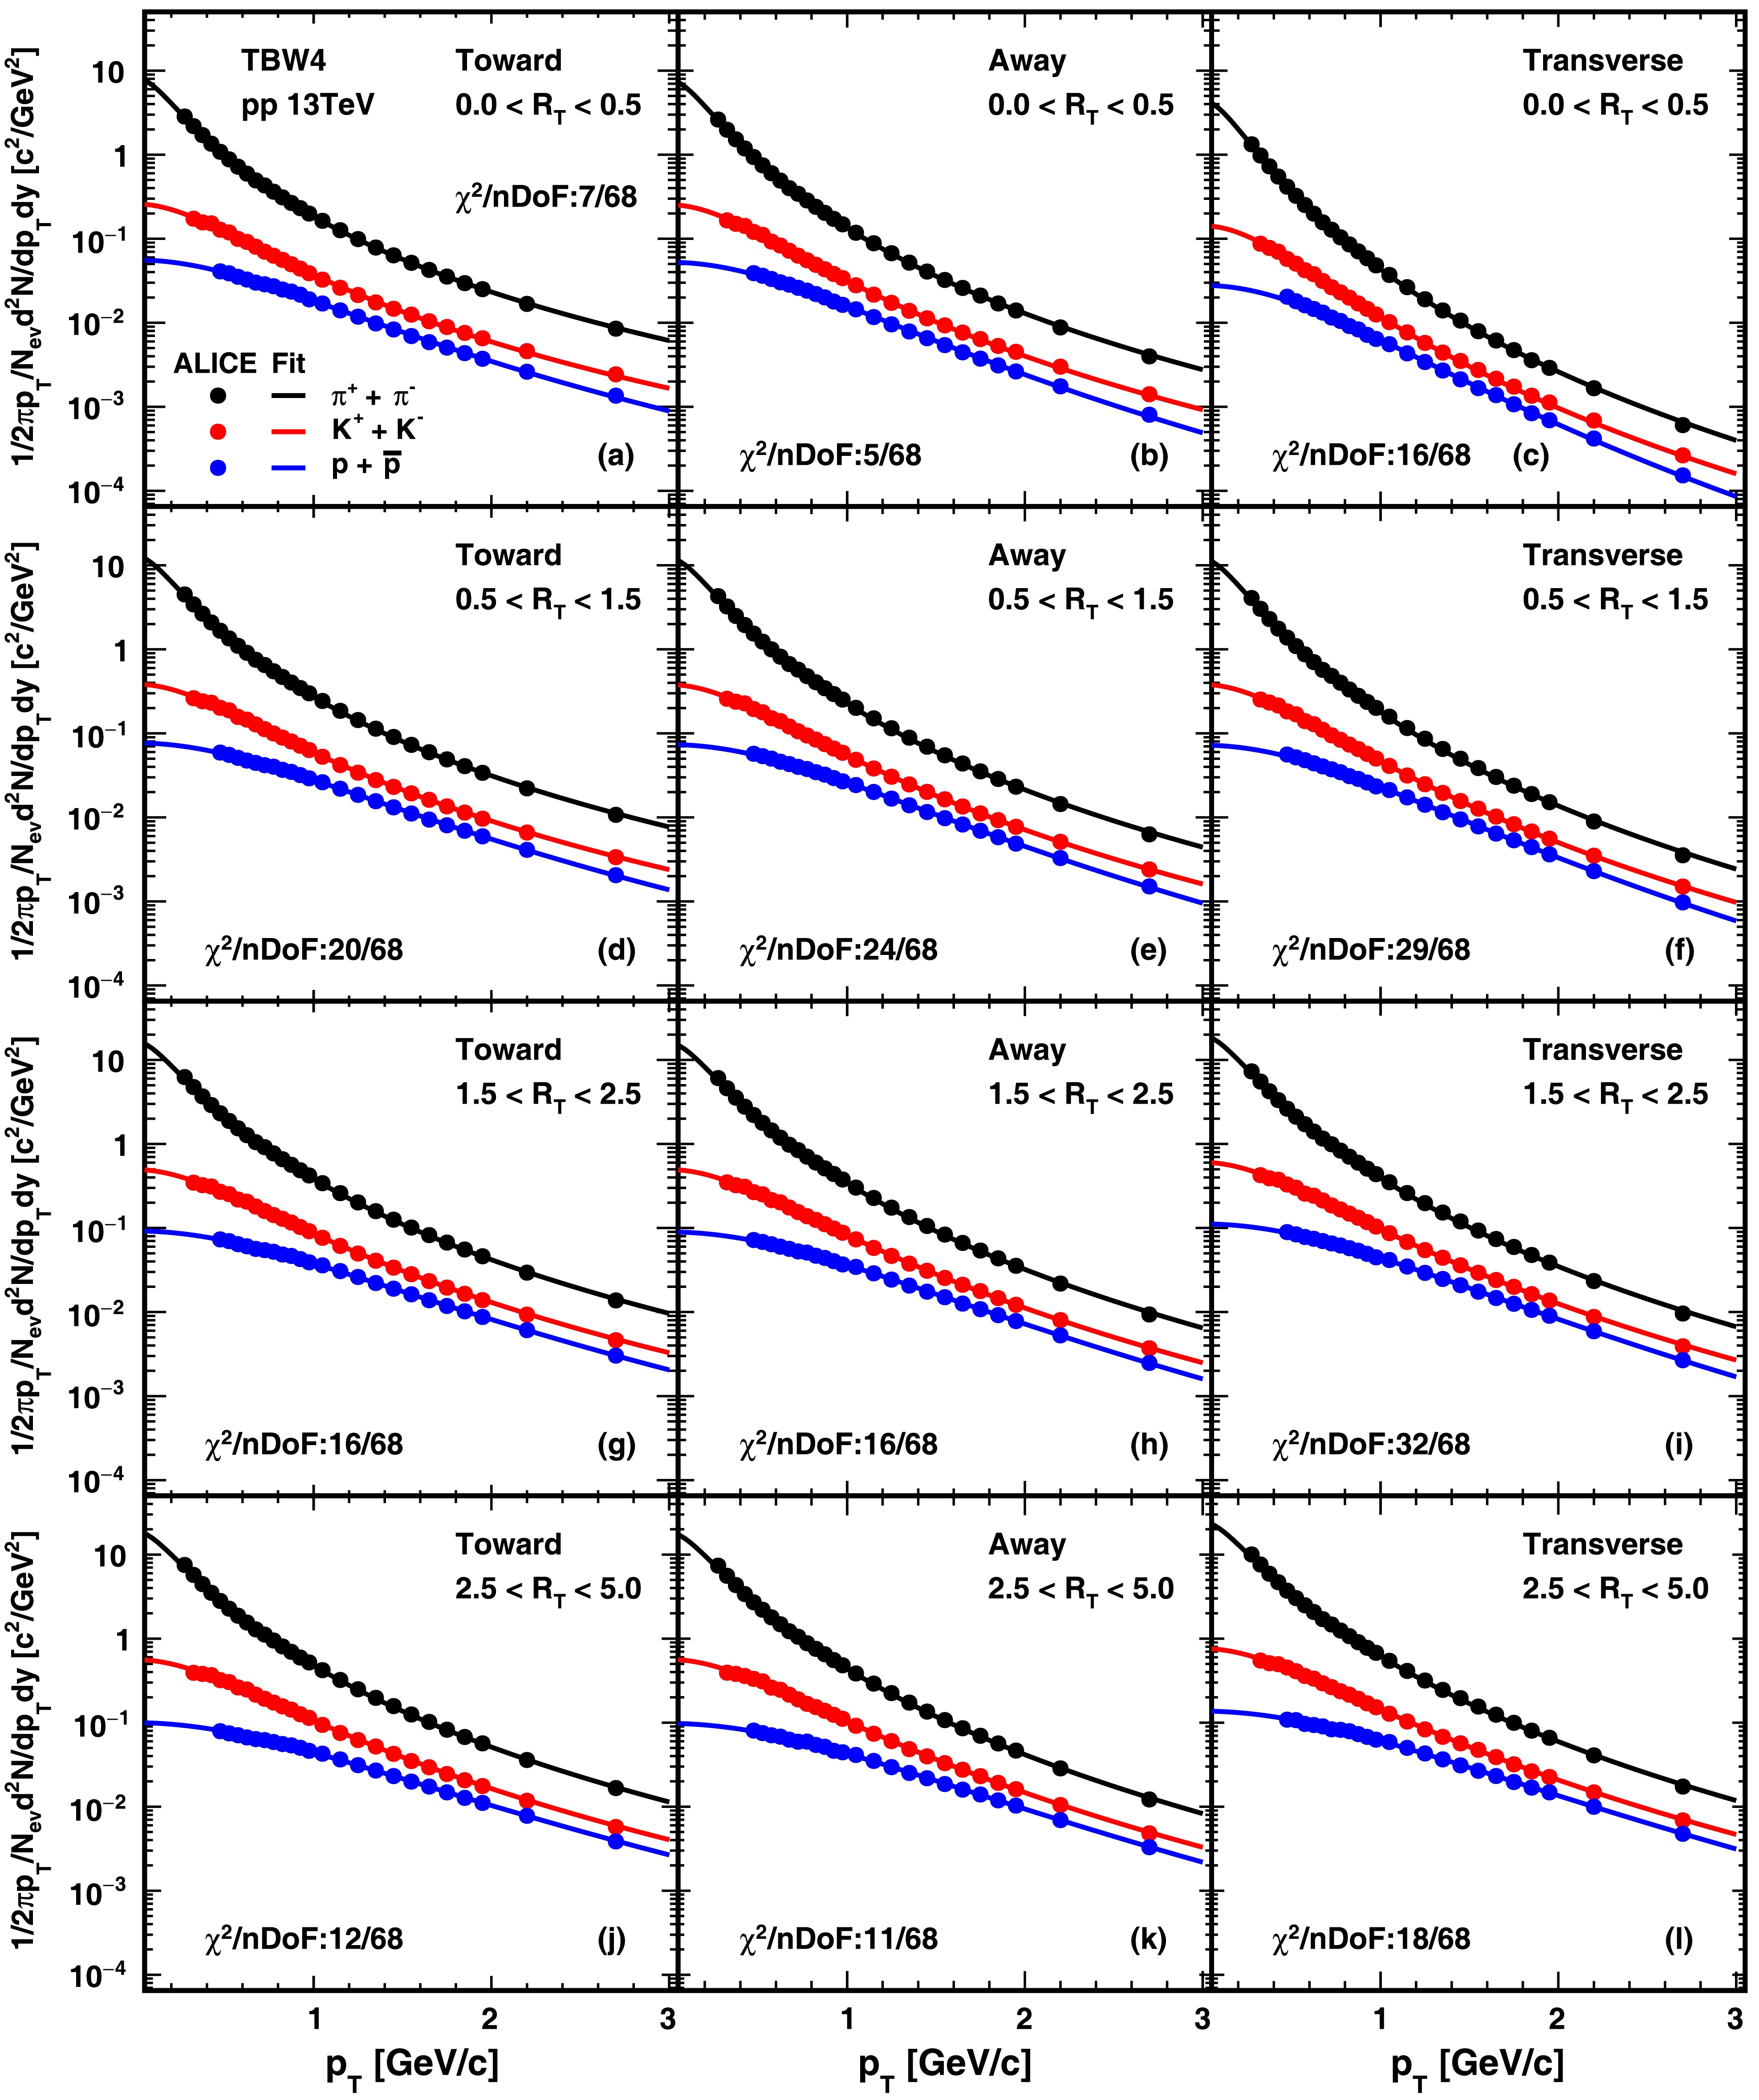
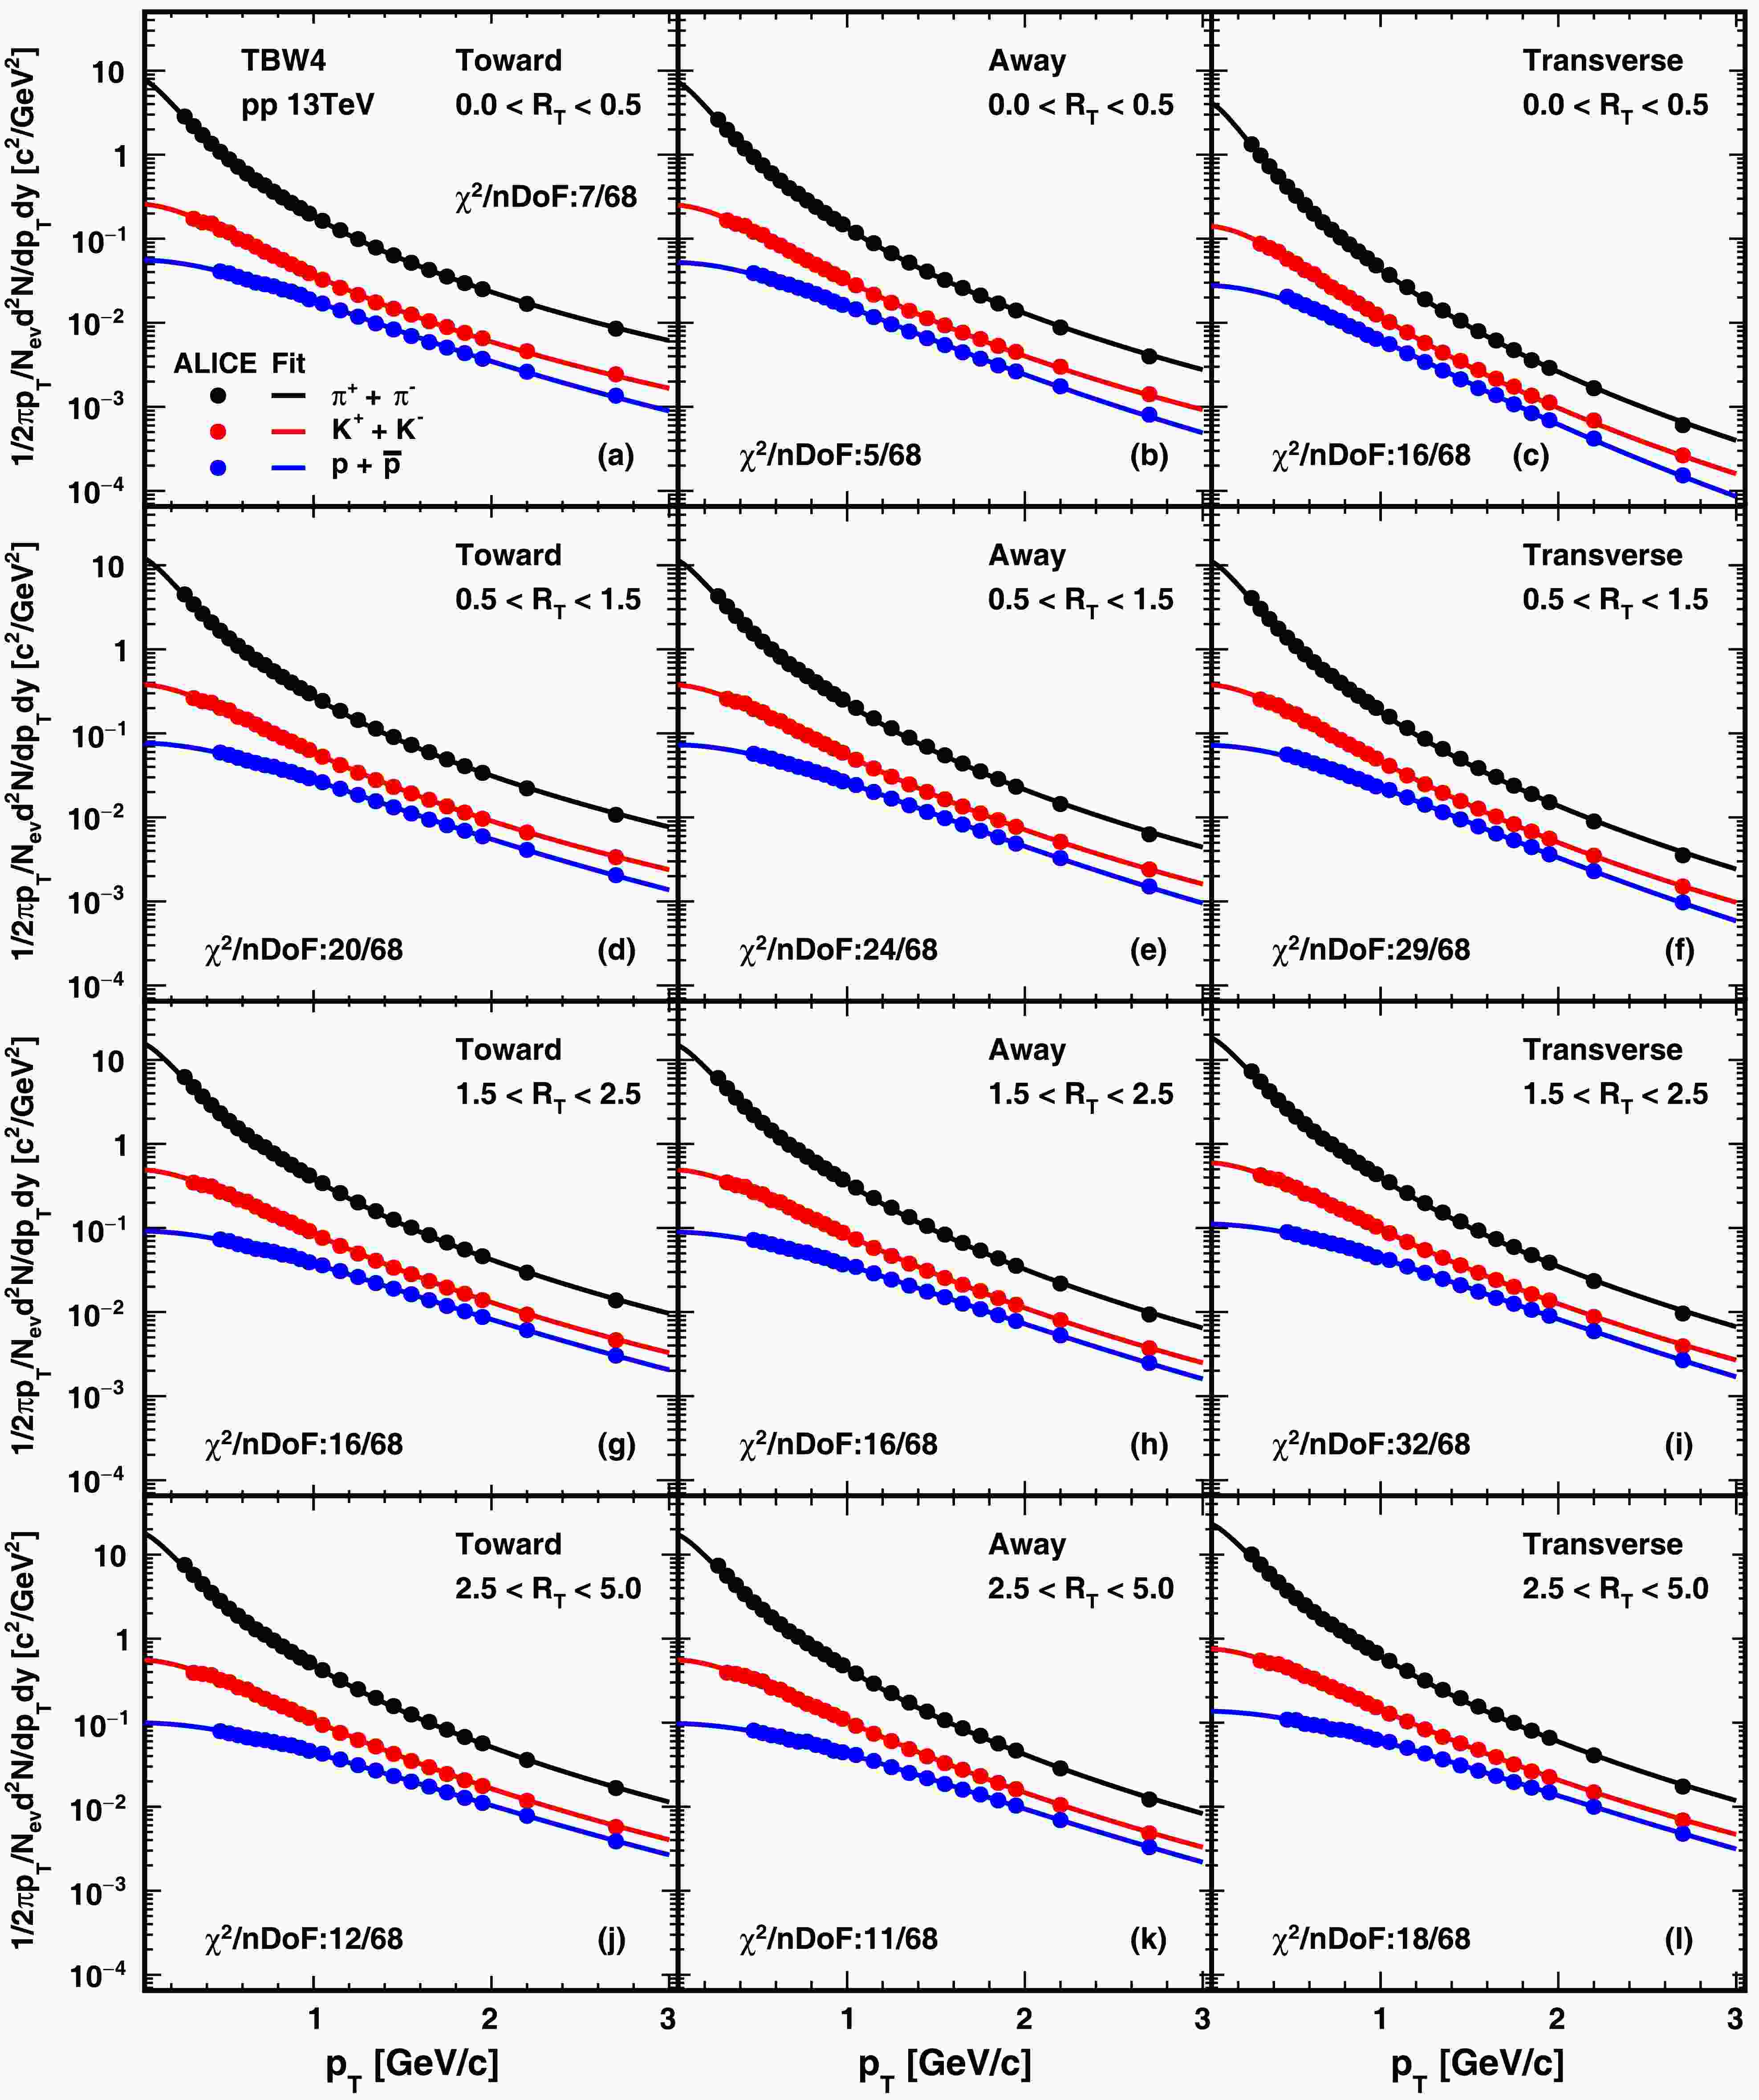
Figure 1. (color online) The TBW4 fits to hadron spectra in pp collisions at
$ \sqrt{s}= $ 13 TeV. Black, red, and blue correspond to π, K, and p particles, respectively. The points represent the ALICE experimental data, and the lines represent the fit results. From top to bottom, the rows represent the$ R_T $ intervals of 0−0.5, 0.5−1.5, 1.5−2.5, and 2.5−5. From left to right, the columns represent the forward, backward, and transverse regions. The uncertainties in the experimental data are the quadratic sum of statistical and systematic errors.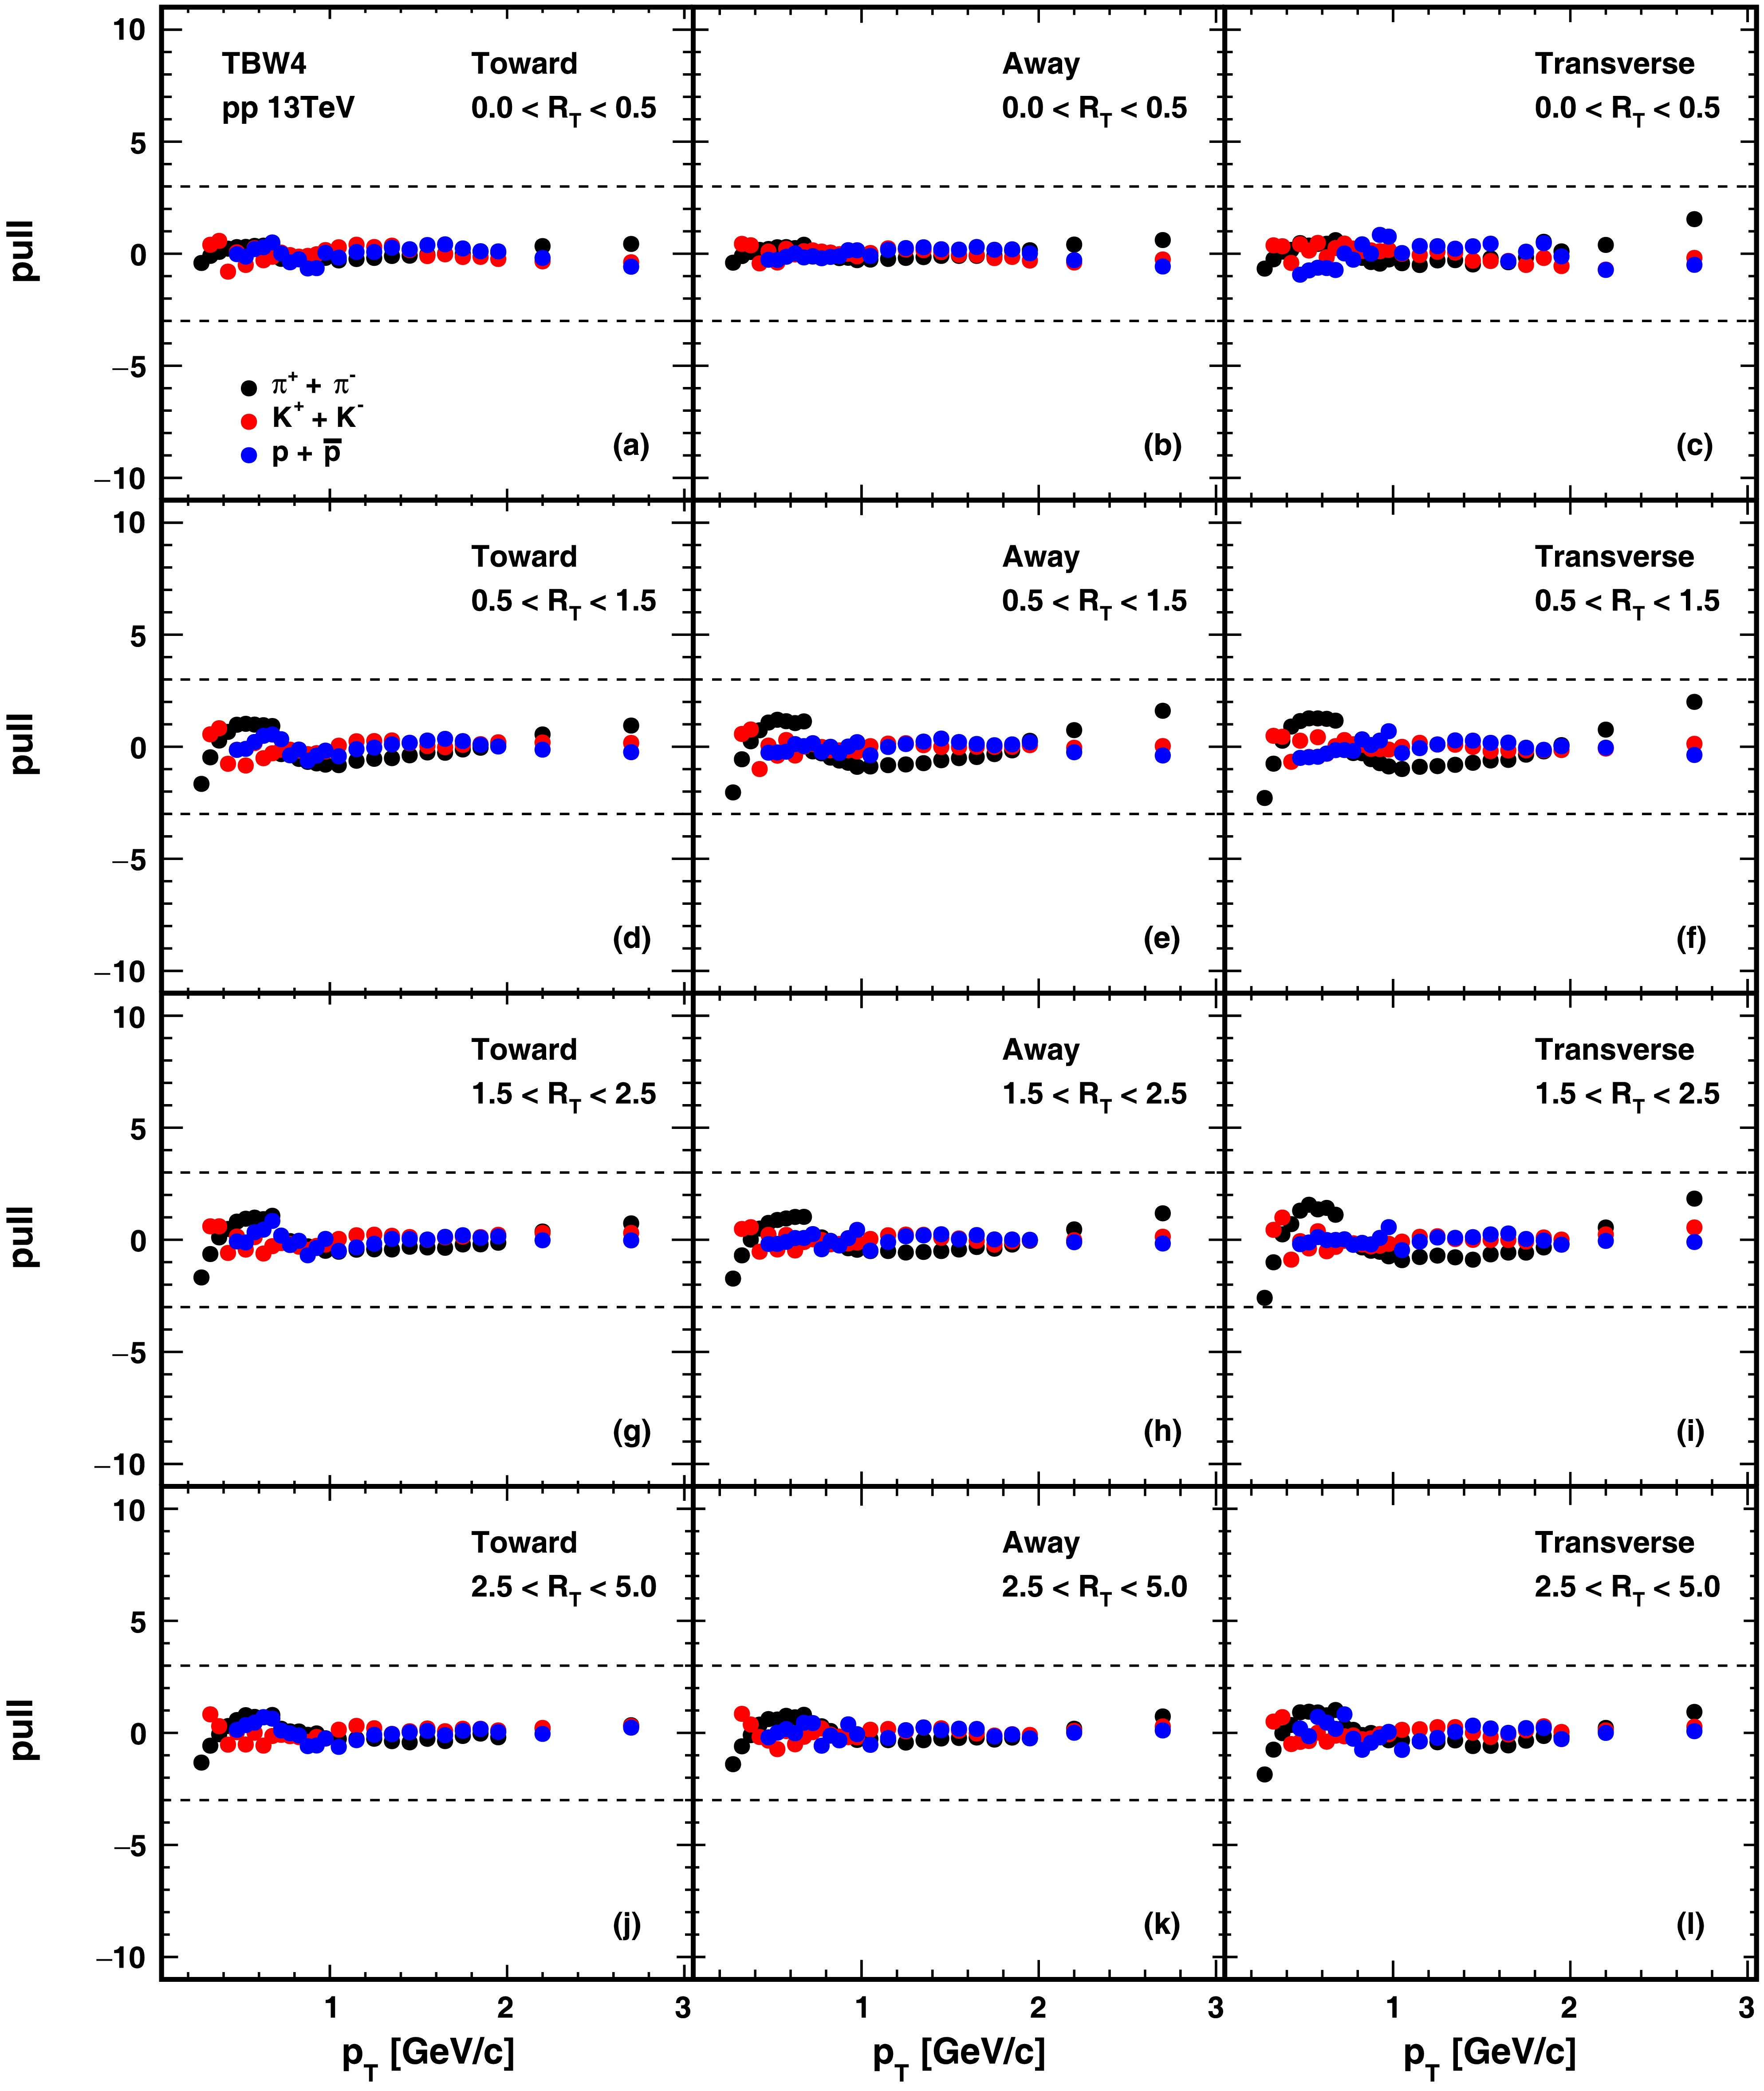
Figure 2. (color online) The deviations of TBW4 fits to hadron spectra divided by data uncertainties in pp collisions at
$ \sqrt{s}= $ 13 TeV. Black, red, and blue correspond to π, K, and p particles, respectively. From top to bottom, the rows represent the$ R_T $ intervals of 0−0.5, 0.5−1.5, 1.5−2.5, and 2.5−5. From left to right, the columns represent the forward, backward, and transverse regions. The dashed lines represent where the difference between model and experiment data is three times the error of data.Specifically, Fig. 1, which should have displayed the transverse momentum spectrum, instead shows the fitting error. Figure 2, which should have displayed the fitting error, incorrectly shows the content of Fig. 3, resulting in duplication with Fig. 3. The versions of Fig. 1 and Fig. 2 provided in this document serve as errata for the corresponding figures in the published paper. Furthermore, the two occurrences of
$ R_T$ in the caption of Fig. 9 should be corrected to$ R_{ch}$ .These errors may have arisen from oversights during the document editing process. All formulas and conclusions in the main text remain unaffected by these corrections, and no other changes are required.
-
This paper was published online on 16 September 2025 with display errors in Figs. 1 and 2 and a symbol error in the caption of Fig. 9.
Figure 1. (color online) The TBW4 fits to hadron spectra in pp collisions at
$ \sqrt{s}= $ 13 TeV. Black, red, and blue correspond to π, K, and p particles, respectively. The points represent the ALICE experimental data, and the lines represent the fit results. From top to bottom, the rows represent the$ R_T $ intervals of 0−0.5, 0.5−1.5, 1.5−2.5, and 2.5−5. From left to right, the columns represent the forward, backward, and transverse regions. The uncertainties in the experimental data are the quadratic sum of statistical and systematic errors.
Figure 2. (color online) The deviations of TBW4 fits to hadron spectra divided by data uncertainties in pp collisions at
$ \sqrt{s}= $ 13 TeV. Black, red, and blue correspond to π, K, and p particles, respectively. From top to bottom, the rows represent the$ R_T $ intervals of 0−0.5, 0.5−1.5, 1.5−2.5, and 2.5−5. From left to right, the columns represent the forward, backward, and transverse regions. The dashed lines represent where the difference between model and experiment data is three times the error of data.Specifically, Fig. 1, which should have displayed the transverse momentum spectrum, instead shows the fitting error. Figure 2, which should have displayed the fitting error, incorrectly shows the content of Fig. 3, resulting in duplication with Fig. 3. The versions of Fig. 1 and Fig. 2 provided in this document serve as errata for the corresponding figures in the published paper. Furthermore, the two occurrences of
$ R_T$ in the caption of Fig. 9 should be corrected to$ R_{ch}$ .These errors may have arisen from oversights during the document editing process. All formulas and conclusions in the main text remain unaffected by these corrections, and no other changes are required.
Erratum: Extracting the kinetic freeze-out properties of high energy pp collisions at the LHC with event shape classifiers [Chin. Phys. C 50(1): 014108 (2026)]
- Received Date: 2025-05-28
- Available Online: 2026-03-15
Abstract:


 DownLoad: