-
The interactions among baryons under the flavor SU(3) symmetry, which includes up, down, and strange quarks, represent a fundamental aspect of strong interaction. While interactions between ordinary nucleons have been experimentally studied in very detail, knowledge of those involving at least one or more hyperons remains limited [1]. Only a small amount of experimental data is available for hyperon-nucleon scattering and even no data for hyperon-hyperon scattering, as the relatively short lifetimes of hyperons, typically on the order of
$ 10^{-10} $ s, make such direct experiments challenging. In this context, experimental investigations of hypernuclei, especially single and double Λ-hypernuclei, have played an important role in exploring hyperon-nucleon and hyperon-hyperon interactions.The hypertriton (
$ {}^{3}_{\Lambda}{\rm{H}} $ ), consisting of a proton, a neutron, and a Λ hyperon, is the lightest known hypernucleus, serving as a benchmark in the field of hypernuclear physics [2]. Extensive efforts have been and are being undertaken to determine its properties such as the Λ binding energy and lifetime with different experimental approaches [3−7]. Earlier experimental studies using nuclear emulsion techniques in 1970's obtained the Λ binding energy to the deuteron core of$ 0.13 \pm 0.05 $ MeV [8], which has served as a crucial input for theoretical calculations of hypernuclei [9, 10]. Recent results from ultra-relativistic heavy-ion collision experiments evaluated the binding energy to be 0.41±0.12(stat.)±0.11(syst.) MeV [11] and 0.102±0.063(stat.)±0.067(syst.) MeV [12] by the STAR and ALICE collaborations, respectively. Further efforts to achieve unprecedented precision on the binding energy are underway, including the J-PARC E07 experiment employing machine-learning techniques [13, 14] and the decay-pion spectroscopy experiment at the MAMI facility [15].One of the intriguing features of hypertriton is its expected Λ-halo structure, arising from the weak binding of the Λ hyperon to the deuteron core. A large root-mean-square matter radius of
$ \sim 5 $ fm has been predicted for a Λ binding energy of 0.13 MeV, while theoretical studies have shown a strong dependence of the radius on the binding energy [16, 17]. So far, there has been no direct measurement of the matter radius of$ {}^{3}_{\Lambda}{\rm{H}} $ , due to experimental challenges originating from its low production rate and short lifetime. Nevertheless, if realized, such measurements would offer valuable new insights into the structures and underlying interactions of hypernuclei.The nuclear matter distribution of short-lived unstable nuclei has been extensively studied, leading to the unveiling of exotic structures such as nuclear halos and skins [18−20], since the pioneering discovery of the two-neutron halo in 11Li [21, 22]. The interaction cross section, defined as the sum of the cross sections for all reactions that change the identity of the projectile (i.e., the number of protons or neutrons), provides a measure to deduce the root-mean-square matter radius through the Glauber model reaction theory. The transmission method [23] is employed to experimentally determine the interaction cross section, where the ratio of the number of incident projectiles on a target to the number of outgoing unreacted projectiles is measured. This technique requires in-flight separated and identified beams of the nuclei of interest, which can be done using fragment separator facilities [24, 25]. For instance, the interaction cross sections of 31Ne [26] and 29F [27] were measured with BigRIPS [28] at RIBF and 23O [29] with FRS [30] at GSI. However, this method is practically challenging in the case of hypernuclei due to their very short lifetimes, typically on the order of a few hundred picoseconds. Alternative approaches are therefore required to probe hypernuclear interaction cross sections.
In order to realize experimental studies of
$ {}^{3}_{\Lambda}{\rm{H}} $ halo structure, we propose a novel method for measuring interaction cross sections of hypernuclei produced via projectile fragmentation reactions with relativistic heavy-ion beams. The core concept of the method is to utilize the reconstructed production point distribution of$ {}^{3}_{\Lambda}{\rm{H}} $ within a production target, taking advantage of in-flight hypernuclei and the WASA-FRS experimental setup at GSI and FAIR [31]. This approach is complementary to the forthcoming experiment proposed by the R3B collaboration at GSI and FAIR with the HYDRA experimental setup [32], which focuses on measuring decay-vertex distributions in two independent measurements with different target thickness setups.In this article, we investigate the feasibility of the proposed experiment for measuring hypernuclear interaction cross sections using Monte Carlo simulations. First, in Section II, we elaborate on the principle of the proposed method. Next, in Section III, we introduce the experimental method utilizing the WASA-FRS hypernuclear experimental setup at GSI and FAIR. In Section IV, we discuss the feasibility of extracting the interaction cross section and possible improvements to the experimental setup for future experiments. Finally, a summary is provided in Section V.
-
In the present investigation, we aim at determining the interaction cross section of
$ {}^{3}_{\Lambda}{\rm{H}} $ with a carbon target, hereafter referred to as$ \sigma_{I(^{3}_{\Lambda}{\rm{H}})} $ , with a relative uncertainty of the order of 10%. The essence of the proposed method is to deduce$ \sigma_{I(^{3}_{\Lambda}{\rm{H}})} $ from the reconstructed production point distribution of$ {}^{3}_{\Lambda}{\rm{H}} $ in the target. The interaction cross section can be extracted from a slope of the production point distribution, since the slope reflects the attenuation of$ {}^{3}_{\Lambda}{\rm{H}} $ along the target material due to its interaction with target nuclei. Detailed principle is formulated in this section.In the WASA-FRS hypernuclear experiment, relativistic 6Li ions at 2 GeV/u impinge on a fixed carbon target in order to produce in-flight
$ {}^{3}_{\Lambda}{\rm{H}} $ . The$ {}^{3}_{\Lambda}{\rm{H}} $ hypernuclei are produced via projectile fragmentation followed by capturing a Λ hyperon created in a hot participant region of the collision. Since the forward emitted$ {}^{3}_{\Lambda}{\rm{H}} $ has a similar velocity to the primary beam, the decay length of$ {}^{3}_{\Lambda}{\rm{H}} $ in the laboratory frame is of the order of 20 cm due to the Lorentz boost. The invariant-mass spectroscopy method is employed to identify events associated with$ {}^{3}_{\Lambda}{\rm{H}} $ , by measuring momenta of all the decay products, especially$ \pi^- $ and 3He via the mesonic two-body decay mode.The production point of the
$ {}^{3}_{\Lambda}{\rm{H}} $ within the target material can be reconstructed by measuring light charged particles (e.g.,$ \pi^\pm $ ,$ K^+ $ , and proton) produced in the primary reaction. Since those particles created in the participant zone of the collision have a broad angular distribution, in contrast to the$ {}^{3}_{\Lambda}{\rm{H}} $ measured at forward, their trajectories in combination with the incident beam track constrain the production point of$ {}^{3}_{\Lambda}{\rm{H}} $ with a reasonable resolution. A simulation with Ultra-relativistic Quantum Molecular Dynamics (UrQMD) model [33, 34] predicts the average number of emitted particles to be 4.7 in coincidence with the forward$ {}^{3}_{\Lambda}{\rm{H}} $ . This multiplicity enables efficient reconstruction of the production point, as demonstrated in a detailed simulation in Section IV.The reconstructed production point distribution
$ {\rm{PPD}}_{\rm{reco}}(z) $ for the$ {}^{3}_{\Lambda}{\rm{H}} $ -identified events is proportional to the following two factors in terms of its z dependence within the target material: (i) the real production point distribution$ {\rm{PPD}}_{\rm{all}}(z) $ and (ii) survival probability$ P_{\rm{surv}}(z) $ of$ {}^{3}_{\Lambda}{\rm{H}} $ from the production point z to the exit surface of the target. Here, we adopt the z axis along the direction of the primary beam with$ z=0 $ and$ z=z_{{\rm{T}}} $ being at the entrance and exit planes of the target, respectively. Other factors such as the branching ratio of the$ {}^{3}_{\Lambda}{\rm{H}} $ $ \rightarrow $ $ \pi^{-} + ^{3} $ He decay mode or the survival probability of$ {}^{3}_{\Lambda}{\rm{H}} $ after the exit of the target are common for different production points z and thus do not affect the following discussions based on the z dependence.The first factor
$ {\rm{PPD}}_{\rm{all}}(z) $ includes all events associated with the hypertriton production and is expressed by$ \begin{aligned}[b] {\rm{PPD}}_{\rm{all}}(z) &= dN_{{}^{3}_{\Lambda}{\rm{H}}}/dz \\ &= n \cdot \sigma_{P(^{3}_{\Lambda}{\rm{H}})}\cdot N_{0}\cdot e^{-n\sigma_{I(^6{\rm{Li}})}z}, \end{aligned} $

(1) where
$ dN_{{}^{3}_{\Lambda}{\rm{H}}} $ represents the number of$ {}^{3}_{\Lambda}{\rm{H}} $ produced in a region$ [z, z+dz] $ . The symbol n denotes the target particle density, and$ N_{0} $ for the initial number of the primary 6Li beam particles at the entrance of the target ($ z=0 $ ).$ \sigma_{P(^{3}_{\Lambda}{\rm{H}})} $ is the production cross section of the$ \rm{}^{3}_{\Lambda}{\rm{H}} $ in the 6Li$ +^{12} $ C reaction, which was evaluated to be$ 3.9 \pm 1.4 $ μb in the former HypHI experiment at GSI [35].$ \sigma_{I(^6{\rm{Li}})} $ represents the interaction cross section of 6Li with a carbon target, which was measured to be 688±10 mb at 790 MeV/u [21]. Here, we assume the same value in the present investigation, as the averaged nucleon-nucleon total cross section is nearly the same for high energies [36]. However, it should be noted that a measurement of$ \sigma_{I(^6{\rm{Li}})} $ directly at the energy of interest would be important for future precise investigations in order to avoid uncertainties arising from the energy dependence of the nuclear-nuclear interaction cross sections.The second factor, survival probability
$ P_{\rm{surv}}(z) $ , is given by$ \begin{aligned}[b] P_{{\rm{surv}}}(z) &=e^{-\left(n\sigma_{I(^{3}_{\Lambda}{\rm{H}})}+\frac{1}{\gamma\beta c \tau} \right)(z_{\rm{T}}-z)}, \end{aligned} $

(2) where the parameters β and γ are the velocity of the
$ {}^{3}_{\Lambda}{\rm{H}} $ relative to the speed of light c and the Lorentz factor, respectively. τ represents the$ {}^{3}_{\Lambda}{\rm{H}} $ lifetime, which has the averaged value of$ 237 \pm 10 $ ps [12, 37, 38].From Equations (1) and (2), the z-dependence of the reconstructed production point distribution
$ {\rm{PPD}}_{\rm{reco}}(z) $ is given as$ \begin{aligned}[b] {\rm{PPD}}_{\rm{reco}}(z) &\propto {\rm{PPD}}_{\rm{all}}(z) \cdot P_{{\rm{surv}}}(z) \\ &\propto e^{\left(n\sigma_{I(^{3}_{\Lambda}{\rm{H}})}+\frac{1}{\gamma\beta c \tau} - n\sigma_{I(^6{\rm{Li}})} \right)z}. \end{aligned} $

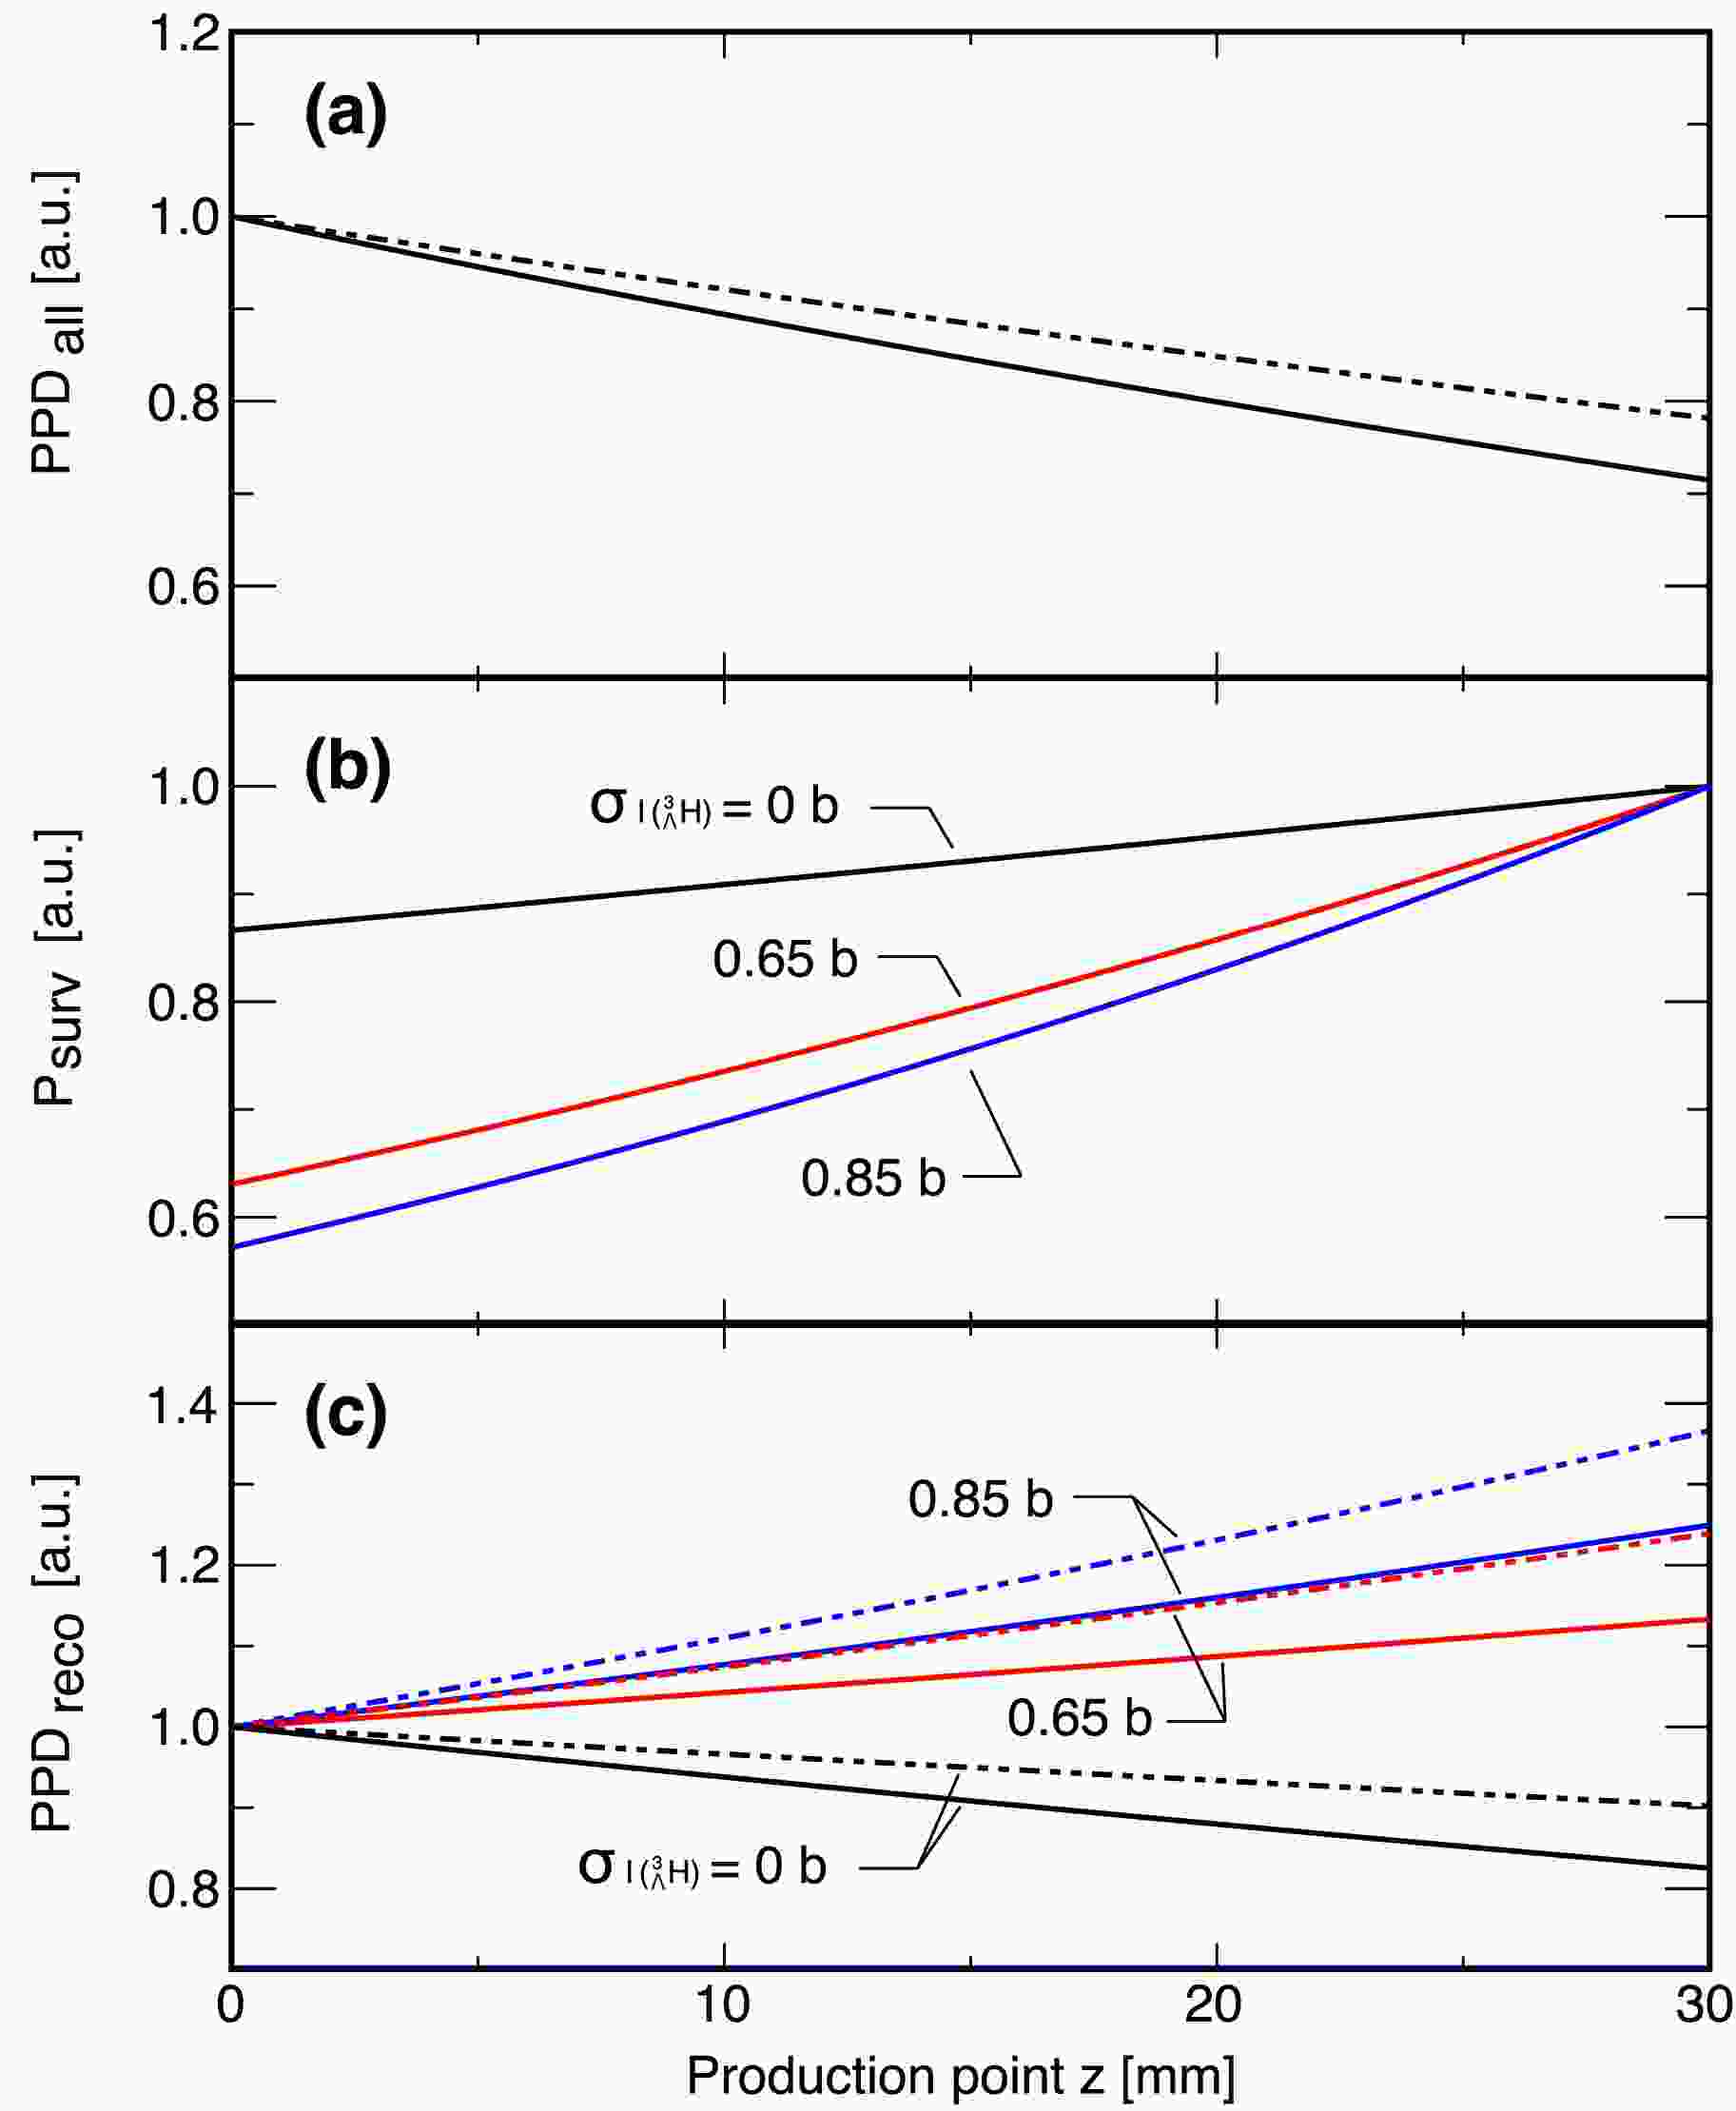
(3) Fig. 1 (a), (b) and (c) show
$ {\rm{PPD}}_{\rm{all}}(z) $ ,$ P_{{\rm{surv}}}(z) $ , and$ {\rm{PPD}}_{\rm{reco}}(z) $ for three different cases of$ \sigma_{I(^{3}_{\Lambda}{\rm{H}})} $ at 0, 0.65, and 0.85 b respectively. Note that$ \sigma_{I(^{3}_{\Lambda}{\rm{H}})} $ = 0.65 and 0.85 b approximately correspond to predicted values for the Λ-binding energy of 0.41 and 0.13 keV, respectively, as calculated in Ref. [32]. Here, we assumed a diamond target ($ n=1.6\times 10^{23} $ cm$ ^{-3} $ ) with a thickness of$ z_T=3 $ cm based on the experimental setup of the first WASA-FRS experiment in 2022. The difference of 0.2 b, from$ \sigma_{I(^{3}_{\Lambda}{\rm{H}})} = 0.85 $ b to 0.65 b, leads to a detectable difference in the exponential slope of about 43%. The uncertainties associated with$ \sigma_{I(^6{\rm{Li}})} $ and τ results in errors of 10 mb and 12 mb, respectively. Therefore, the aimed uncertainty of$ \sigma_{I(^{3}_{\Lambda}{\rm{H}})} $ on the order of 10% can, in principle, be achieved with this method, provided that a sufficient amount of statistics is accumulated and other experimental systematic errors are well controlled. Details of these conditions are discussed in Section IV.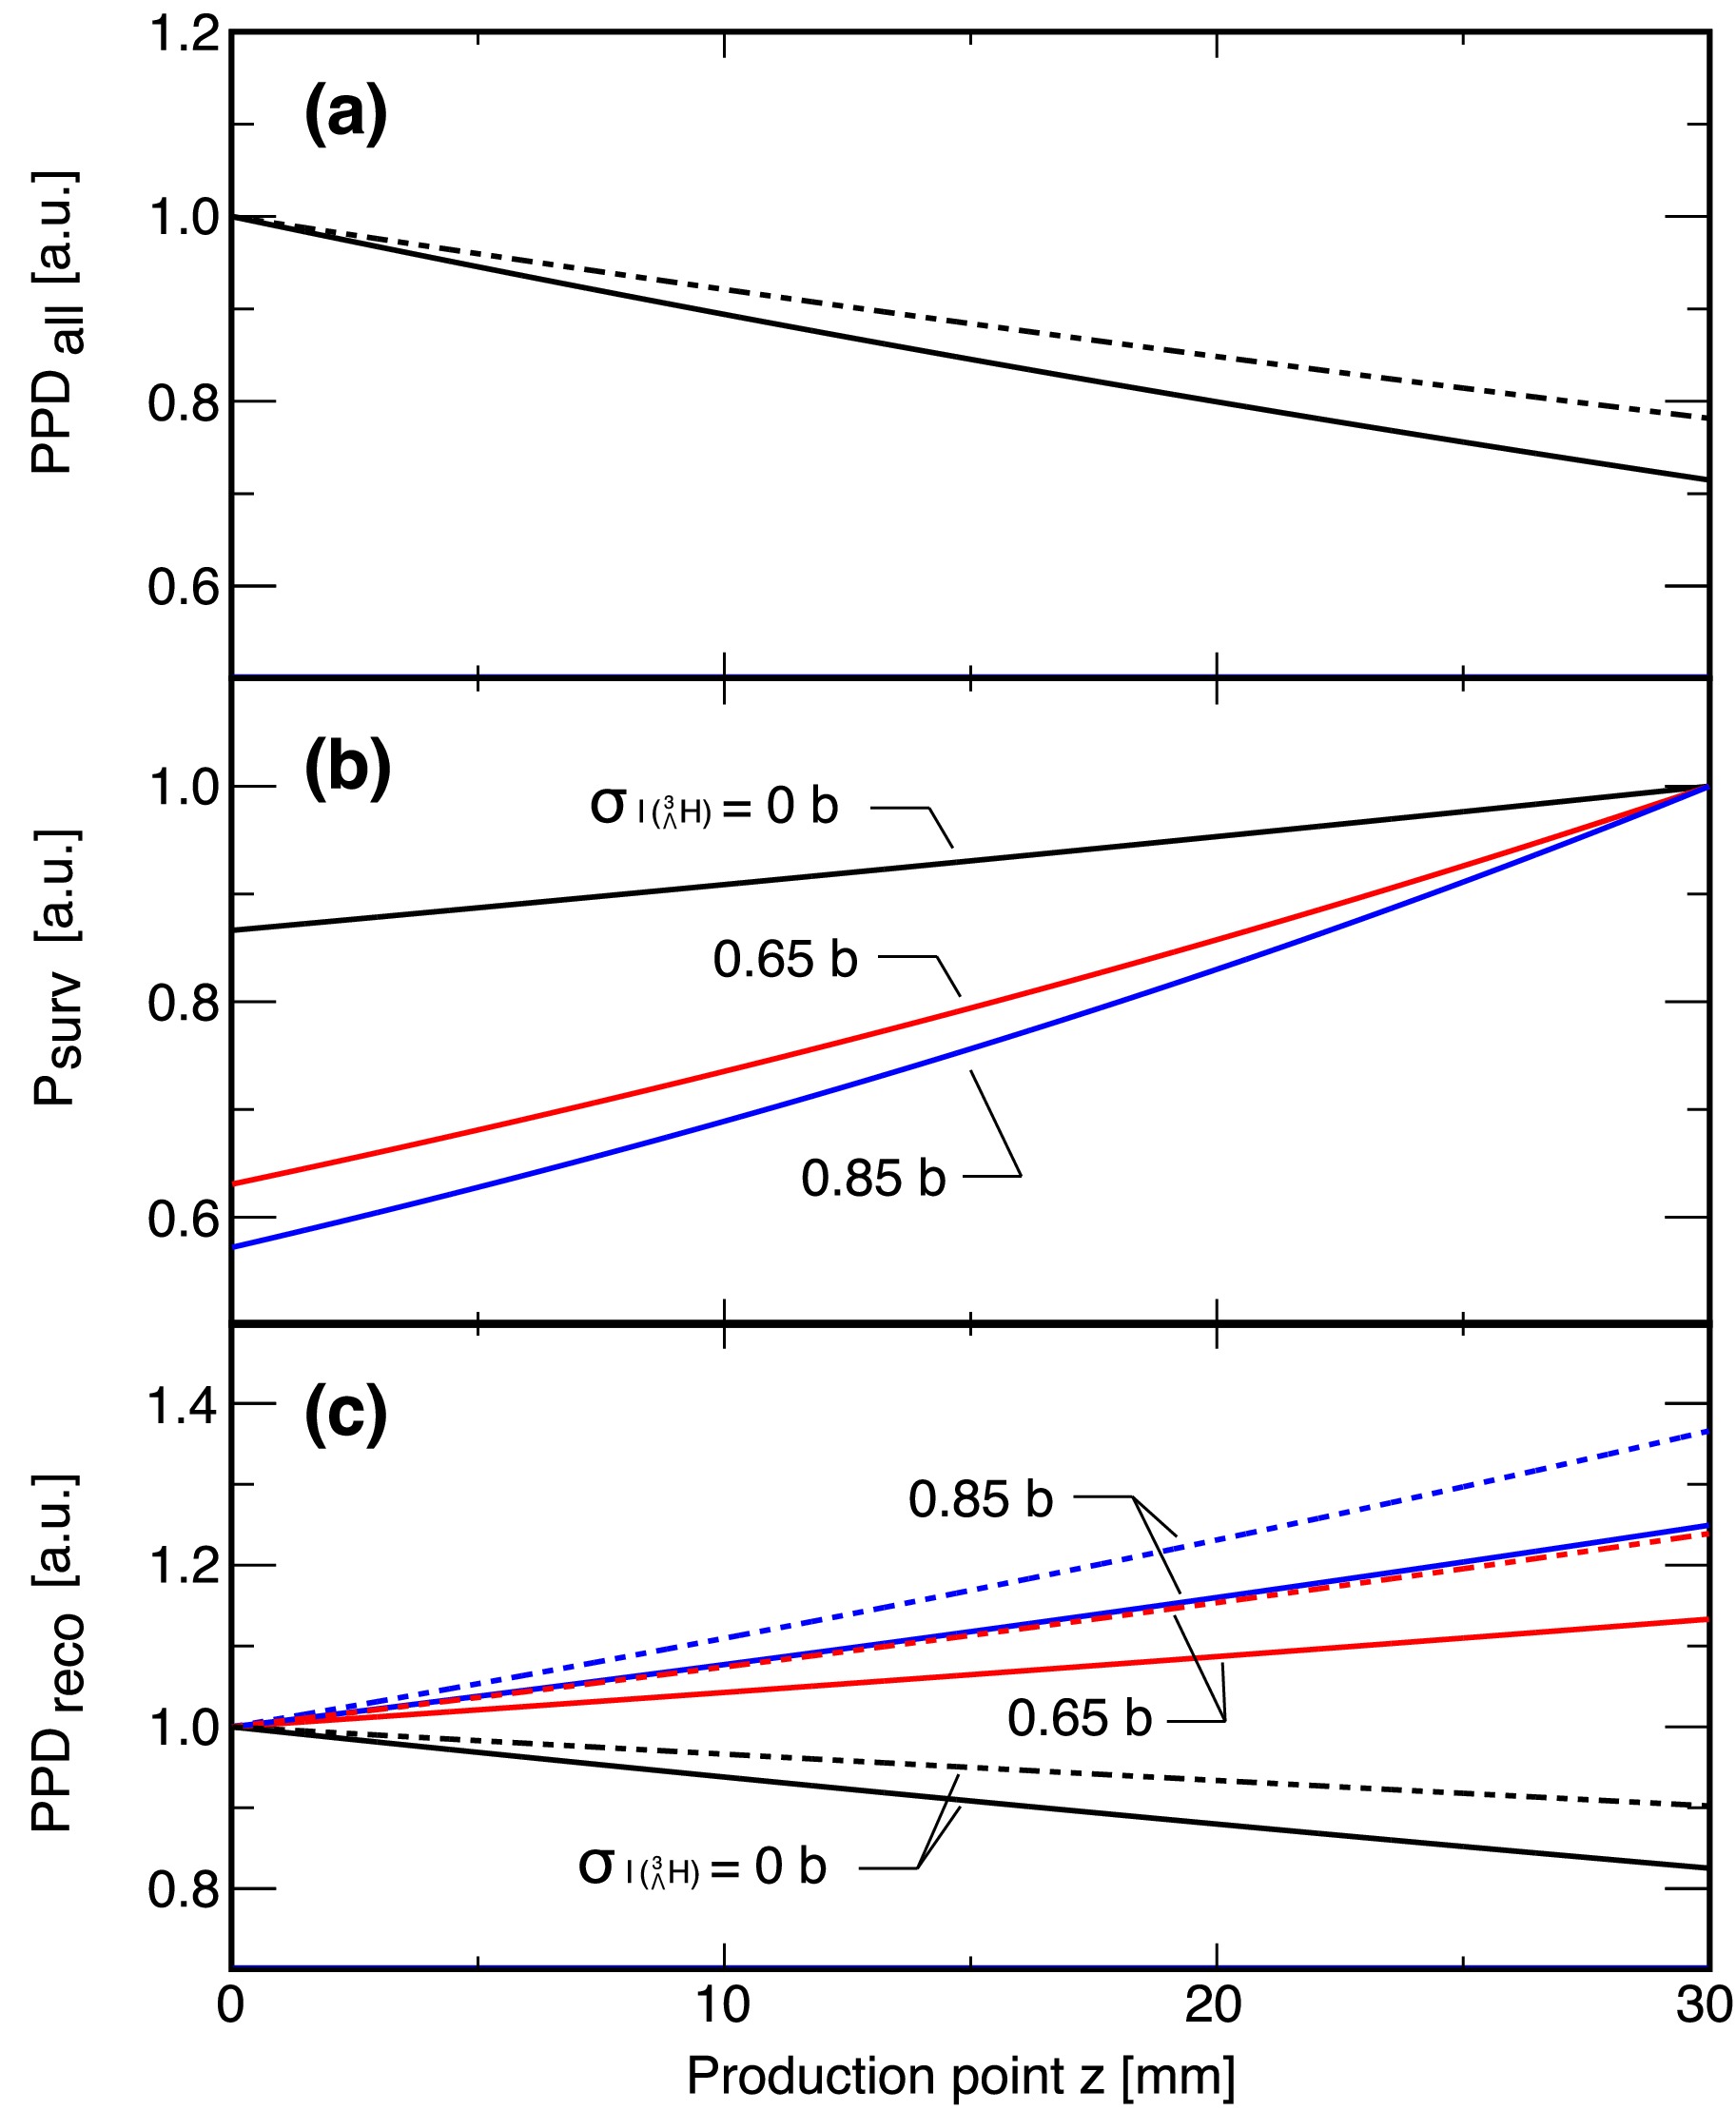
Figure 1. (a) Illustration of production point distribution
$ {\rm{PPD}}_{\rm{all}}(z) $ along the beam direction z. (b) Survival probability$ P_{\rm{surv}}(z) $ of$ {}^{3}_{\Lambda}{\rm{H}} $ from the production point z to the exit of the target ($ z=3 $ cm). Colors correspond to differently assumed interaction cross sections of$ \sigma_{I(^{3}_{\Lambda}{\rm{H}})} $ = 0 b (black), 0.65 b (red), and 0.85 b (blue). (c) Reconstructed production point distribution$ {\rm{PPD}}_{\rm{reco}}(z) $ . The solid curves represent results only with the direct$ {}^{3}_{\Lambda}{\rm{H}} $ production, and the dashed curves include a contribution of the two-step process with intermediate 4He.Furthermore, we evaluate the influence of the two-step strangeness production, which refers to the production of
$ {}^{3}_{\Lambda}{\rm{H}} $ via other secondary fragments. Such processes introduce an additional term of the form$ \begin{aligned}[b] {\rm{PPD}}^{(2)}_{\rm{all}}(z) &= \sum_{X} N_0n\sigma_{P(X\rightarrow ^{3}_{\Lambda}{\rm{H}})} \frac{\sigma_{P(X)}}{\sigma_{I(X)}-\sigma_{I({}^6{\rm{Li}})}} \\ &(e^{-\sigma_{I({}^6{\rm{Li}})}nz}-e^{-\sigma_{I(X)}nz}) \end{aligned} $

(4) to be added in
$ {\rm{PPD}}_{\rm{all}}(z) $ in Equation (1), where$ \sigma_{P(X)} $ ,$ \sigma_{I(X)} $ , and$ \sigma_{P(X\rightarrow ^{3}_{\Lambda}{\rm{H}})} $ represent the production cross section of an intermediate fragment X from the primary beam, the interaction cross section of X, and the$ {}^{3}_{\Lambda}{\rm{H}} $ production cross section from X, respectively. The dashed curves in Panels (a) and (c) illustrate the effects due to the secondary$ {}^{3}_{\Lambda}{\rm{H}} $ production via intermediate 4He, which we estimate to have the dominant contribution. Here, we assumed$ \sigma_I(^{4}{\rm{He}})=503 $ mb from Ref [39],$ \sigma_P(^{4}{\rm{He}})=239 $ mb estimated by the Liége Intranuclear Cascade model (INCL++) [40, 41], and$ \sigma_{P(X\rightarrow ^{3}_{\Lambda}{\rm{H}})}=3.0 $ μb with Dubna Cascade Model (DCM-QGSM) [42]. While the total amount of the reconstructed$ {}^{3}_{\Lambda}{\rm{H}} $ due to this two-step process is only 4%, it predominantly contributes to larger z in$ {\rm{PPD}}_{\rm{reco}}(z) $ and affects the overall slope of the distribution, as displayed in Panel (c) of Fig. 1. This leads to a bias in the determination of$ \sigma_{I(^{3}_{\Lambda}{\rm{H}})} $ as large as 28%, if the two-step process contribution is ignored in the extraction of$ \sigma_{I(^{3}_{\Lambda}{\rm{H}})} $ . Thus this contribution can not be overlooked. Its evaluation and correction will become important for future precise measurements. -
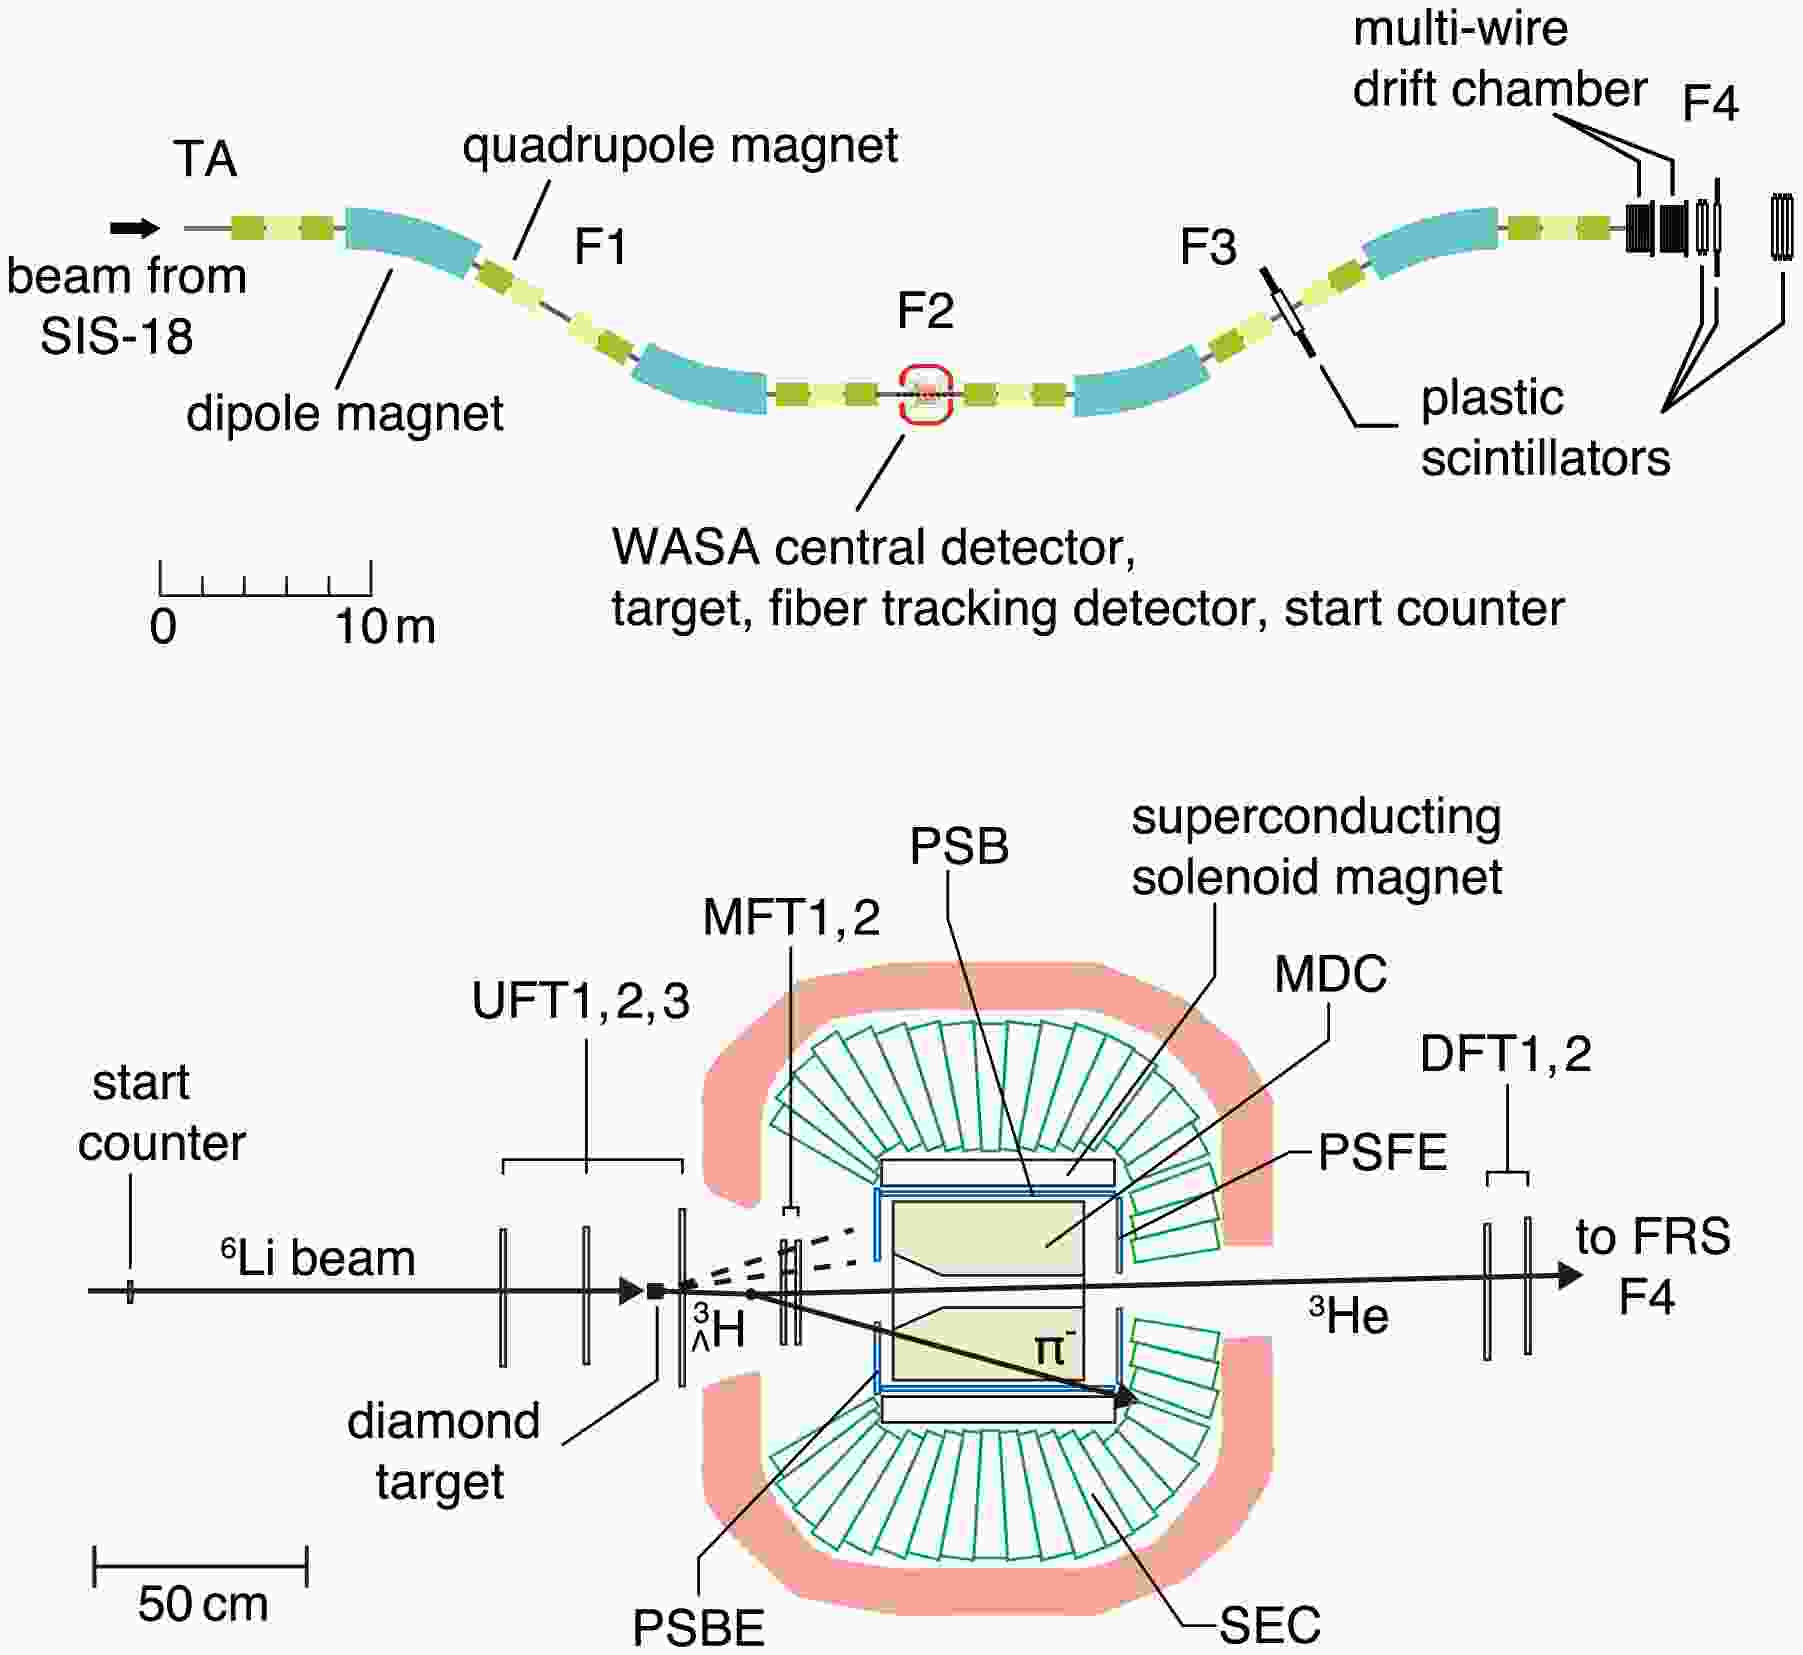
The experiment utilizes the WASA-FRS setup integrating the central part of the Wide Angle Shower Apparatus (WASA) [43] into the Fragment Separator (FRS) at GSI [30]. The general layout is shown in the top panel of Fig. 2. A 6Li beam at a relativistic energy of 2 GeV/u accelerated by the synchrotron SIS-18 is transported to the F2 focal plane of FRS, where a 12C target and the WASA detector system are installed. Light hypernuclei are produced in a projectile fragmentation reaction with the target, and particles emitted from mesonic two-body decay (e.g.,
$ \pi^- $ and 3He from hypertriton) are measured to obtain the invariant-mass and decay vertex distributions. The F2-F4 section of FRS is operated as a high-resolution spectrometer to analyze the momentum of the forward residue (e.g., 3He), while the$ \pi^{-} $ is measured with WASA and additional detectors in F2 with a large solid angle. The lower panel of Fig. 2 shows a detailed configuration at F2 [44] and a typical event topology. The target is placed at the entrance of the WASA detector, which consists of a superconducting solenoid magnet [45], Mini Drift Chamber (MDC) [46], Plastic Scintillator Barrel (PSB) and its end-caps (PSFE, PSBE) [47], and an electromagnetic calorimeter [48]. In addition, a compact start timing counter [49] and sets of tracking detectors based on scintillating fibers with a diameter of 0.5 mm (UFT1–3, MFT1–2, DFT1–2) are installed for the hypernuclear experiment. The upstream detectors UFT1 and UFT2 measure the trajectory of the primary 6Li beam, and the downstream ones DFT1 and DFT2 are used for the forward heavy residue. The track of the decay$ \pi^{-} $ is reconstructed by UFT3, MFT1, and MFT2 in combination with MDC. Furthermore, other charged particles emitted in the primary reaction are recorded by UFT3, MFT1, and MFT2, which provide information on the production vertex position essential for the present investigation. High-granularity of these fiber trackers fullfillthe requirement for reconstructing the production point under high particle rate and multiplicity conditions.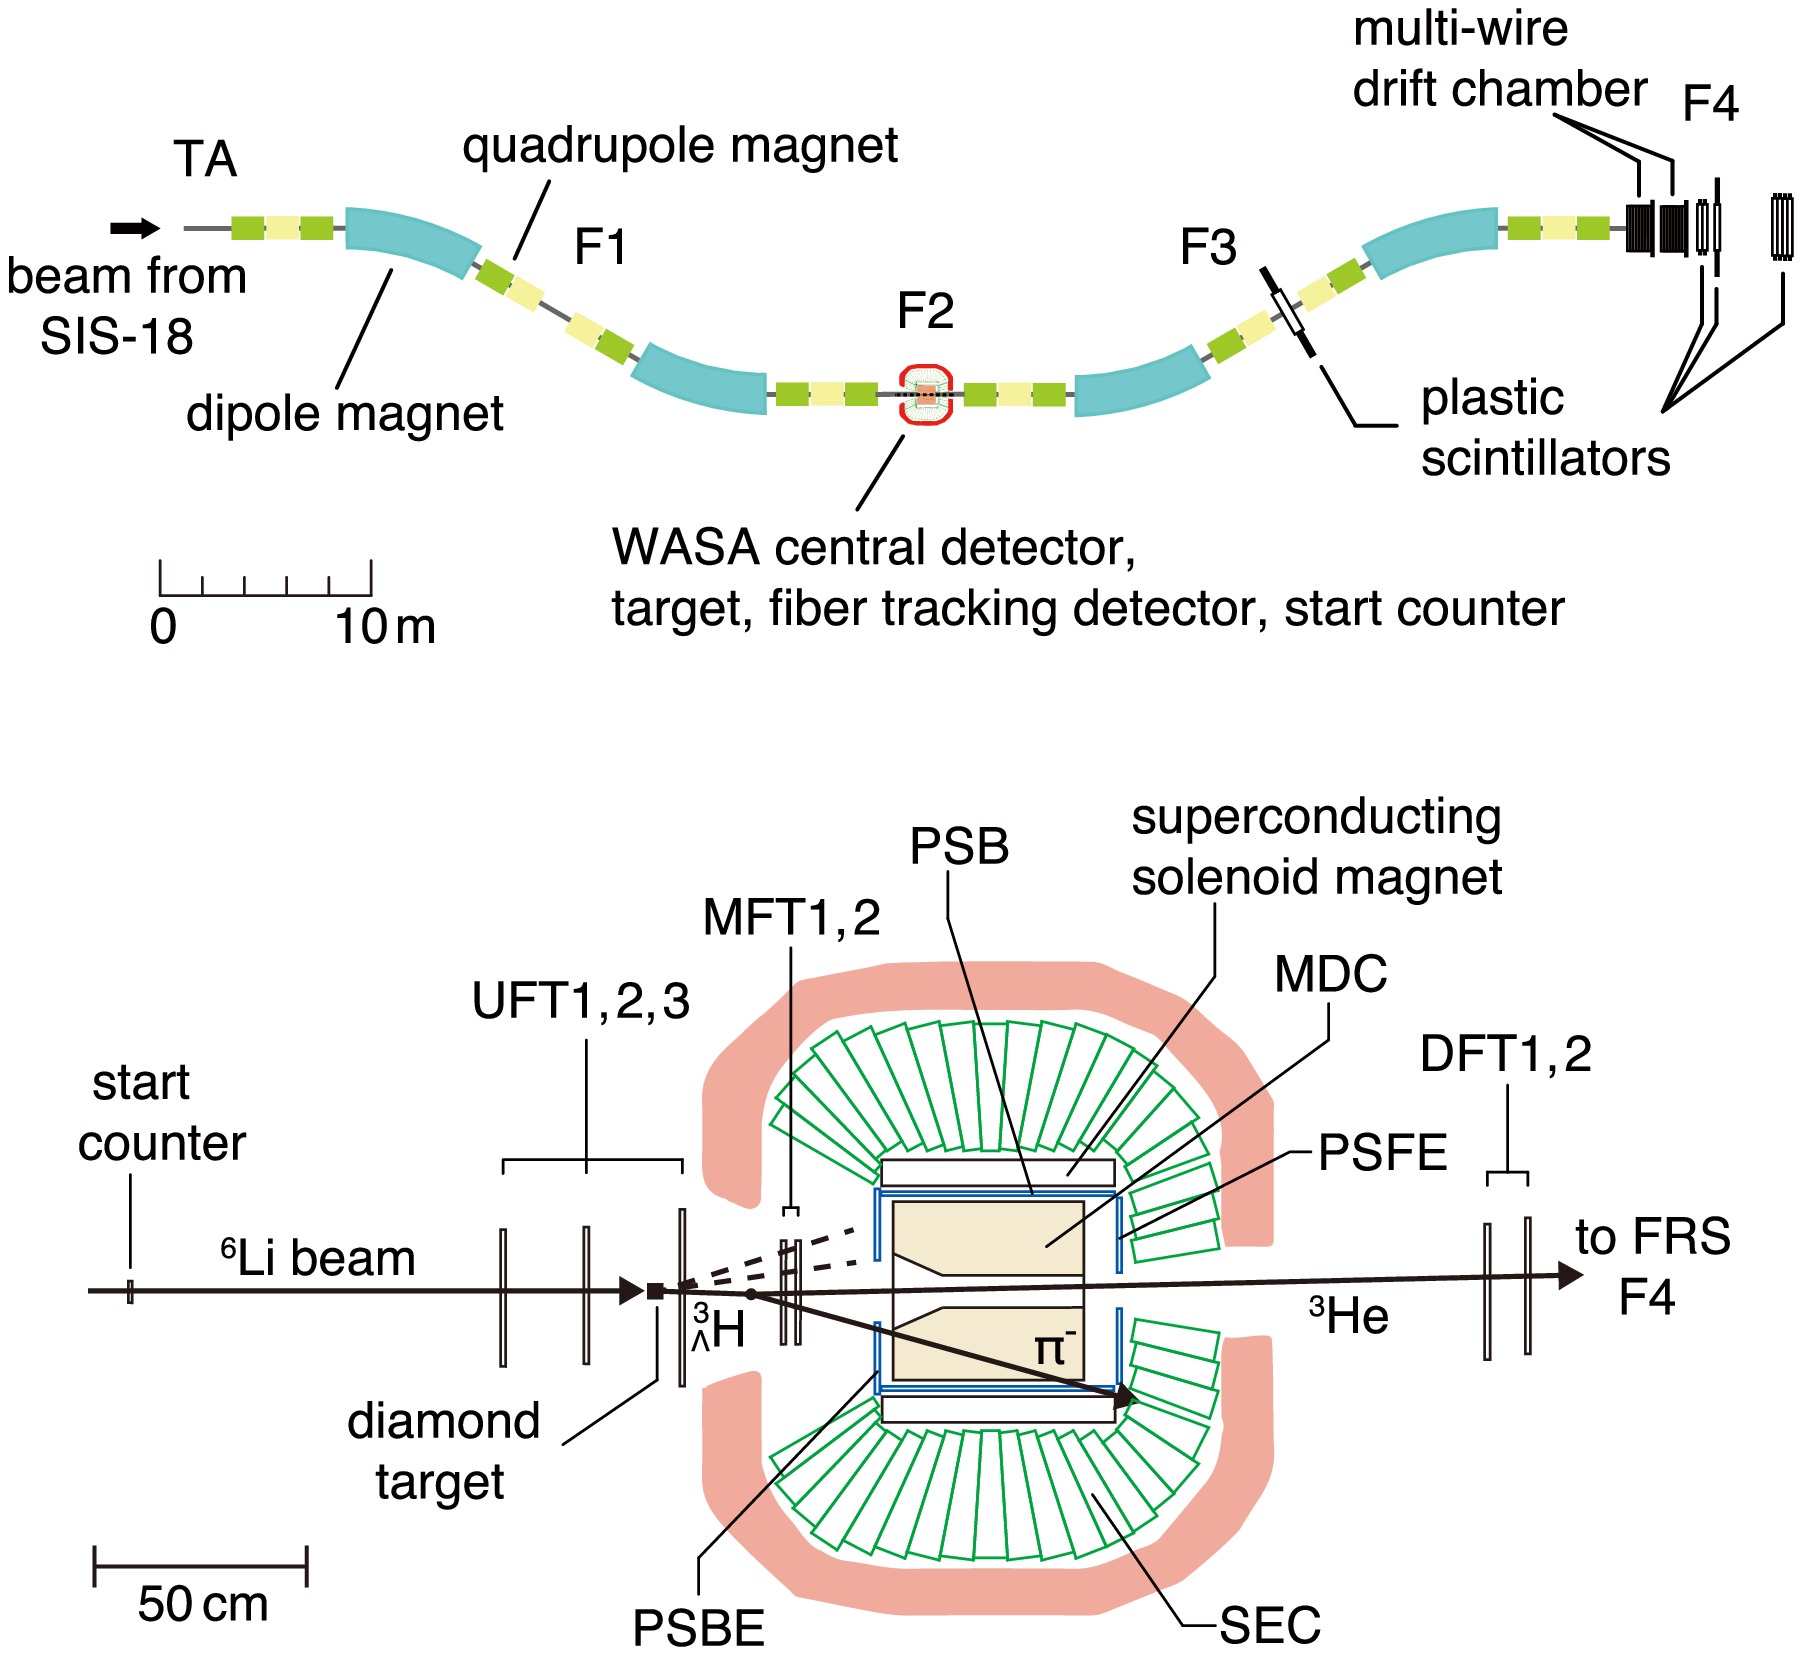
Figure 2. (Top panel) Schematic view of the WASA-FRS experimental setup. The WASA central detectors are integrated into the fragment separator FRS. A beam from the synchrotron SIS-18 impinges on a target at F2. The F2–F4 section of FRS is used to analyze emitted particles at forward 0° which are measured with plastic scintillators at F3 and F4 and with multi-wire drift chambers at F4. (Bottom panel) Detailed view of the experimental setup at F2 for the WASA-FRS hypernuclear experiment. A diamond target, a start timing counter, and scintillating-fiber tracking detectors are installed in addition to the WASA central detector system. A typical event topology of a hypertriton decay into
$ \pi^{-} $ and 3He is also shown. The dashed lines indicate light charged particles emitted from the primary reaction. See the text for details.The first pilot run of the WASA-FRS hypernuclear experiment was performed in 2022 with the goal of precise determination of the lifetime of
$ ^{3}_{\Lambda}{\rm{H}} $ and$ ^{4}_{\Lambda}{\rm{H}} $ and of neutral$ ^{3}_{\Lambda}n $ signals in order to solve puzzles raised by the former experiments [38, 50, 51]. Data for the hypertriton channel were accumulated for about 41 hours with the FRS magnetic rigidity set for 3He. The analysis of the experiment data is currently in progress [44, 52, 53]. -
In order to investigate the feasibility of measuring the production point distribution with the WASA-FRS HypHI experimental setup, we performed Monte Carlo simulations using a Geant4 toolkit [54−56]. Events are generated at different z positions in the target following the distribution defined by Equation (1), where a hypertriton and light charged particles are produced based on a simulation of the 6Li
$ +^{12} $ C reaction at 2A GeV with the UrQMD model and kinematical cuts described in Ref. [57]. The hypertriton is propagated in the target assuming the survival probability given in Equation (2) with$ \sigma_{I}=0.85 $ b, and then its mesonic two-body decay$ ^{3}_{\Lambda}{\rm{H}} \rightarrow \pi^{-} + ^{3}{\rm{He}} $ is simulated.The hypertriton is identified by invariant-mass spectroscopy at the first step of the analysis. The momentum of the
$ \pi^{-} $ is obtained with a resolution in a range of 6–10% by fitting trajectories recorded in MFT1, MFT2, MDC, and PSB or PSFE with a Kalman filter algorithm [58] or by employing a machine learning technique with graph neural network [59]. The 3He momentum is analyzed by the forward spectrometer FRS with a high resolution of about$ 1 \times 10^{-4} $ , operated at a magnetic rigidity of 12.5 Tm. These lead to the invariant-mass resolution of 3.2 MeV/$ c^2 $ [2, 59], which allows us to identify the hypertriton events for subsequent analysis. The above-mentioned UrQMD simulation predicts a kinetic-energy of$ 5.93\pm0.29 $ GeV within one standard deviation for the produced projectile-like hypertritons, and$ 5.67\pm0.16 $ GeV for the hypertritions identified via coincident detection of$ \pi^{-} $ and 3He by WASA and FRS, respectively, based on Geant4 and ion-optical transport [60] simulations. Furthermore, we select events with a decay vertex position more than 4 cm behind the target, as in the experimental analysis.Next, the production point of
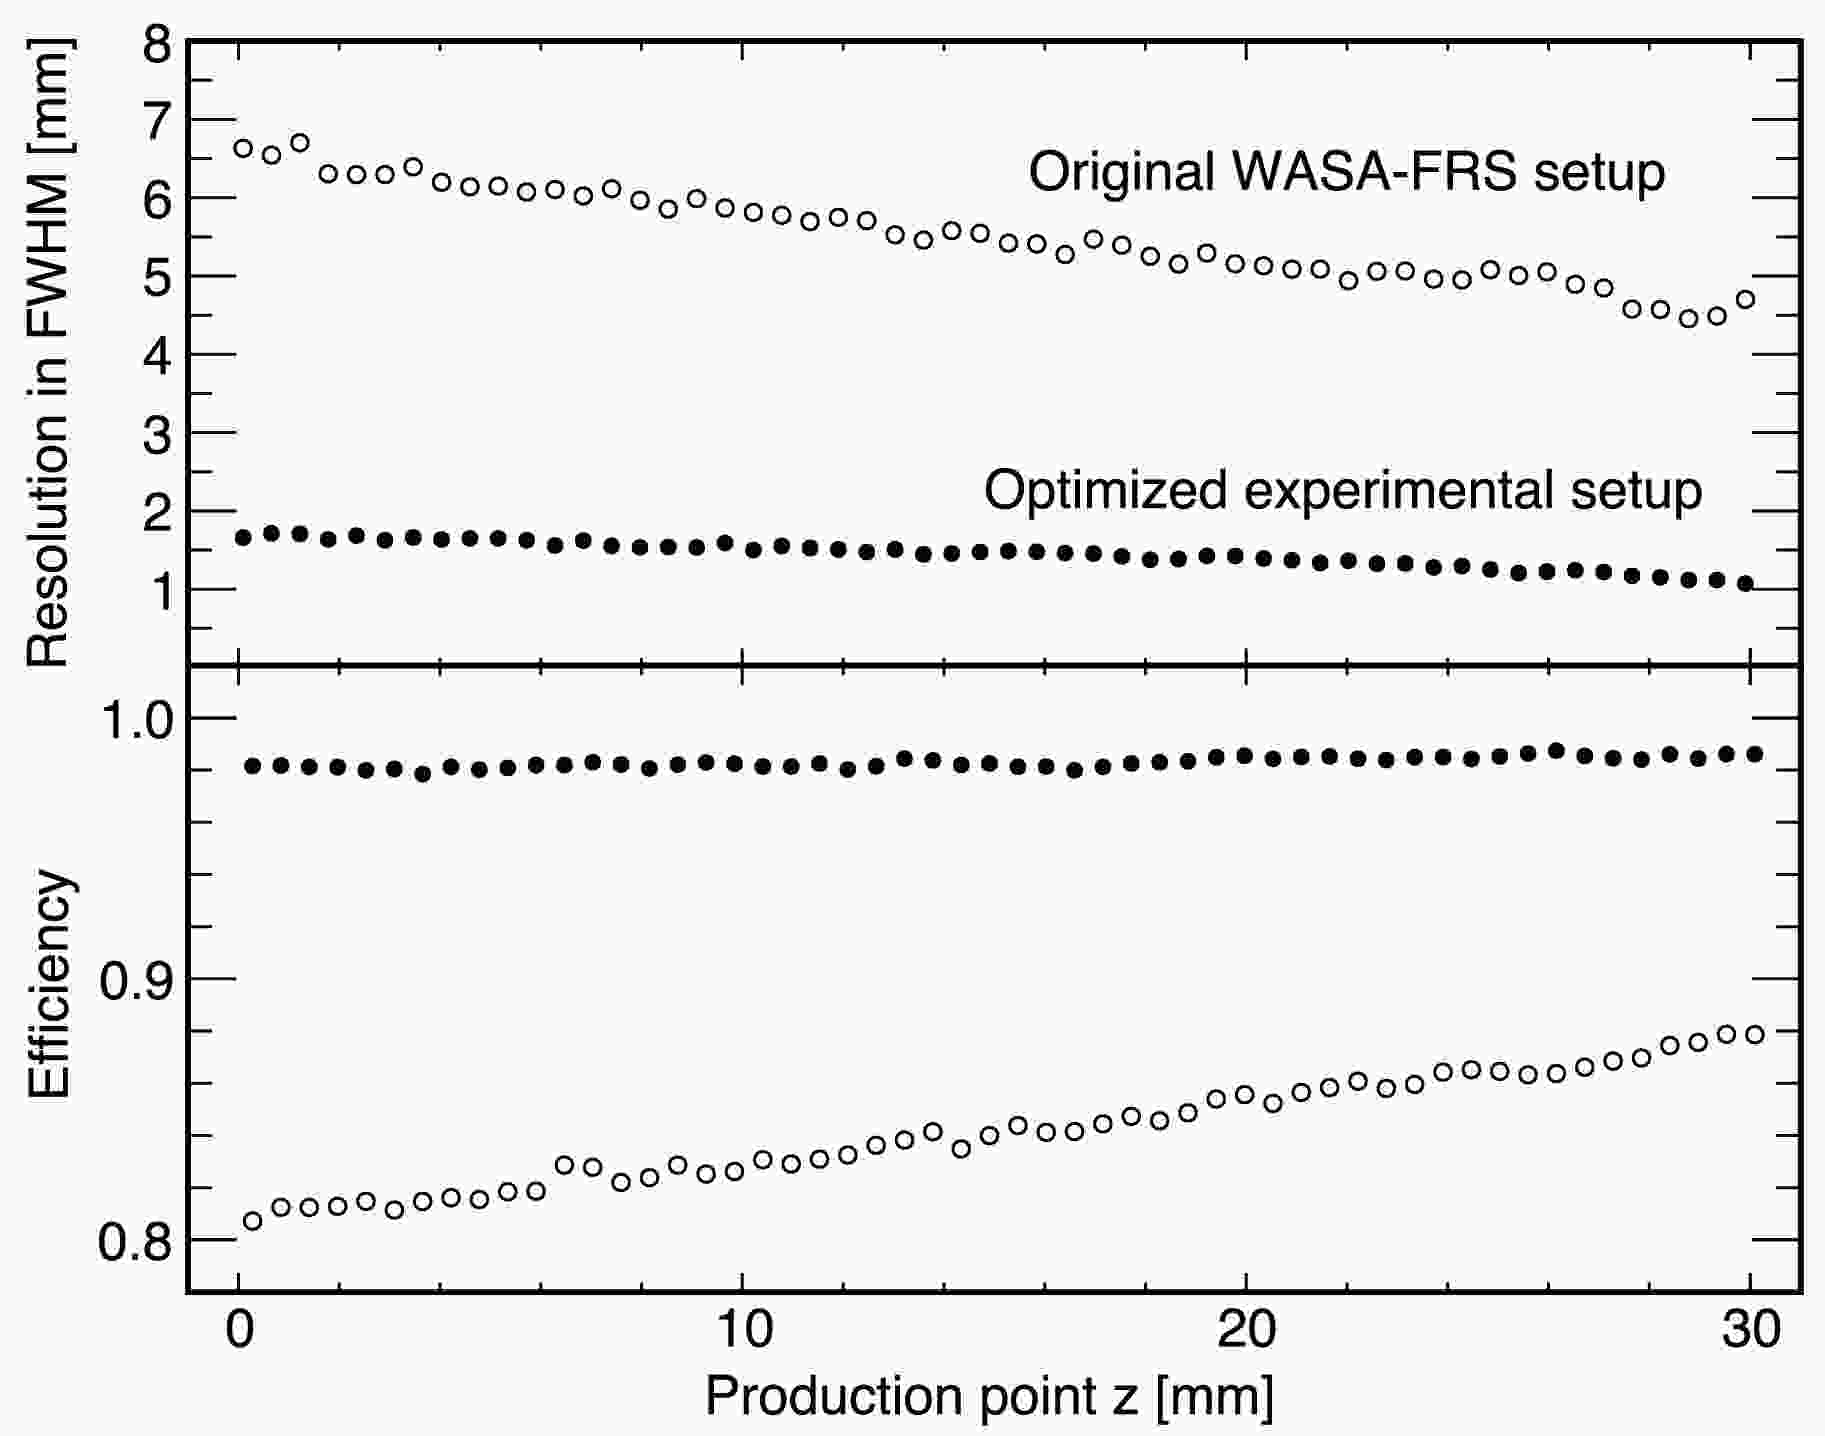
$ {}^{3}_{\Lambda}{\rm{H}} $ is analyzed by using the trajectories of the primary 6Li and the produced light charged particles in the reaction except for$ {}^{3}_{\Lambda}{\rm{H}} $ and its decay particles. The$ {}^{6}{\rm{Li}} $ track is reconstructed from hits recorded in the upstream tracking detectors UFT1 and UFT2, while the tracks of the light particles are obtained by UFT-3, MFT-1, and MFT-2. We eliminated the light particles with number of hitted fiber layers less than 5 to enhance the z resolution of the production point. A topological vertex reconstruction algorithm [61] is employed to determine the production vertex from the adopted trajectories and their covariance matrices.The resolution and efficiency of the production point reconstruction are evaluated to characterize the analysis performance. We observe the residual distribution of the production point z, which is defined by a difference between a true production point z and reconstructed one, has a shape with a long tail structure that can be fitted by a Cauchy function. The top panel in Fig. 3 shows the obtained z resolution defined by its full width at half maximum as a function of the z coordinate. The resolution varies from 6 mm to 4 mm depending on the z position in the target. As displayed in the bottom panel, a z-dependent trend is found also for the efficiency of the production point reconstruction, which is defined as the probability of reconstructing the production point, under the condition that the hypertriton was identified through the detection of 3He and
$ \pi^{-} $ . Such z dependence is explained by interactions of the produced light particles within the target and geometrical acceptance.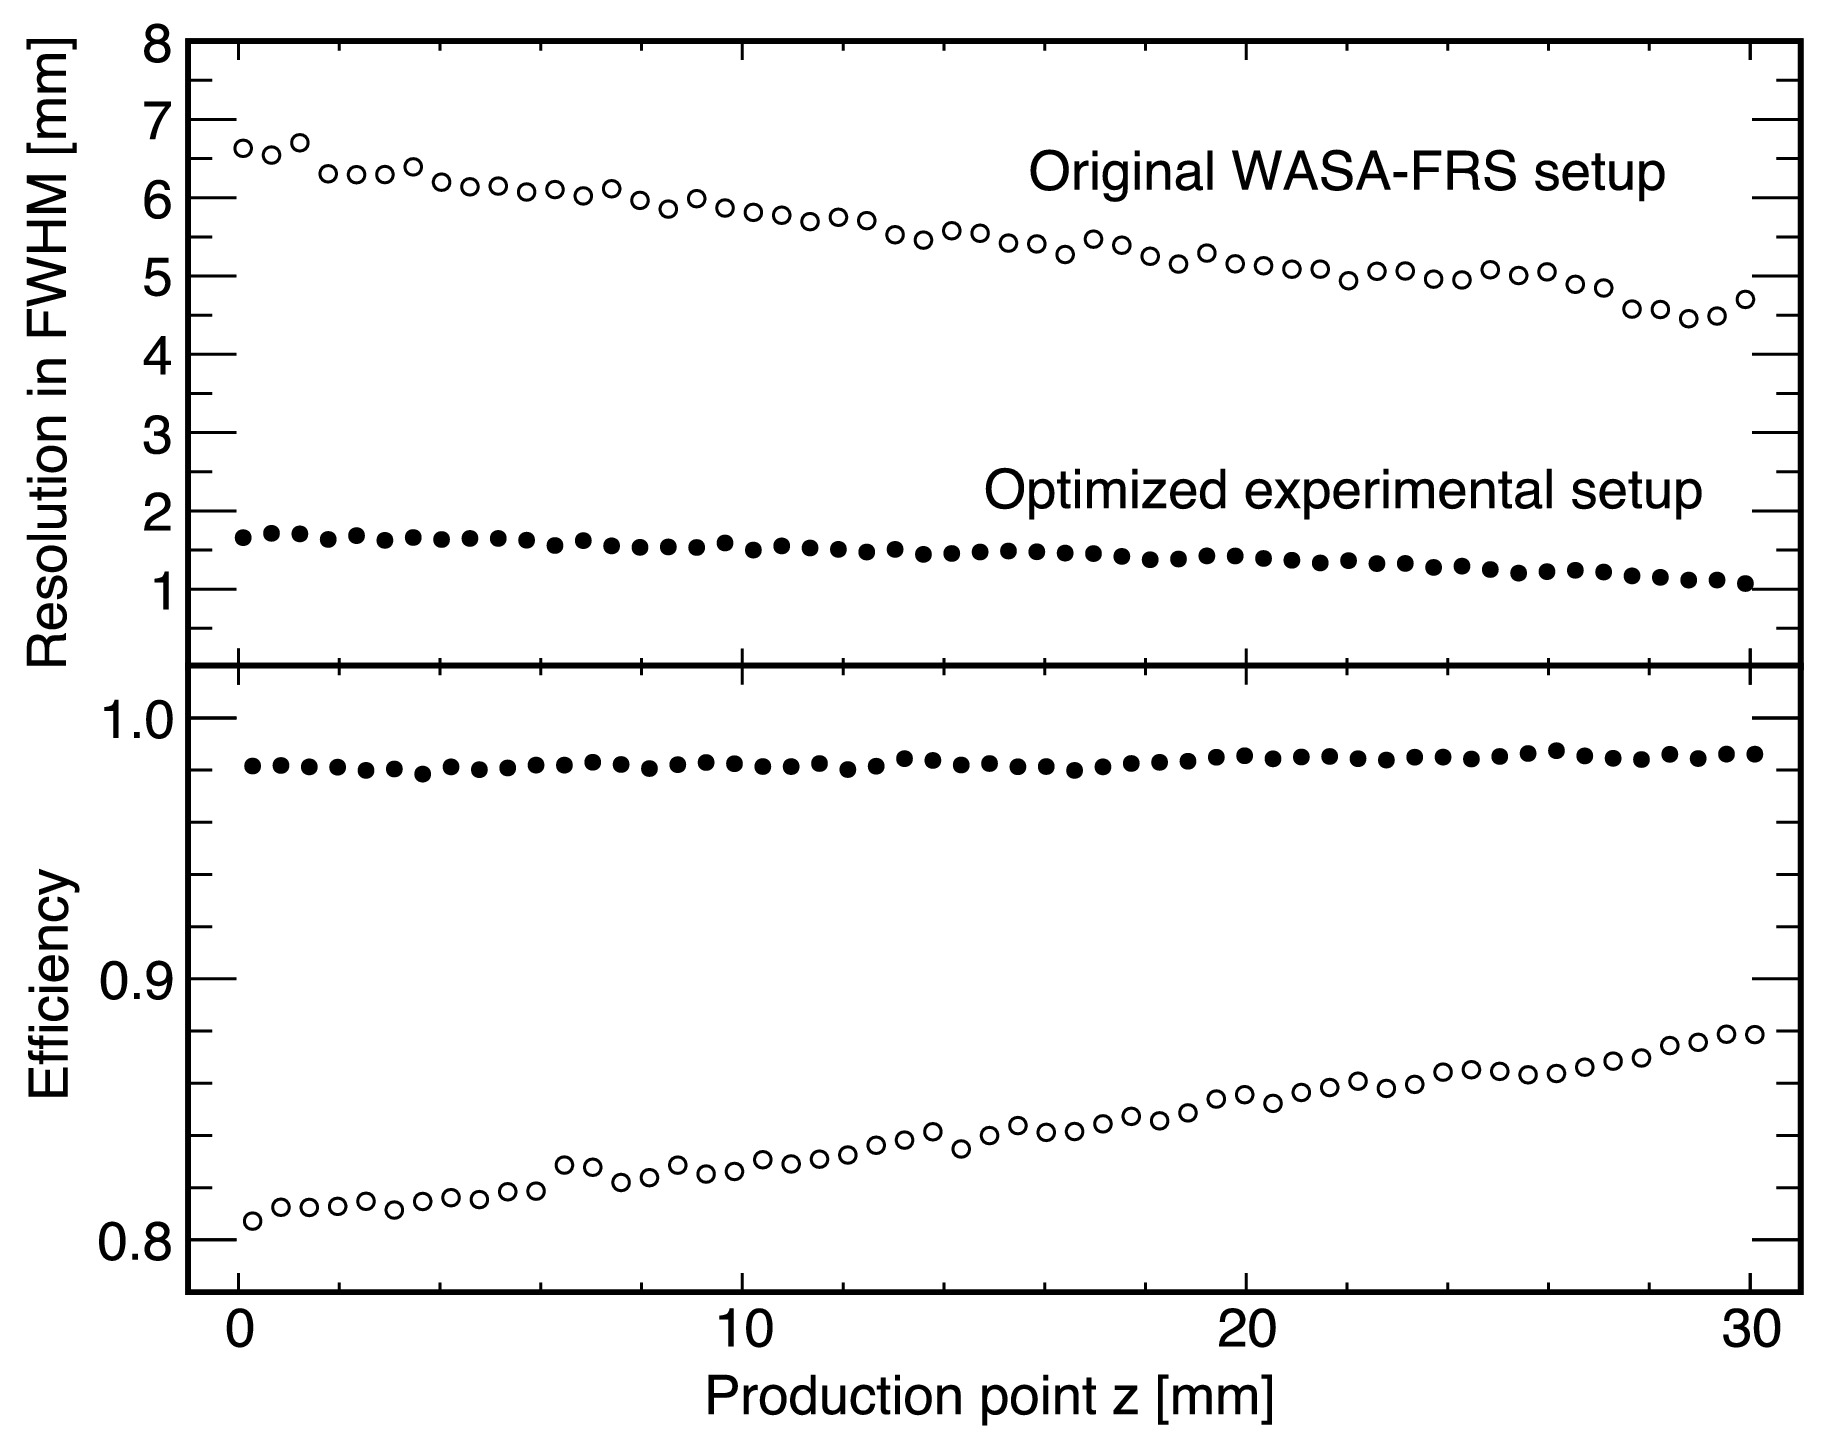
Figure 3. (Top panel) Evaluated resolution for reconstructing the production point as a function of the production point z, based on Monte Carlo simulations. (Bottom panel) Evaluated efficiency of production point reconstruction as a function of the production point z. Open and closed circles represent results obtained with the original WASA-FRS setup (Section IV A) and the optimized setup (Section IV B), respectively.
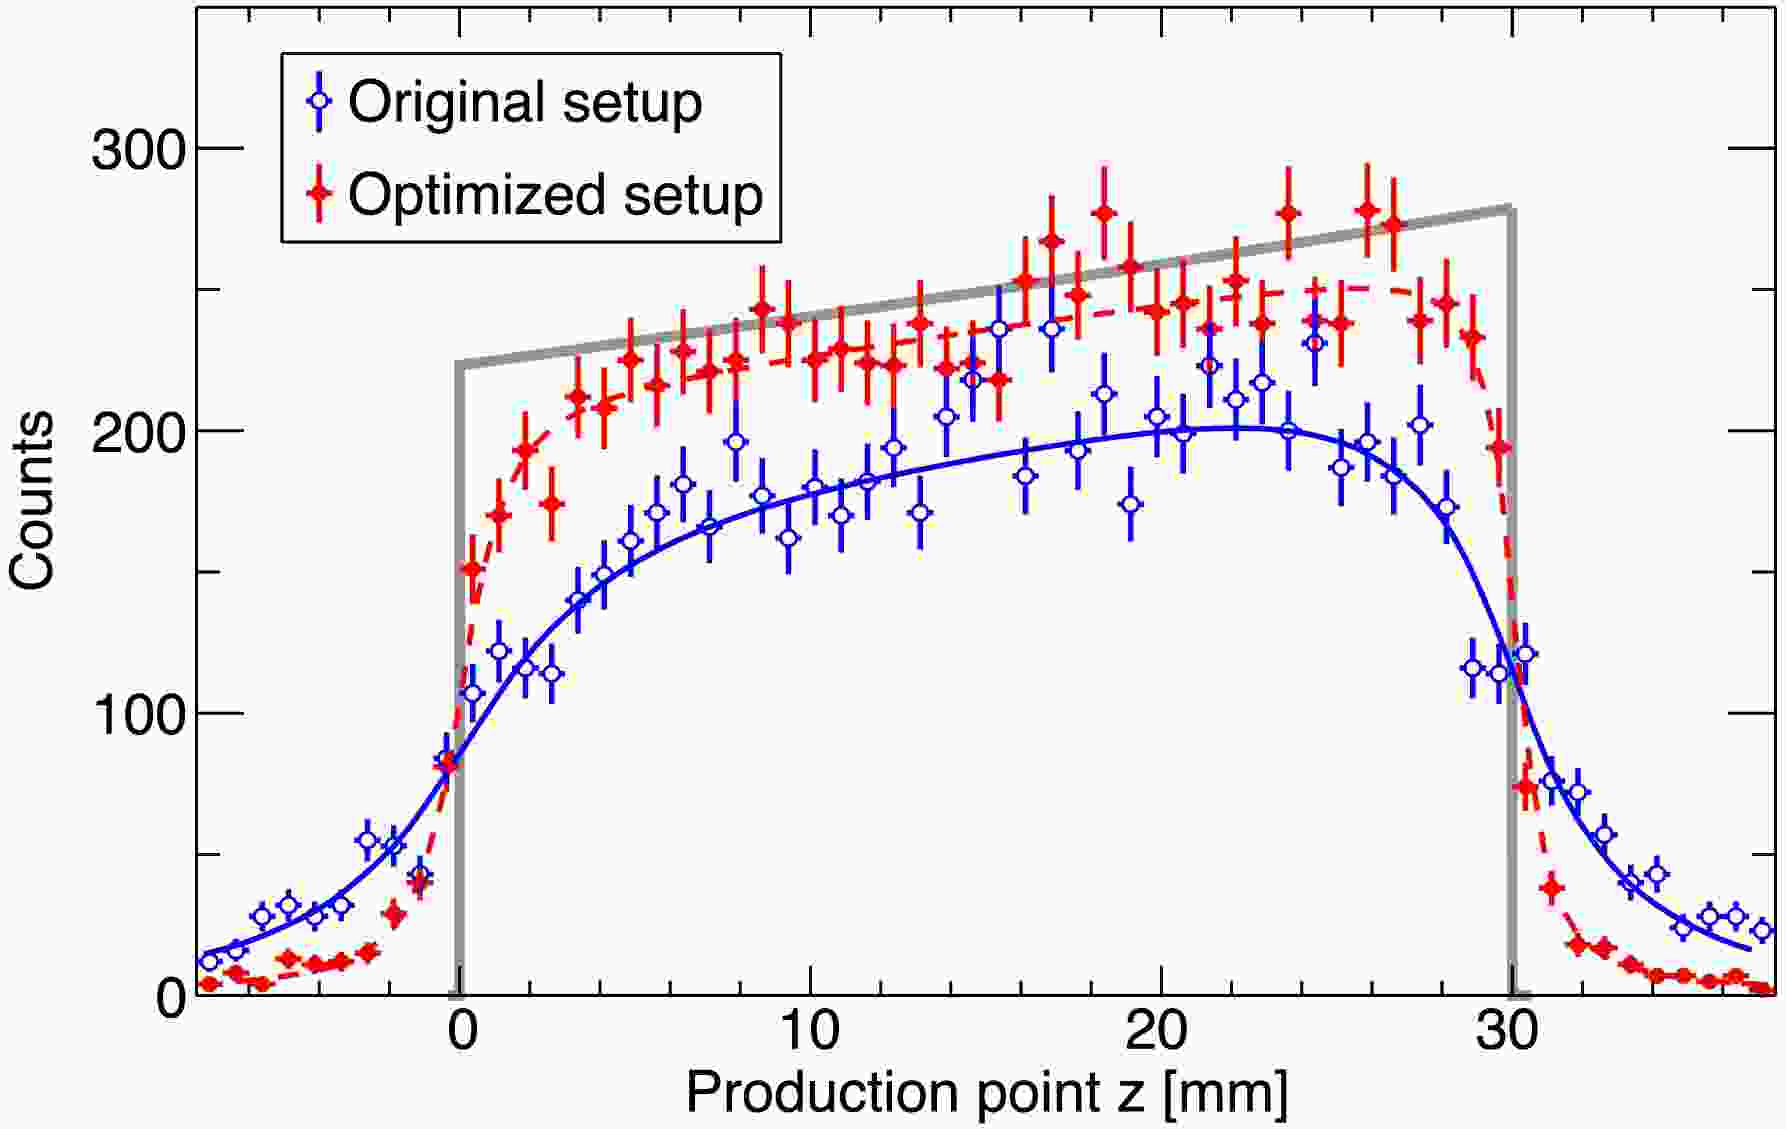
Reconstructed production point distribution with the simulated data is presented by the blue line in Fig. 4 for a total number of
$ 10^4 $ hypertriton-identified events. The distribution exhibits a similar slope to the true curve, shown by the black line, assumed in the simulation, but its detailed shape is modified due to the z-dependent resolution and efficiency. Therefore, the distribution needs to be fitted by the exponential function in Equation (3) convoluted with the z-dependent resolution and scaled by the z-dependent efficiency curve, as evaluated in Fig. 3. The value of the interaction cross section thus fitted is$ \sigma_{I(^{3}_{\Lambda}{\rm{H}})} = 0.860 \pm 0.092 $ b, which is consistent with the input value of 0.85 b in the simulation. This demonstrates that a statistical uncertainty of 10% can be achieved with$ \sim 10^4 $ hypertriton events, which is feasible in a realistic amount of beam time, assuming the same experimental condition as considered in Ref. [2].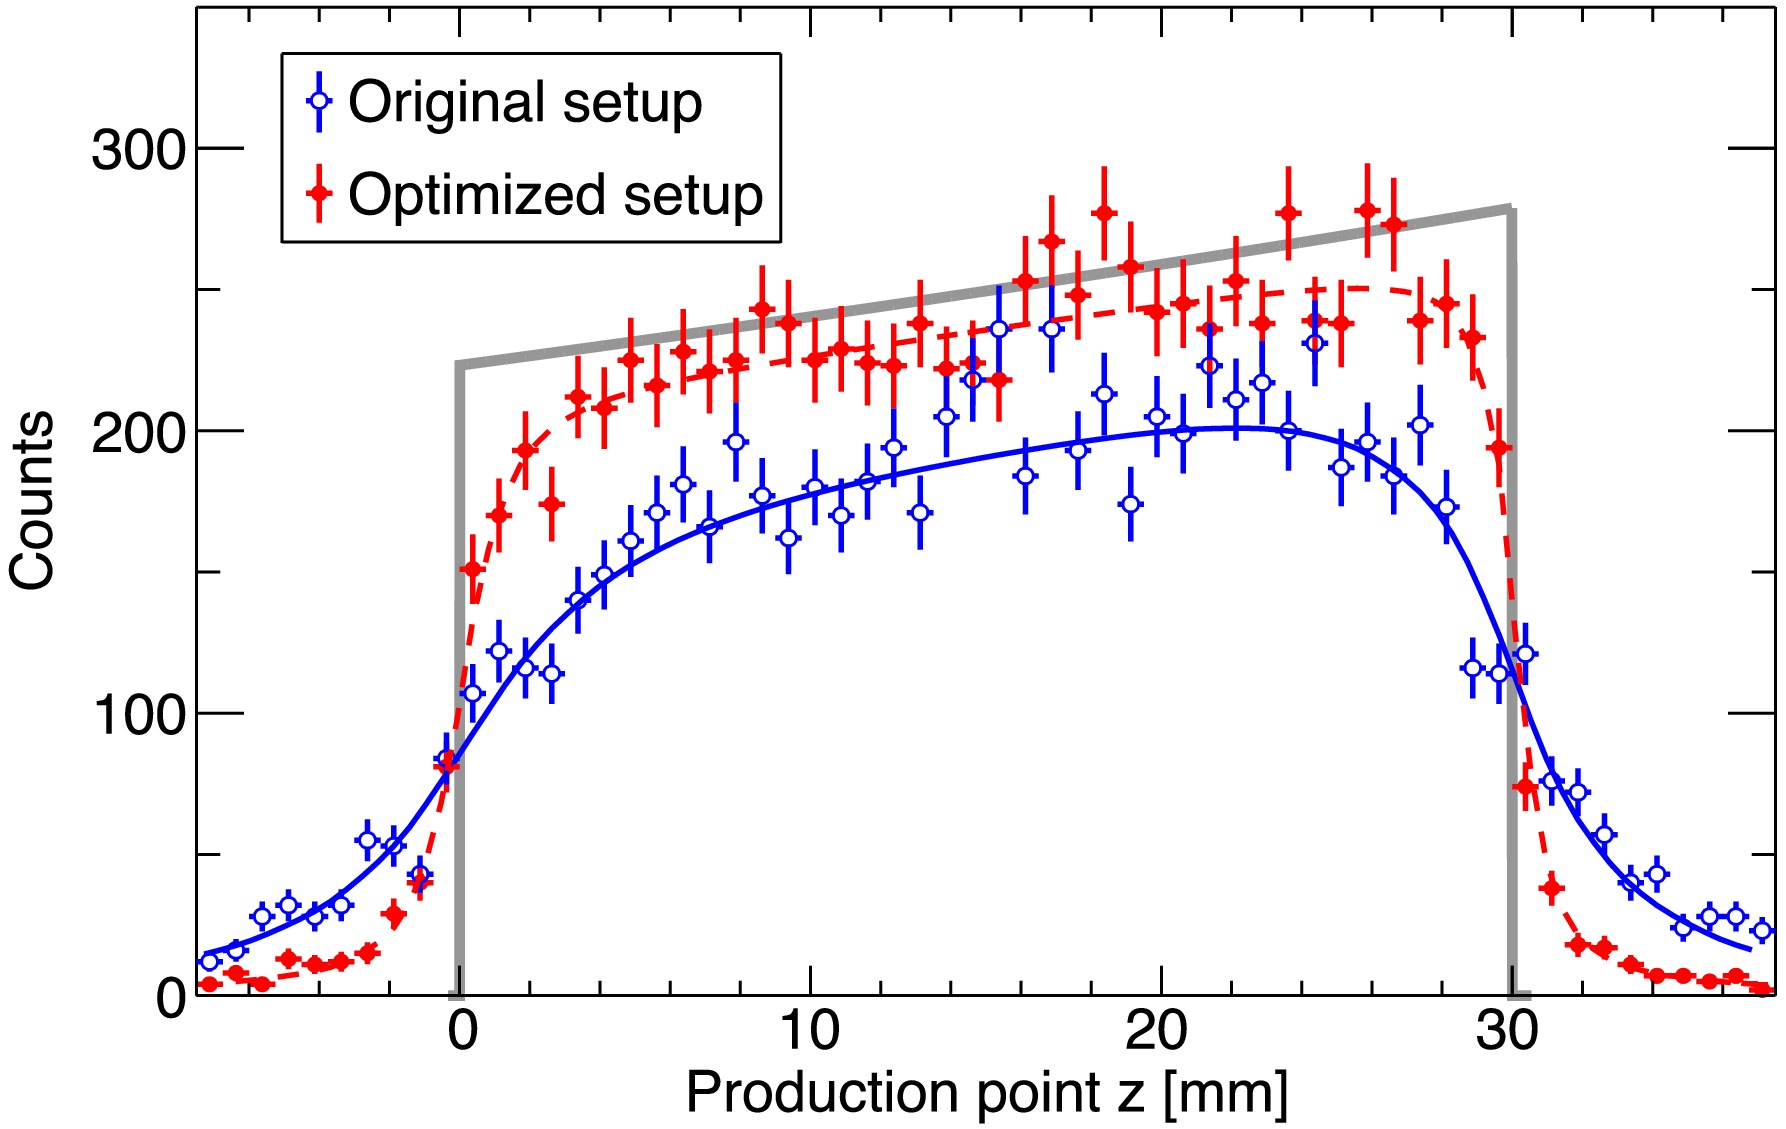
Figure 4. The PPD histogram: The black filled histogram represents the input PPD of this simulation. The blue filled histogram depicts the PPD measured with the original WASA-FRS HypHI setup, where beam product tracks are reconstructed by UFT3, MFT1, and MFT2, and the production point is identified using the vertex finding algorithm. The red filled histogram represents the PPD measured with a pair of larger UFT3 (UFT3 and UFT4) using the same analysis procedure.
-
The above analysis with the existing WASA-FRS HypHI setup, however, relies on the evaluation of the z-dependent resolution and efficiency based on the Monte Carlo simulations. In fact, neglecting the z-dependence in the fitting results in the interaction cross section overestimated by 38%. Thus, this would introduce an additional systematic uncertainty in a real experimental case. To address this issue, we discuss an improved setup optimized for the present purpose.
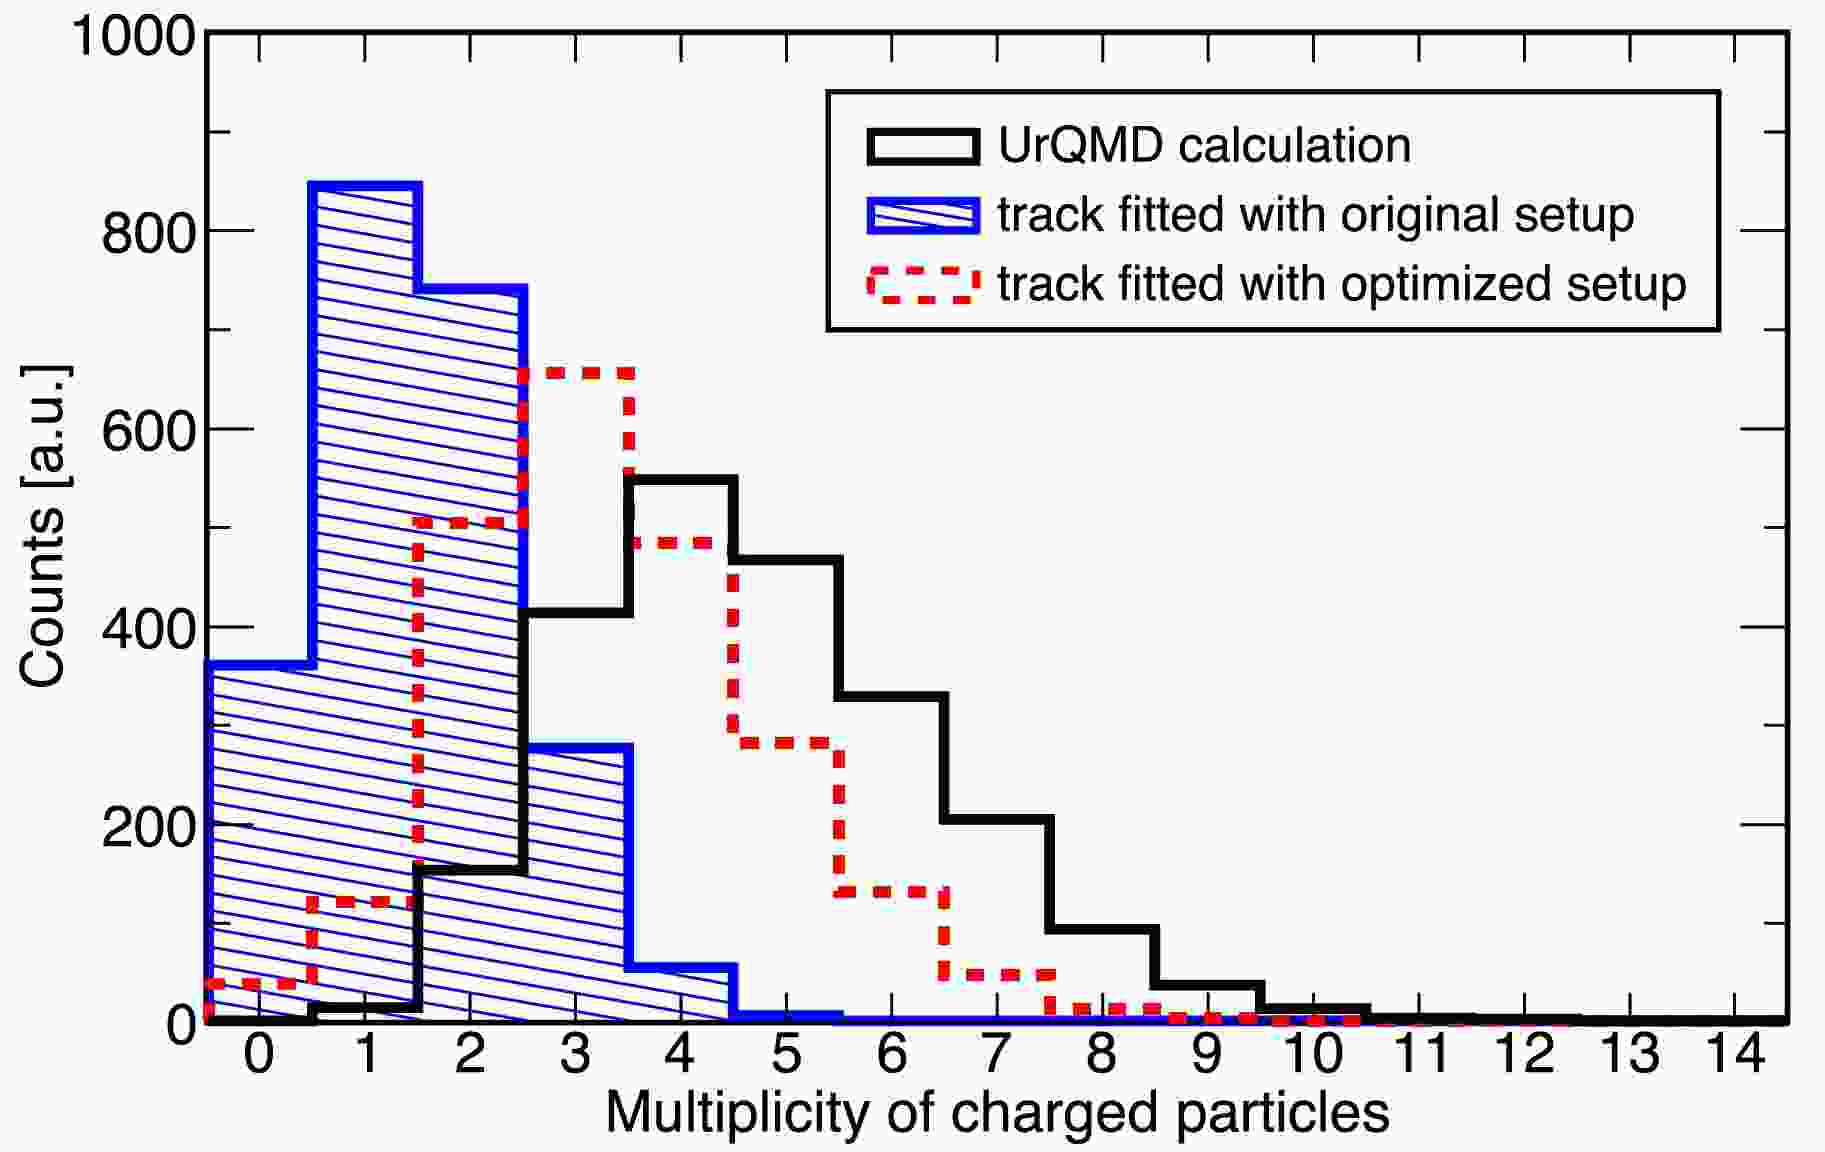
Here, we propose to implement two modifications: (i) to use a reaction target with smaller transverse dimensions and (ii) to install an additional large tracking detector behind UFT3. The former is to minimize scattering of the forward emitted light particles within the target, while the latter extends the angular acceptance for measuring these particles. Thus, both modifications contribute to increasing the number of available particles reaching sufficient layers of the tracking detectors and available for production vertex analysis, as observed in Fig. 5. As an experimental setup, we consider a cylindrical target with a diameter of 10 mm and a twice larger scintillating fiber detector than UFT3, denoted by UFT4, for further evaluation.
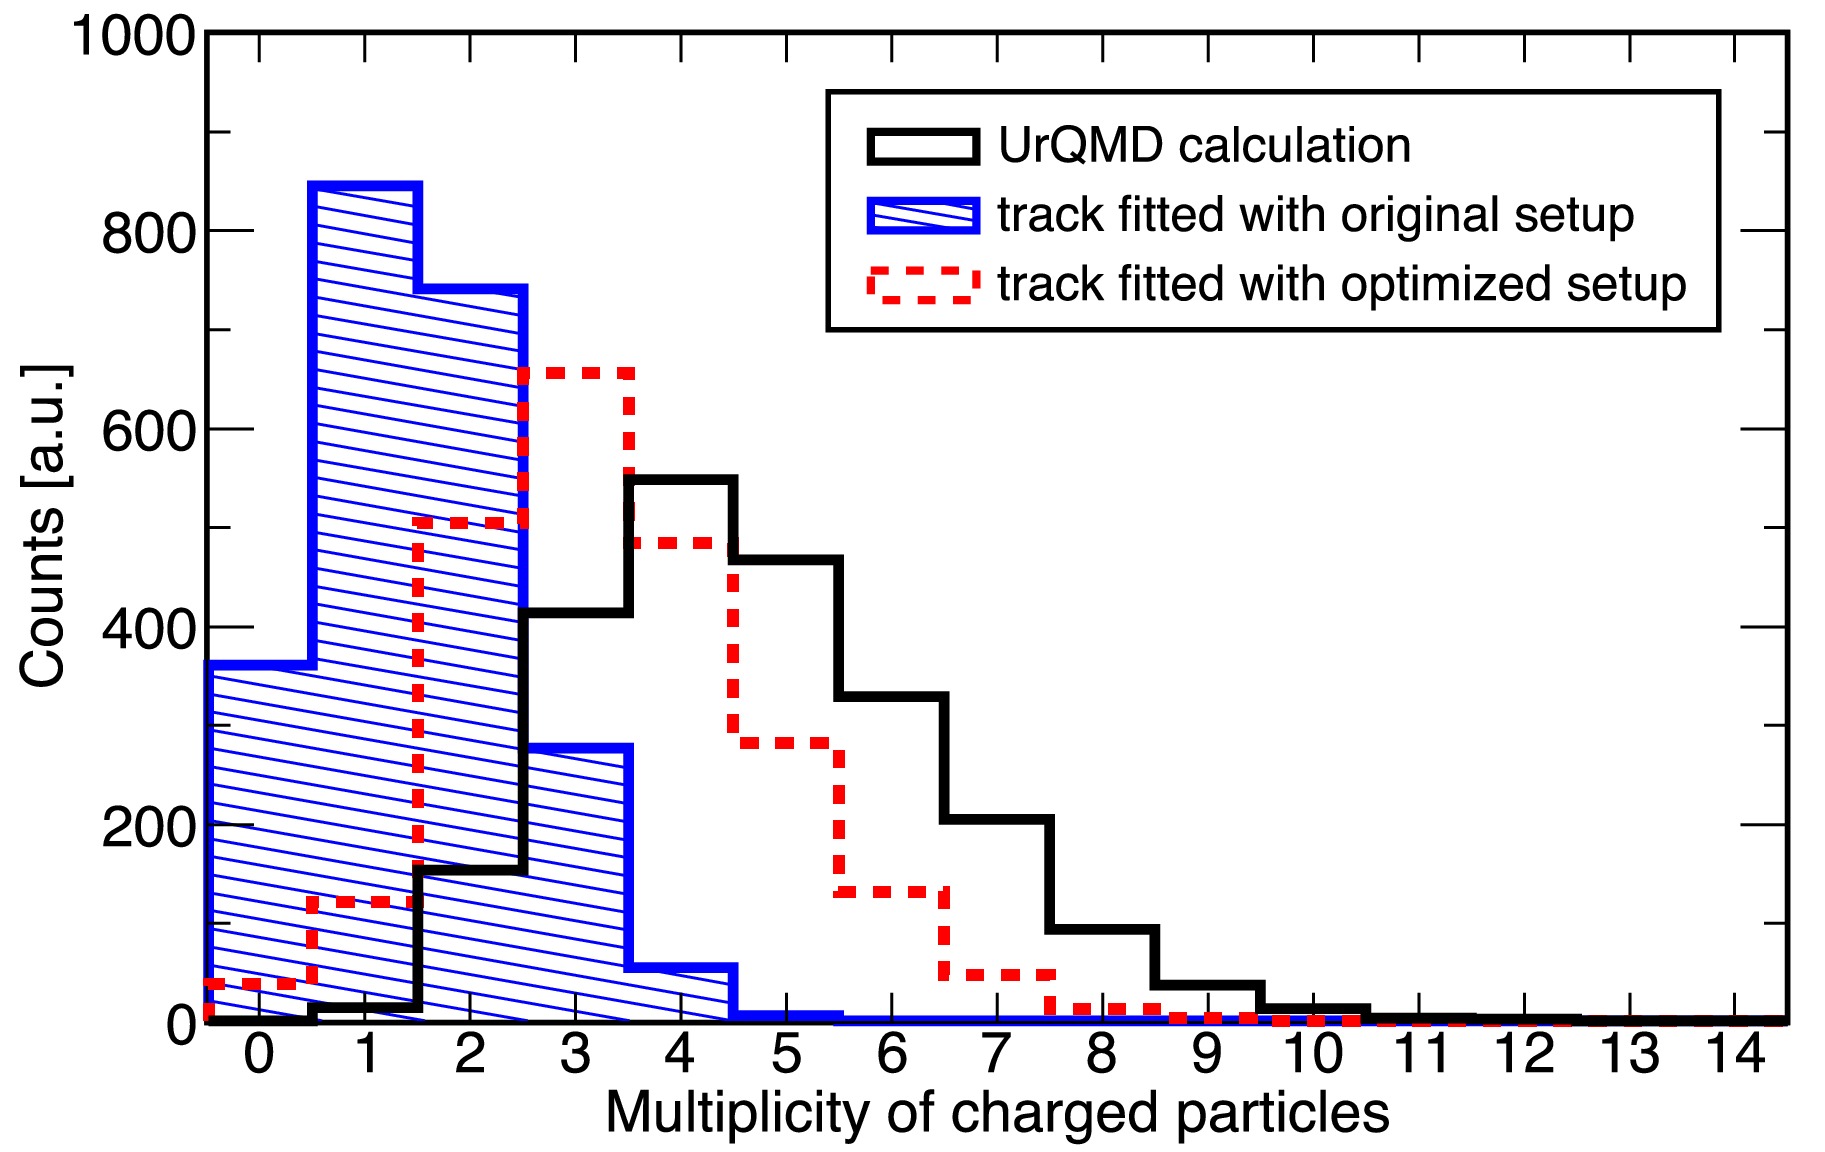
Figure 5. Multiplicity of light charged particles (proton,
$ \pi^{\pm} $ ,$ K^{+} $ ) emitted from the primary$ {}^{6}{\rm{Li}}+^{12}{\rm{C}} $ interactions in hypertriton production events. The hypertriton and its decay products are excluded from the multiplicity count. The black histogram includes all particles generated by the UrQMD calculation. The blue and red histograms represent the multiplicity of particles reaching sufficient layers of the fiber detectors for track fitting in the original WASA-FRS setup (Section IV A) and the optimized setup (Section IV B), respectively.Expected performance of the production point reconstruction with the modified setup is summarized in Table 1. We tested different values for the distance d between the middle points of UFT3 and UFT4 from 0 cm to 15 cm. We adopt the case with
$ d=5 $ cm and with the smaller target, which yields the highest gains in terms of resolution and efficiency. The solid black points in Fig. 3 display the improved resolution and efficiency as a function of the z coordinate for the adopted case.UFT4 Target Resolution [mm] Efficiency mean difference mean difference no UFT4 original 5.51 −1.94 0.841 0.070 at d = 0 cm original 2.49 −2.13 0.981 0.011 at d = 5 cm original 1.67 −1.14 0.982 0.010 at d = 10 cm original 1.70 −1.17 0.980 0.012 at d = 15 cm original 1.81 −1.20 0.979 0.014 at d = 5 cm small 1.44 −0.59 0.983 0.006 Table 1. Evaluated resolution and efficiency for reconstructing the production point z for different experimental configurations. Mean values represent averaged value in the z region of interest (0 mm
$ \leqslant z \leqslant 30 $ mm), while differences represent changes of the values from$ z=0 $ mm to$ z=30 $ mm.The reconstructed production point distribution obtained with the optimized setup is shown by the red histogram in Fig. 4. The distribution exhibits clear improvements in both resolution and efficiency; the edge of the distribution becomes sharper, and the number of events with reconstructed production points within the target region is increased by 21%. The red dashed curve shows the fit results,yielding
$ \sigma_{I(^{3}_{\Lambda}{\rm{H}})} = 0.818 \pm 0.076 $ b. As the resolution and efficiency show less dependence on the z-position, the systematic uncertainty in the estimation of the interaction cross section arising from their evaluation can be significantly reduced. -
In summary, the feasibility of a novel approach to measure the interaction cross section of
$ {}^{3}_{\Lambda}{\rm{H}} $ , utilizing the WASA-FRS experimental setup at GSI and FAIR, has been explored. In addition to the settings modified in this article, there is also development of a silicon micro-vertex detection system for this purpose of having good primary vertex measurement in Ref. [62]. Investigations based on detailed Monte Carlo simulations have demonstrated that the interaction cross section can be determined with an uncertainty on the order of 10% by reconstructing the production point distribution within the production target. These results highlight the potential of this method as a new tool for studying matter radii and exploring possible hyperon halo structures in hypernuclei.
Feasibility study of measuring interaction cross sections of hypernuclei produced in projectile fragmentation reactions with WASA-FRS setup
- Received Date: 2025-06-30
- Available Online: 2026-07-01
Abstract: A novel method is proposed to measure interaction cross sections of short-lived hypernuclei with the WASA-FRS experimental setup at GSI and FAIR. The interaction cross sections of hypernuclei, produced in projectile fragmentation reactions at relativistic energies, can be determined from their production point distribution within a target. The feasibility of such a measurement is evaluated through detailed Monte Carlo simulations. The results indicate that an aimed uncertainty on the order of 10% can be achieved for a case of hypertriton, demonstrating the potential of this method as a new tool for studying matter radii and possible hyperon halo structure of hypernuclei.


 Abstract
 HTML
HTML Reference
 Related
 PDF
PDF


 DownLoad:
