


 Abstract
 HTML
HTML Reference
 Related
 PDF
PDF


-
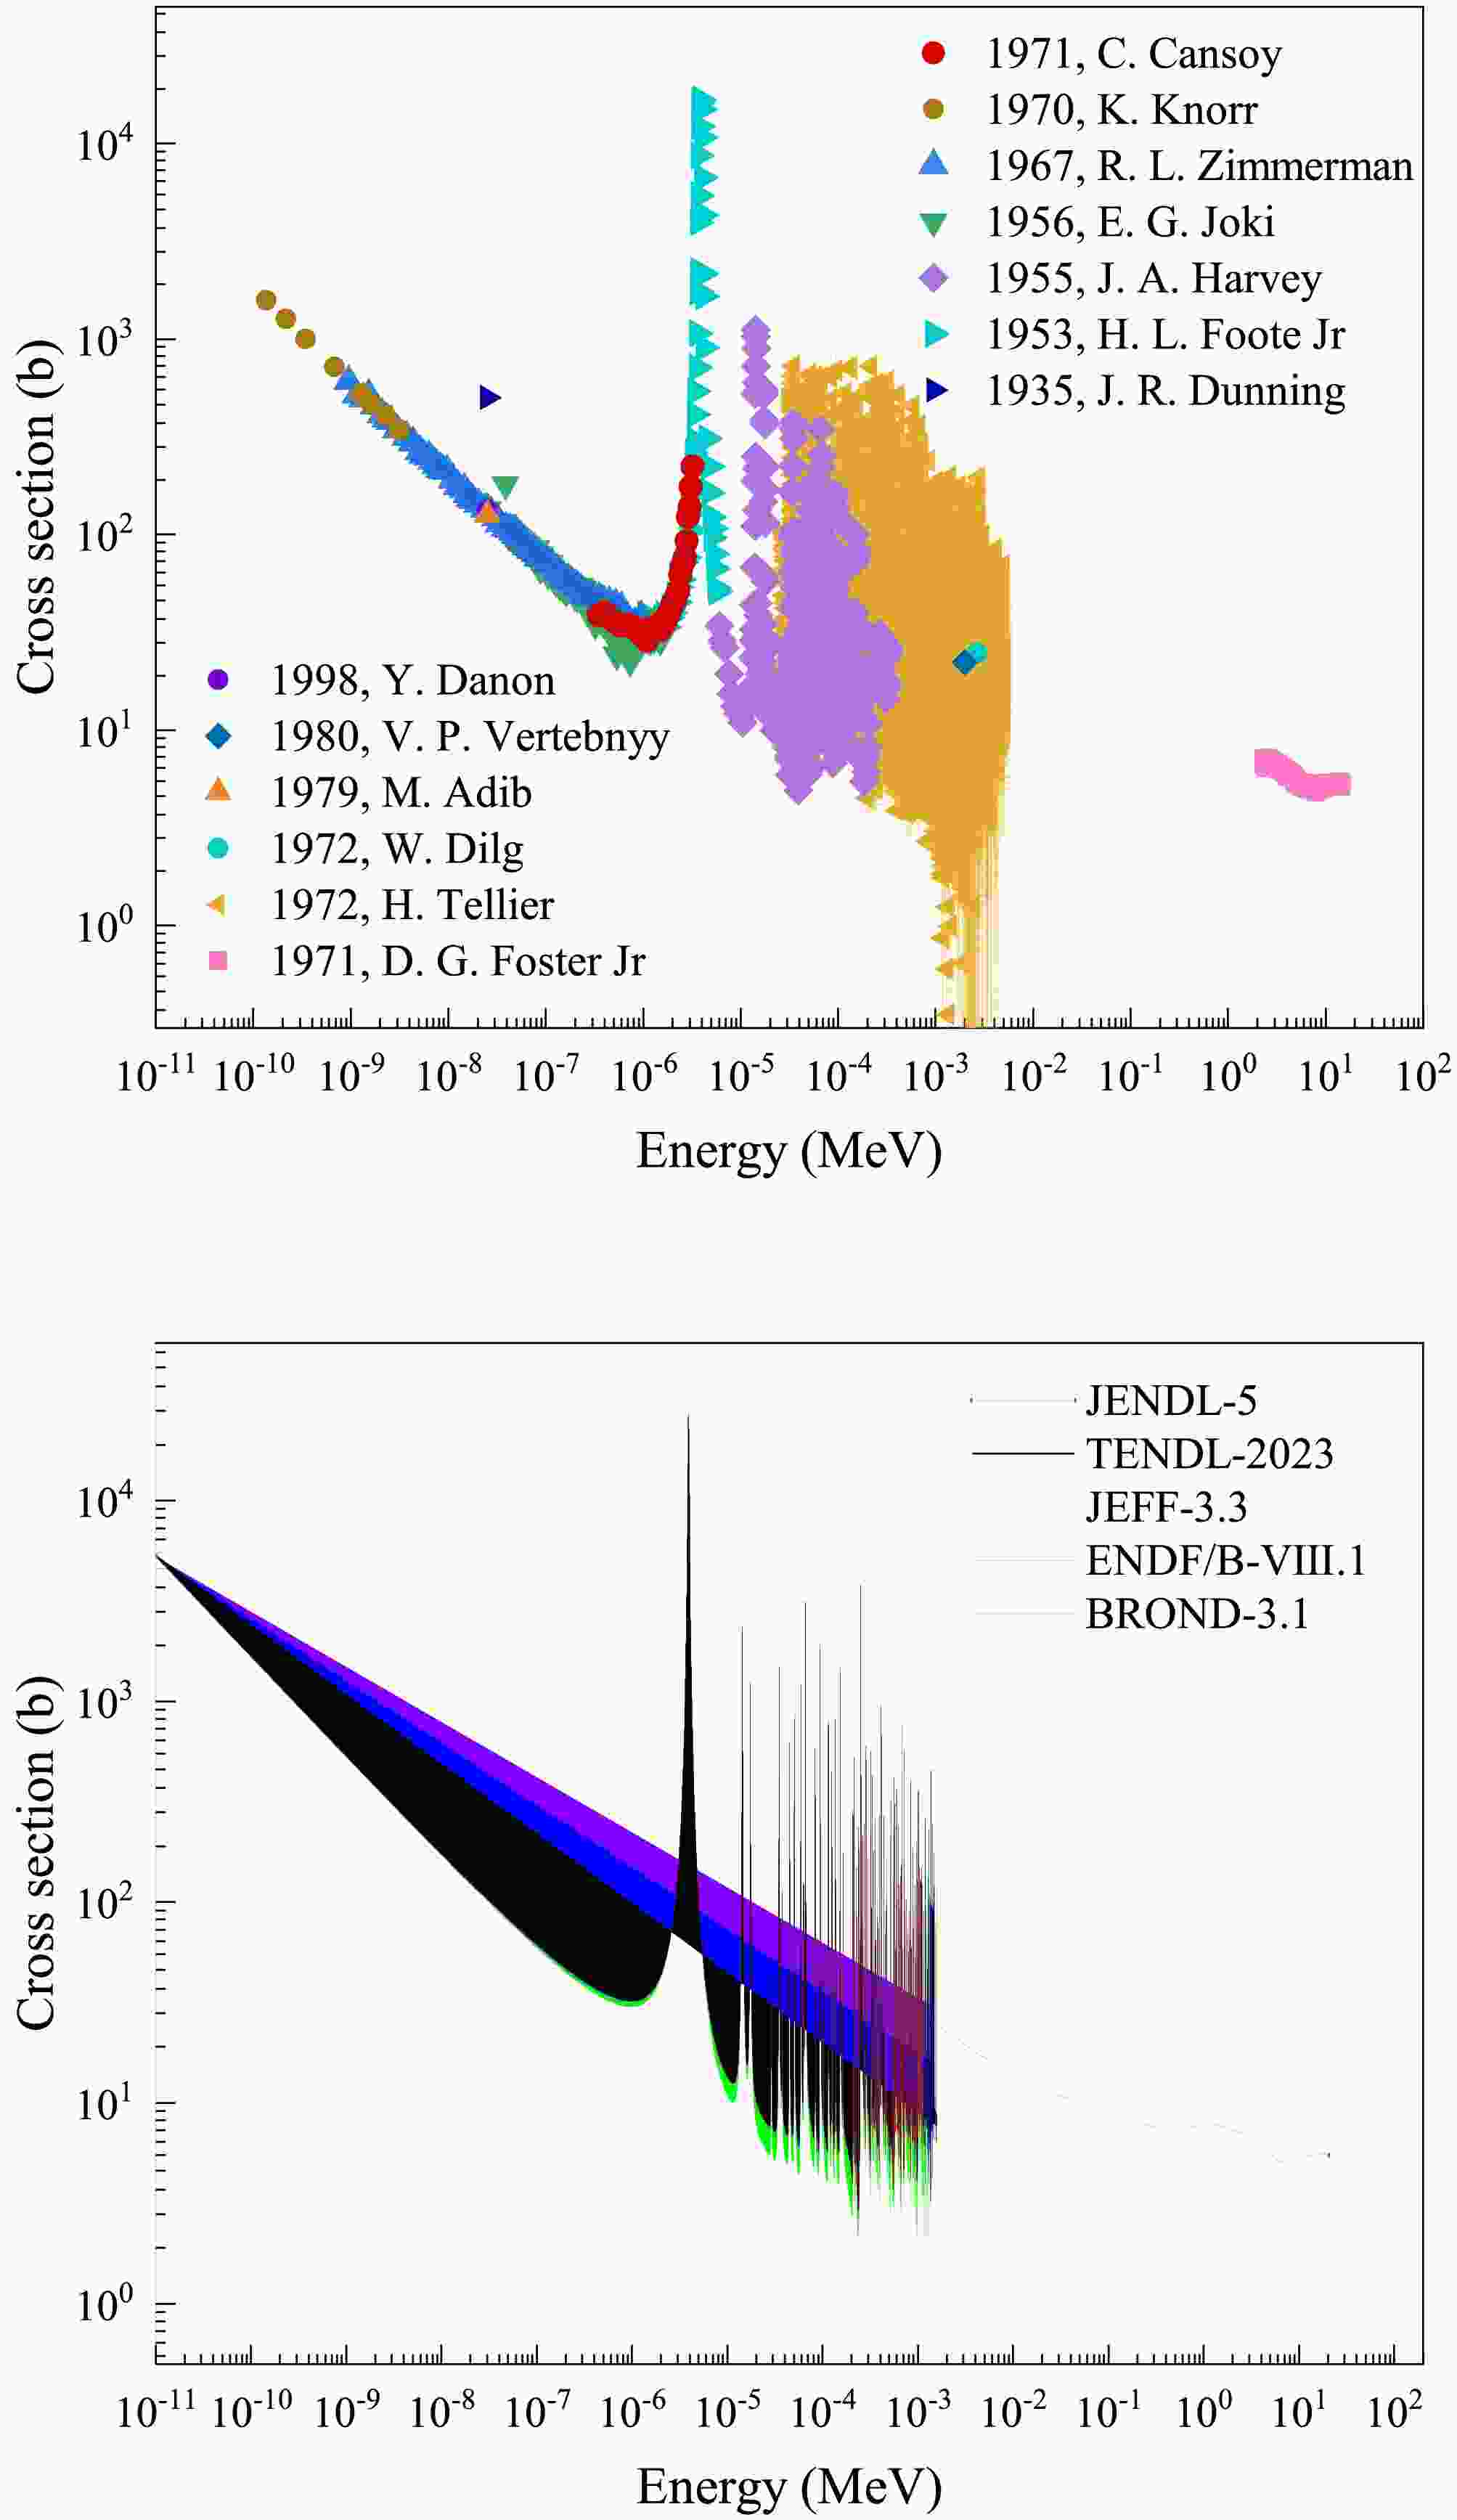
The neutron total cross section is the sum of partial cross sections for all neutron-induced reaction channels, which is one of the most important nuclear data and is valuable in the field of nuclear reaction studies, nuclear reactor designs and nuclear technology applications [1–3]. Thulium (Tm) is a rare-earth element with a single stable isotope, 169Tm. Due to high neutron sensitivity of 169Tm, it plays a vital role in nuclear industry [4–6]. However, data on the neutron total cross section of 169Tm in the keV region are limited in the Experimental Nuclear Reaction Data library. As shown in Fig. 1, only three datasets have been reported in the range: single-point data reported by V.P.Vertebnyy [7] and W. Dilg [8], and data with high uncertainty from H.Tellier [9]. There exists a significant data gap between 5 keV and 2.3 MeV. The bottom panel shows clear discrepancies among the evaluated nuclear data libraries ENDF/B-VIII.1 [10], JENDL-5 [11], JEFF-3.3 [12], BROND-3.1 [13], and TENDL-2023 [14] in the keV energy range. To accurately measure the neutron total cross section of 169Tm in the keV energy range, a measurement was performed at the back-streaming white neutron beam line (Back-n) of the China Spallation Neutron Source (CSNS) using a wing-shaped lithium glass detector. The detector can be employed to measure the in-beam γ-ray background with saturated resonance absorption technique. The neutron total cross section of 169Tm was determined in the energy range of 1 keV to 110 keV. Theoretical calculations for the energy region were subsequently performed using optimized optical model parameters in TALYS-2.0 for comparison and validation.

Figure 1. (color online) Experimental cross section of
$ ^{169}{\rm{Tm}} $ from the EXFOR database (top panel), and evaluated cross section from ENDF/B-VIII.1, JENDL-5, JEFF-3.3, TENDL-2023, and BROND-3.1 libraries (bottom panel). -
The measurement of the neutron total cross section was performed using the transmission method combined with the time-of-flight (TOF) technique. The neutron transmission
$ T_{exp}(E_{i}) $ at neutron energy$ E_{i} $ is obtained as the ratio of the background-subtracted neutron counts with and without the sample. It is given by$ T_{\text{exp}}(E_i) = \frac{C_{\text{in}}(E_i) - B_{\text{in}}(E_i)}{C_{\text{out}}(E_i) - B_{\text{out}}(E_i)} $
(1) where
$ C_{\text{in}}(E_i) $ ,$ B_{\text{in}}(E) $ are respectively the neutron counts and the background counts under the sample-in conditions.$ C_{\text{out}}(E_i) $ ,$ B_{\text{out}}(E_i) $ are the neutron counts and the background counts under the sample-out conditions. From the measured transmission$ T_{\text{exp}}(E_i) $ , the total cross section$ \sigma_t(E_i) $ can be determined by$ \sigma_{t}\left(E_{i}\right)=-\frac{1}{n} \ln T_{\exp }\left(E_{i}\right) $
(2) where n is the areal density of the sample. The neutron energy was measured with the TOF method. The non-relativistic energy equation can be expressed as
$ E_{i} = \frac{m_n L^2}{2(t - t_0)^2} = \frac{k^2 L^2}{(t - t_0)^2} $
(3) where
$ E_i $ is the neutron energy,$ m_n $ is the neutron mass,$ t_0 $ is the time of neutron production, t is the arrival time of the neutron.$ k \approx 72.2996 \left[\sqrt{\text{eV}}\cdot \mu \text{s}/\text{m}\right] $ . -
At the CSNS Back-n facility, the neutrons are produced by 1.6 GeV/c proton beam striking a tungsten target. The beam operated in a double-bunch mode at 25 Hz, with each pulse containing two 42-ns-wide bunches separated by 410 ns. The experimental layout is shown in Fig. 2. There are two experimental stations: Experimental Station 1 (ES#1) and Experimental Station 2 (ES#2) at the Back-n. Three collimators located at 24 m, 50 m and 70 m from the spallation target are utilized to adjust the shape of neutron beam spot. The first collimator is a beam shutter and equipped with filters. For the neutron total cross section measurements, the inner diameters of the three collimators are 3 mm, 15 mm, and 40 mm, producing a neutron beam spot with a diameter of 3 mm at ES#2. The detector surface was approximately 21 m from the sample center, while the sample center was about 56 m from the spallation target center. This configuration can reduce the background of scattered neutrons.
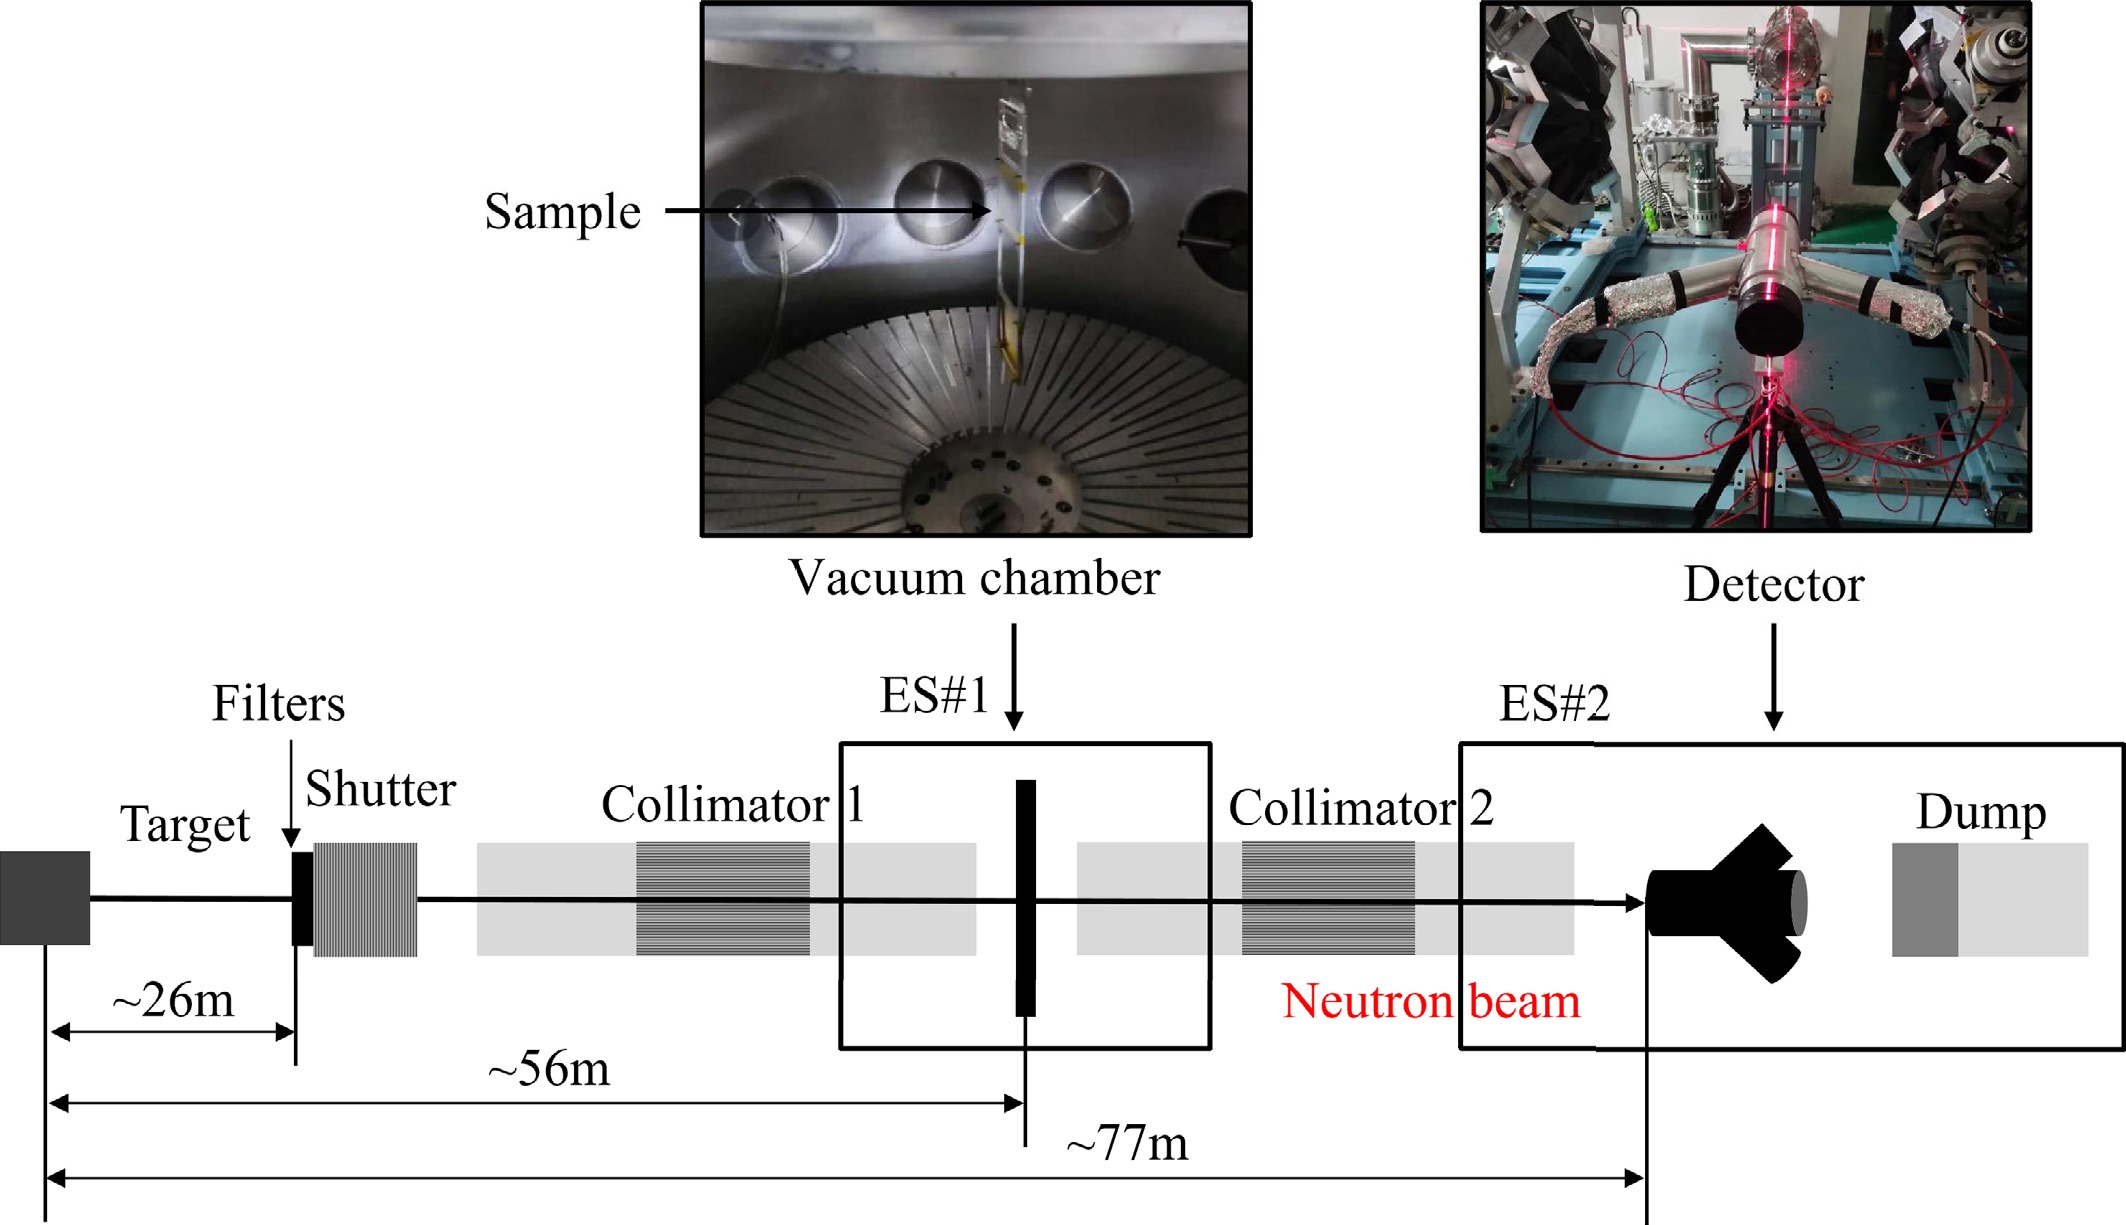
Figure 2. (color online) Schematic diagram of neutron total cross section measurement facility. The sample was set at the vacuum chamber equipped with a remotely controlled sample-changing system. And a wing-shaped lithium glass detector was employed at ES#2.
-
The measurements of the neutron total cross section carried out at CSNS Back - n [15, 16] are mainly based on the Neutron Total Cross Section Spectrometer (NTOX) at present [17–21]. In this work, a glass scintillator detector with smooth detection efficiency was employed, as shown in Fig. 3. Coincidence measurements between two PMTs can significantly reduce dark-noise signals and improve the signal-to-background ratio. The 0.1-mm-thick titanium (Ti) foils were used to seal the detector along the beam direction, thereby reducing the background from scattered neutrons.
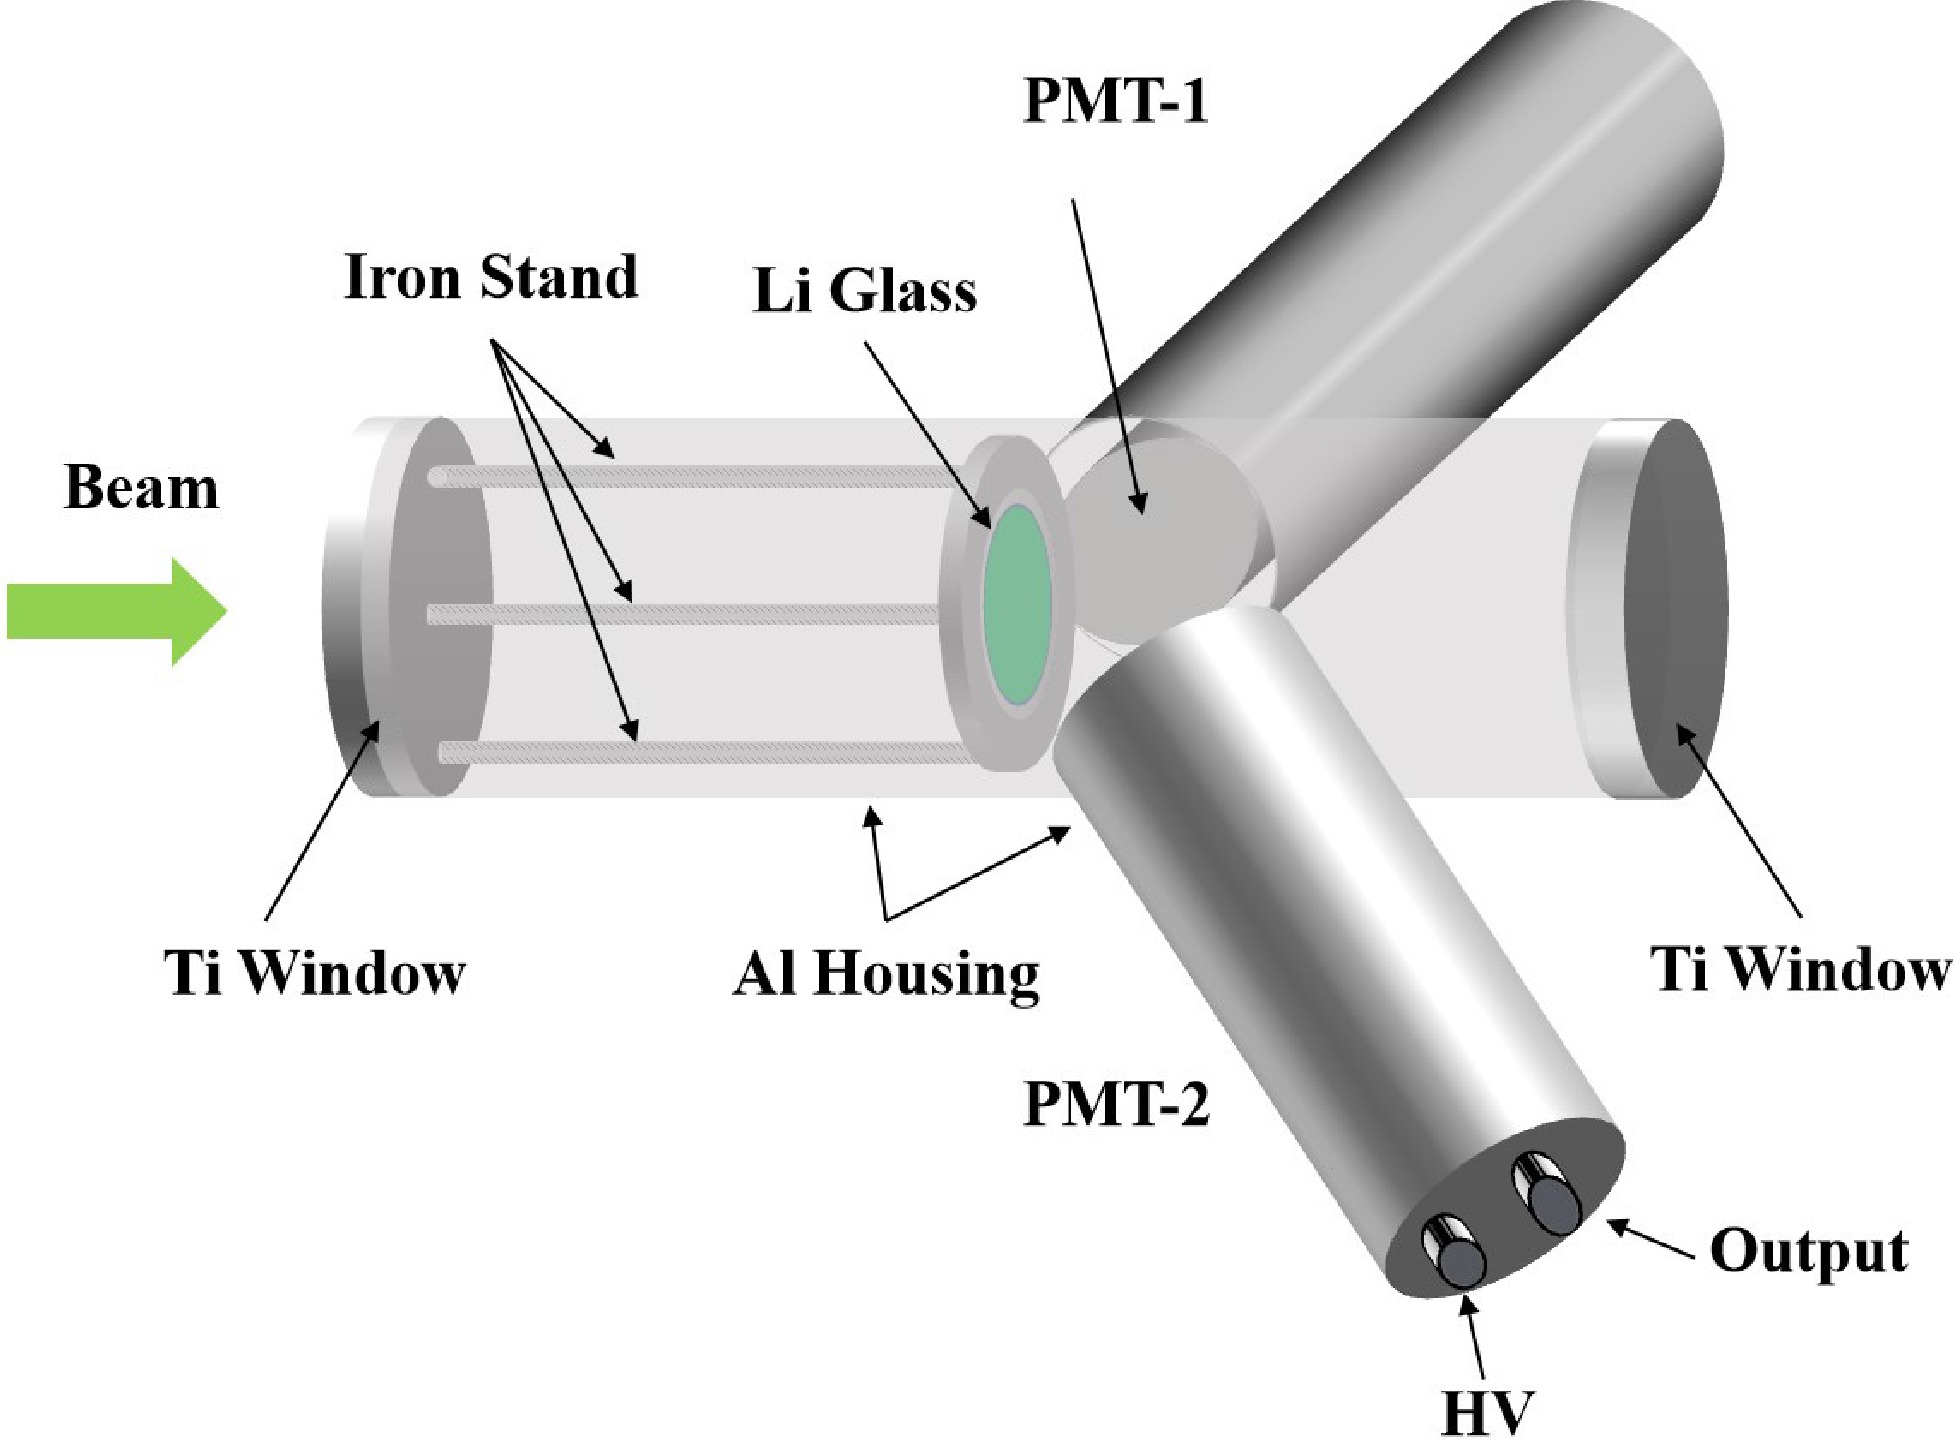
Figure 3. (color online) Structure of the detector. It is consisted of three coupled aluminum tubes. The central tube is aligned with the beam, where a 6Li-glass scintillator (6Li-GS) and a 7Li-glass scintillator (7Li-GS) can be installed interchangeably. The PMTs are housed in the side tubes set at
$ 60^{\circ} $ to the central axis, reducing the blinding effect of the γ-flash.The neutron detection principle of glass scintillators is based on the exothermic nuclear reaction 6Li(n,α)3H. Although both 6Li and 7Li respond to γ-ray, only 6Li performs obviously sensitivity to neutrons. The 7Li-GS detector was employed to quantify the in-beam γ-ray background, which was then subtracted from the 6Li-GS detector to accurately obtain the events of neutron-induced. Each of PMT was independently powered by a high-voltage (HV) supply, and both the PMT output signals and the pulsed proton beam signal were fed to the CAEN DT5730B for digitization.
-
The sample utilized in Fig. 4 was placed at vacuum chamber of ES#1. The filters were located near the neutron beam window. To accurately subtract the background, the measurement with the black resonance filter method was performed to determine the background. Therefore, the filters should be selected from materials with large neutron absorption cross section and narrow resonance peaks, such as Cadmium (Cd), tantalum (Ta), cobalt (Co) and silver (Ag). In this experiment, the filters selected were
$ 1\ \text{mm} $ 181Ta and$ 1\ \text{mm}\ ^{59}\text{Co} $ . Additionally, the$ 1\ \text{mm} $ natCd filter was employed to effectively block thermal neutrons and prevent overlap between consecutive neutron pulses, thereby enhancing measurement accuracy. The detailed information of the sample and filters are listed in Table 1.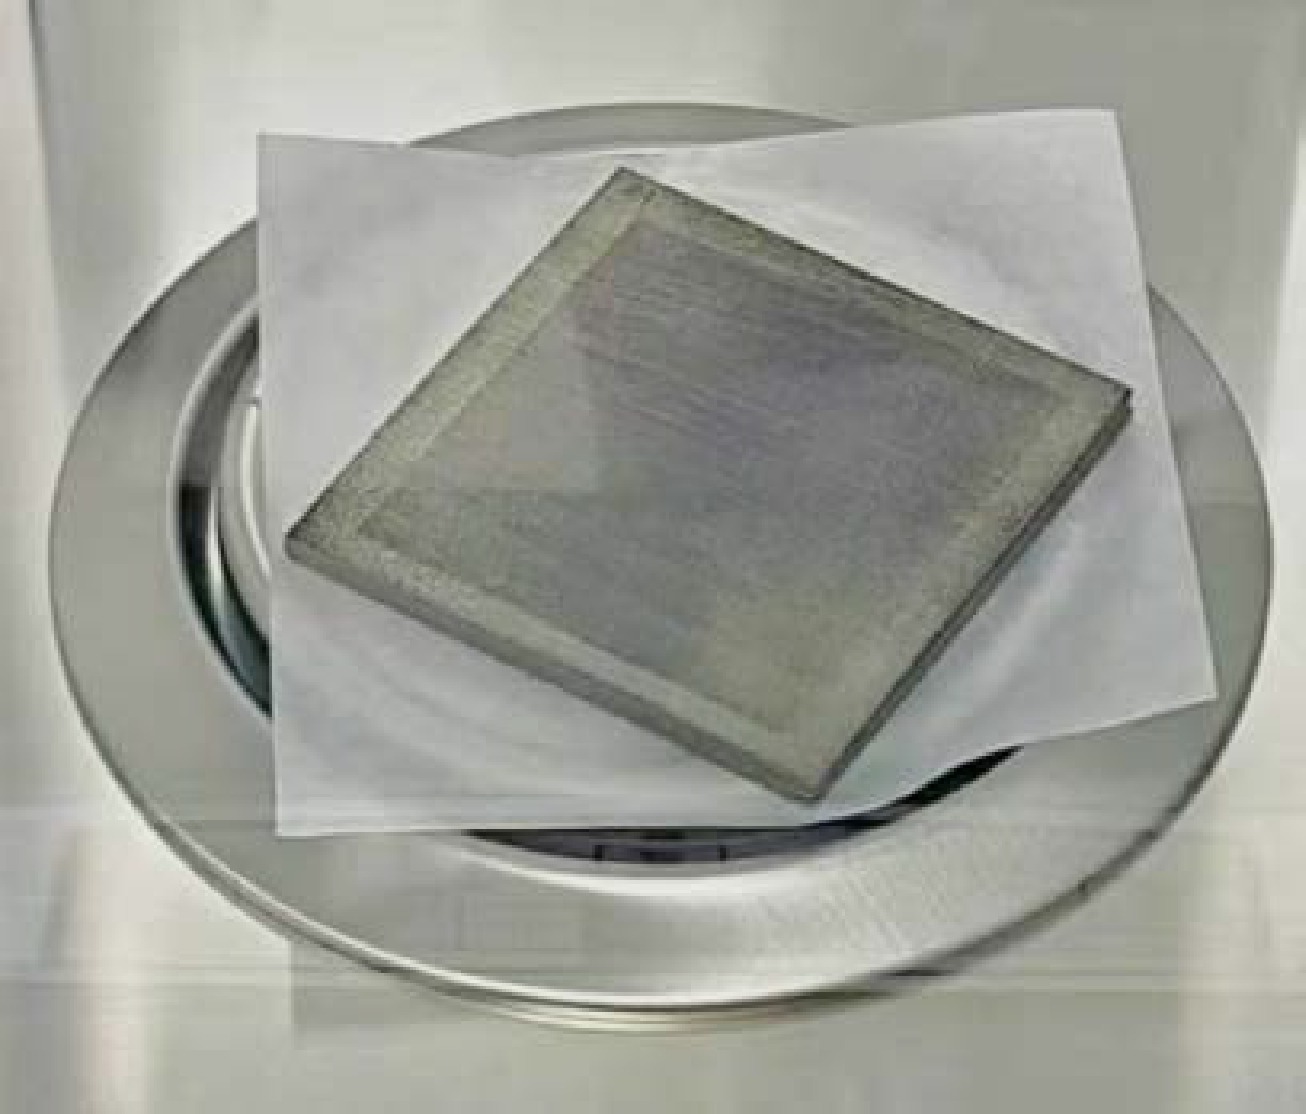
Figure 4. (color online) The sample is square with a size of
$ 60.37\ \text{mm}\times4.46\ \text{mm} $ IMaterial Shape Length/Diameter (mm) Thickness (mm) Purity (%) 169Tm Square $ 60.37 \pm 0.11 $ $ 4.46 \pm 0.05 $ 99.95 181Ta Square $ 100.00 \pm 0.10 $ $ 1.00 \pm 0.01 $ 99.90 59Co Square $ 100.00 \pm 0.10 $ $ 1.00 \pm 0.01 $ 99.90 natCd Circular $ 80.00 \pm 0.10 $ $ 1.00 \pm 0.01 $ 99.95 Table 1. Sample and filter parameters, including material, shape, length, diameter, thickness and purity are listed.
-
Events with signals detected by both PMTs within a coincident-time window were identified as valid coincidences. The waveforms of all triggered events, including those induced by γ-ray and neutrons, were recorded. To accurately assess the experimental background, data were analysed for both the sample-in and sample-out conditions using two types of scintillators (6Li-GS and 7Li-GS) respectively. The total counts measured by the 6Li-GS detector included contributions from neutron events, activation background, and in-beam γ background. The measured transmission was then expressed as
$ T_{\exp} = \frac{ C_{\text{in}}\times f_{1} - B_{0_{\text{in}}}\times f_{1} - k_{\text{in}}\times B_{\gamma_{\text{in}}}\times f_{2} }{ C_{\text{out}}\times f_{3} - B_{0_{\text{out}}}\times f_{3} - k_{\text{out}}\times B_{\gamma_{\text{out}}}\times f_{4} } $
(4) where
$ C_{in} $ ,$ B_{0in} $ are respectively the total counts and the flat background counts measured by the 6Li-GS detector under the sample-in conditions, while$ C_{out} $ ,$ B_{0out} $ correspond to those measured by the 6Li-GS detector under the sample-out conditions.$ B_{\gamma in} $ ,$ B_{\gamma out} $ are the in-beam γ-ray background obtained using the 7Li-GS detector for the sample-in and sample-out states.$ f_{1} $ ,$ f_{2} $ ,$ f_{3} $ ,$ f_{4} $ represent the product of the factors accounting for the dead-time correction and the proton-count normalization for each measurement. Additionally,$ k_{in} $ and$ k_{out} $ are factors determined from the TOF spectra measured by the 7Li-GS detector with the saturated resonance absorption technique. -
Precise determination of neutron energy relies on accurate calibration of the neutron TOF and flight length. The raw flight time (
$ TOF_{raw} $ ) was obtained from the difference between the neutron arrival time and the initial time. Since the initial time recorded by the facility corresponded to the proton beam striking the target rather than the actual neutron emission, the effective neutron flight time ($ TOF_{n} $ ) was obtained by subtracting the γ-flash flight time from$ TOF_{raw} $ . The$ TOF_{n} $ is expressed as$ TOF_n = TOF_{raw}-\left(T_{\gamma}-\frac{L}{c}\right) $
(5) where
$ T_{\gamma} $ is the arrival time of γ-flash, determined by fitting the γ-flash peak in the$ TOF_{raw} $ spectrum. c represents the speed of light. L is the effective flight length that incorporates neutron moderation and transport in the production target as well as propagation along the beamline. The flight length can be calibrated using the known energies and corresponding$ TOF $ of resonance peaks from filters and sample. In this work, the resonance peaks can be selected for calibration: 181Ta (13.91 eV, 23.95 eV, 39.15 eV, 63.16 eV, 82.98 eV, 99.36 eV, 166.49 eV, 194.90 eV, 225.21 eV), 169Tm (65.76 eV, 250.81 eV) and 59Co (2861.50 eV, 4328.27 eV). The flight length was determined by fitting the functional relation between neutron energy and$ TOF_{{\rm{raw}}} $ according to Eq. (3). According to the fit of neutron energy and flight time in Fig. 5, L is determined to be$ 77.10 \pm 0.05\ {\rm{m}} $ .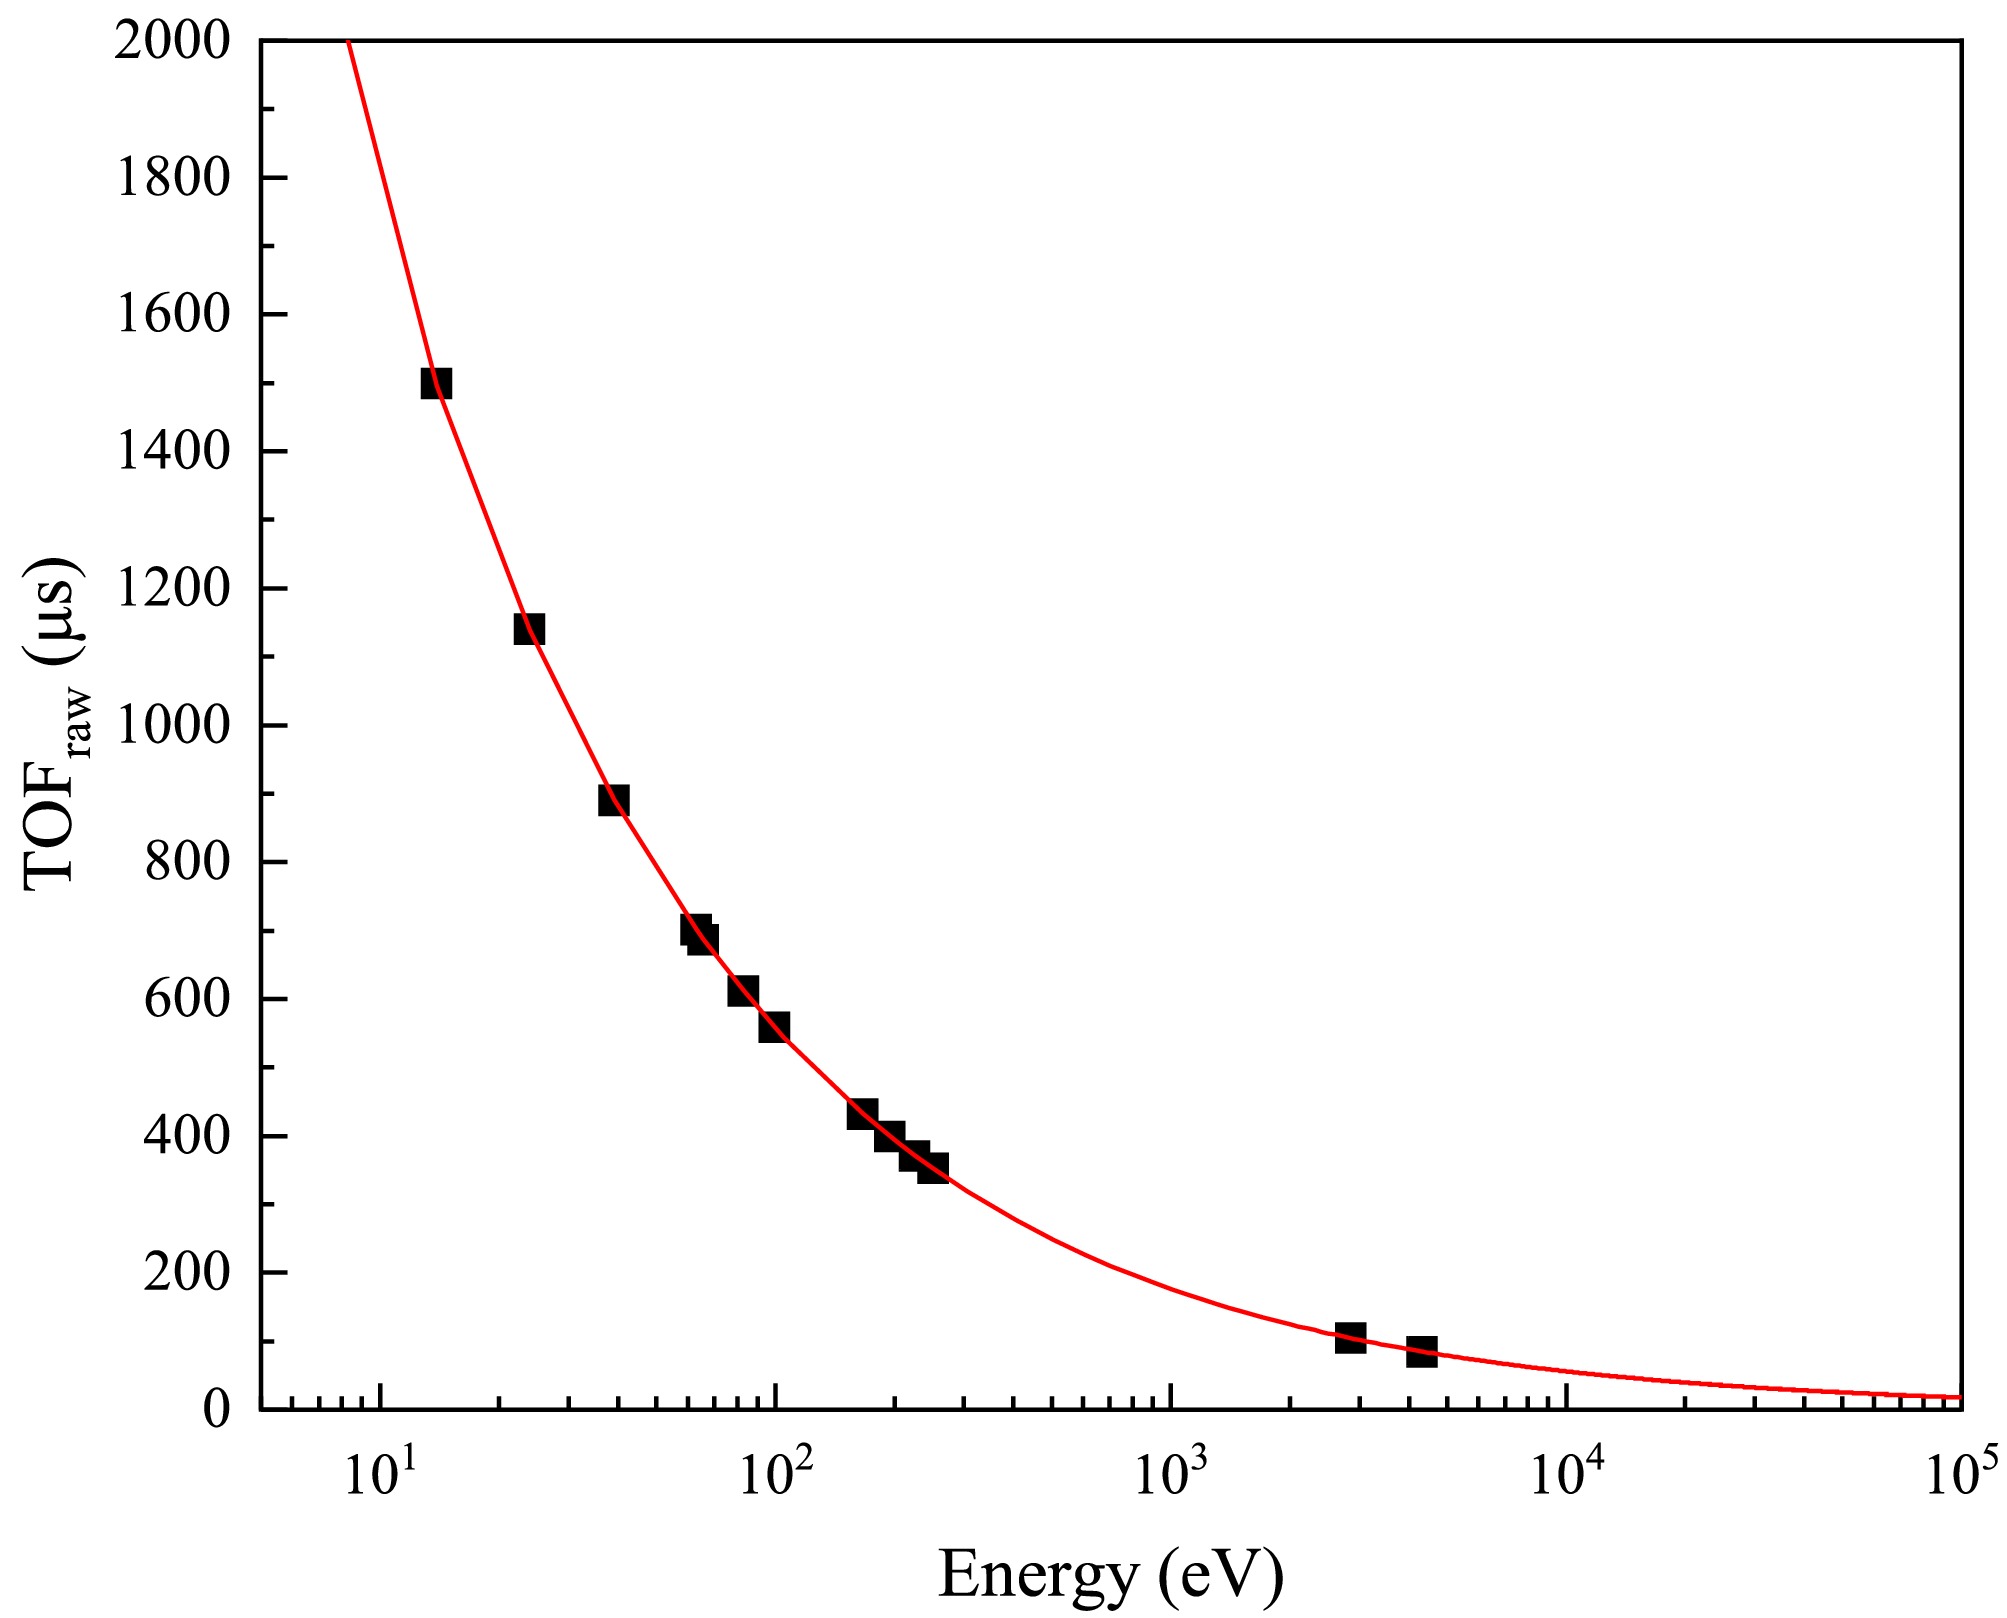
Figure 5. (color online) Neutron flight length fit: experimental data (black points) and the fitted result (red curve).
-
During measurements, if the system was unable to register a new pulse before completing the processing of the previous one, subsequent pulses could be lost. This dead-time effect depends on both detector characteristics and the configuration of the acquisition system. In this study, the data acquisition system could record nearly all triggered signals. However, to accurately account for pile-up effects, a nonparalyzable dead-time model was employed. An effective dead-time of
$ \tau=380 $ ns was used, during which multiple pulses were treated as a single event. The correction method described by Knoll [22] can be applied, and the dead-time correction factor$ f_{dt} $ is given by$ f_{dt} = \frac{1}{1 - \tau N_{i}} $
(6) where
$ N_{i} $ is the counts normalized to the proton pulse and bin width. The variation of$ f_{dt} $ as a function of$ TOF $ is shown in Fig. 6. Above 16,700 ns (corresponding to neutron energy below 110 keV), the correction factors for both the 6Li-GS and 7Li-GS detectors decrease with increasing$ TOF $ . Within this range, counts losses remain below 10%, indicating that the data are reliable and suitable for further analysis. To correct for beam fluctuations and differences in measurement duration, each spectrum was normalized using the reciprocal of the corresponding proton count before background subtraction.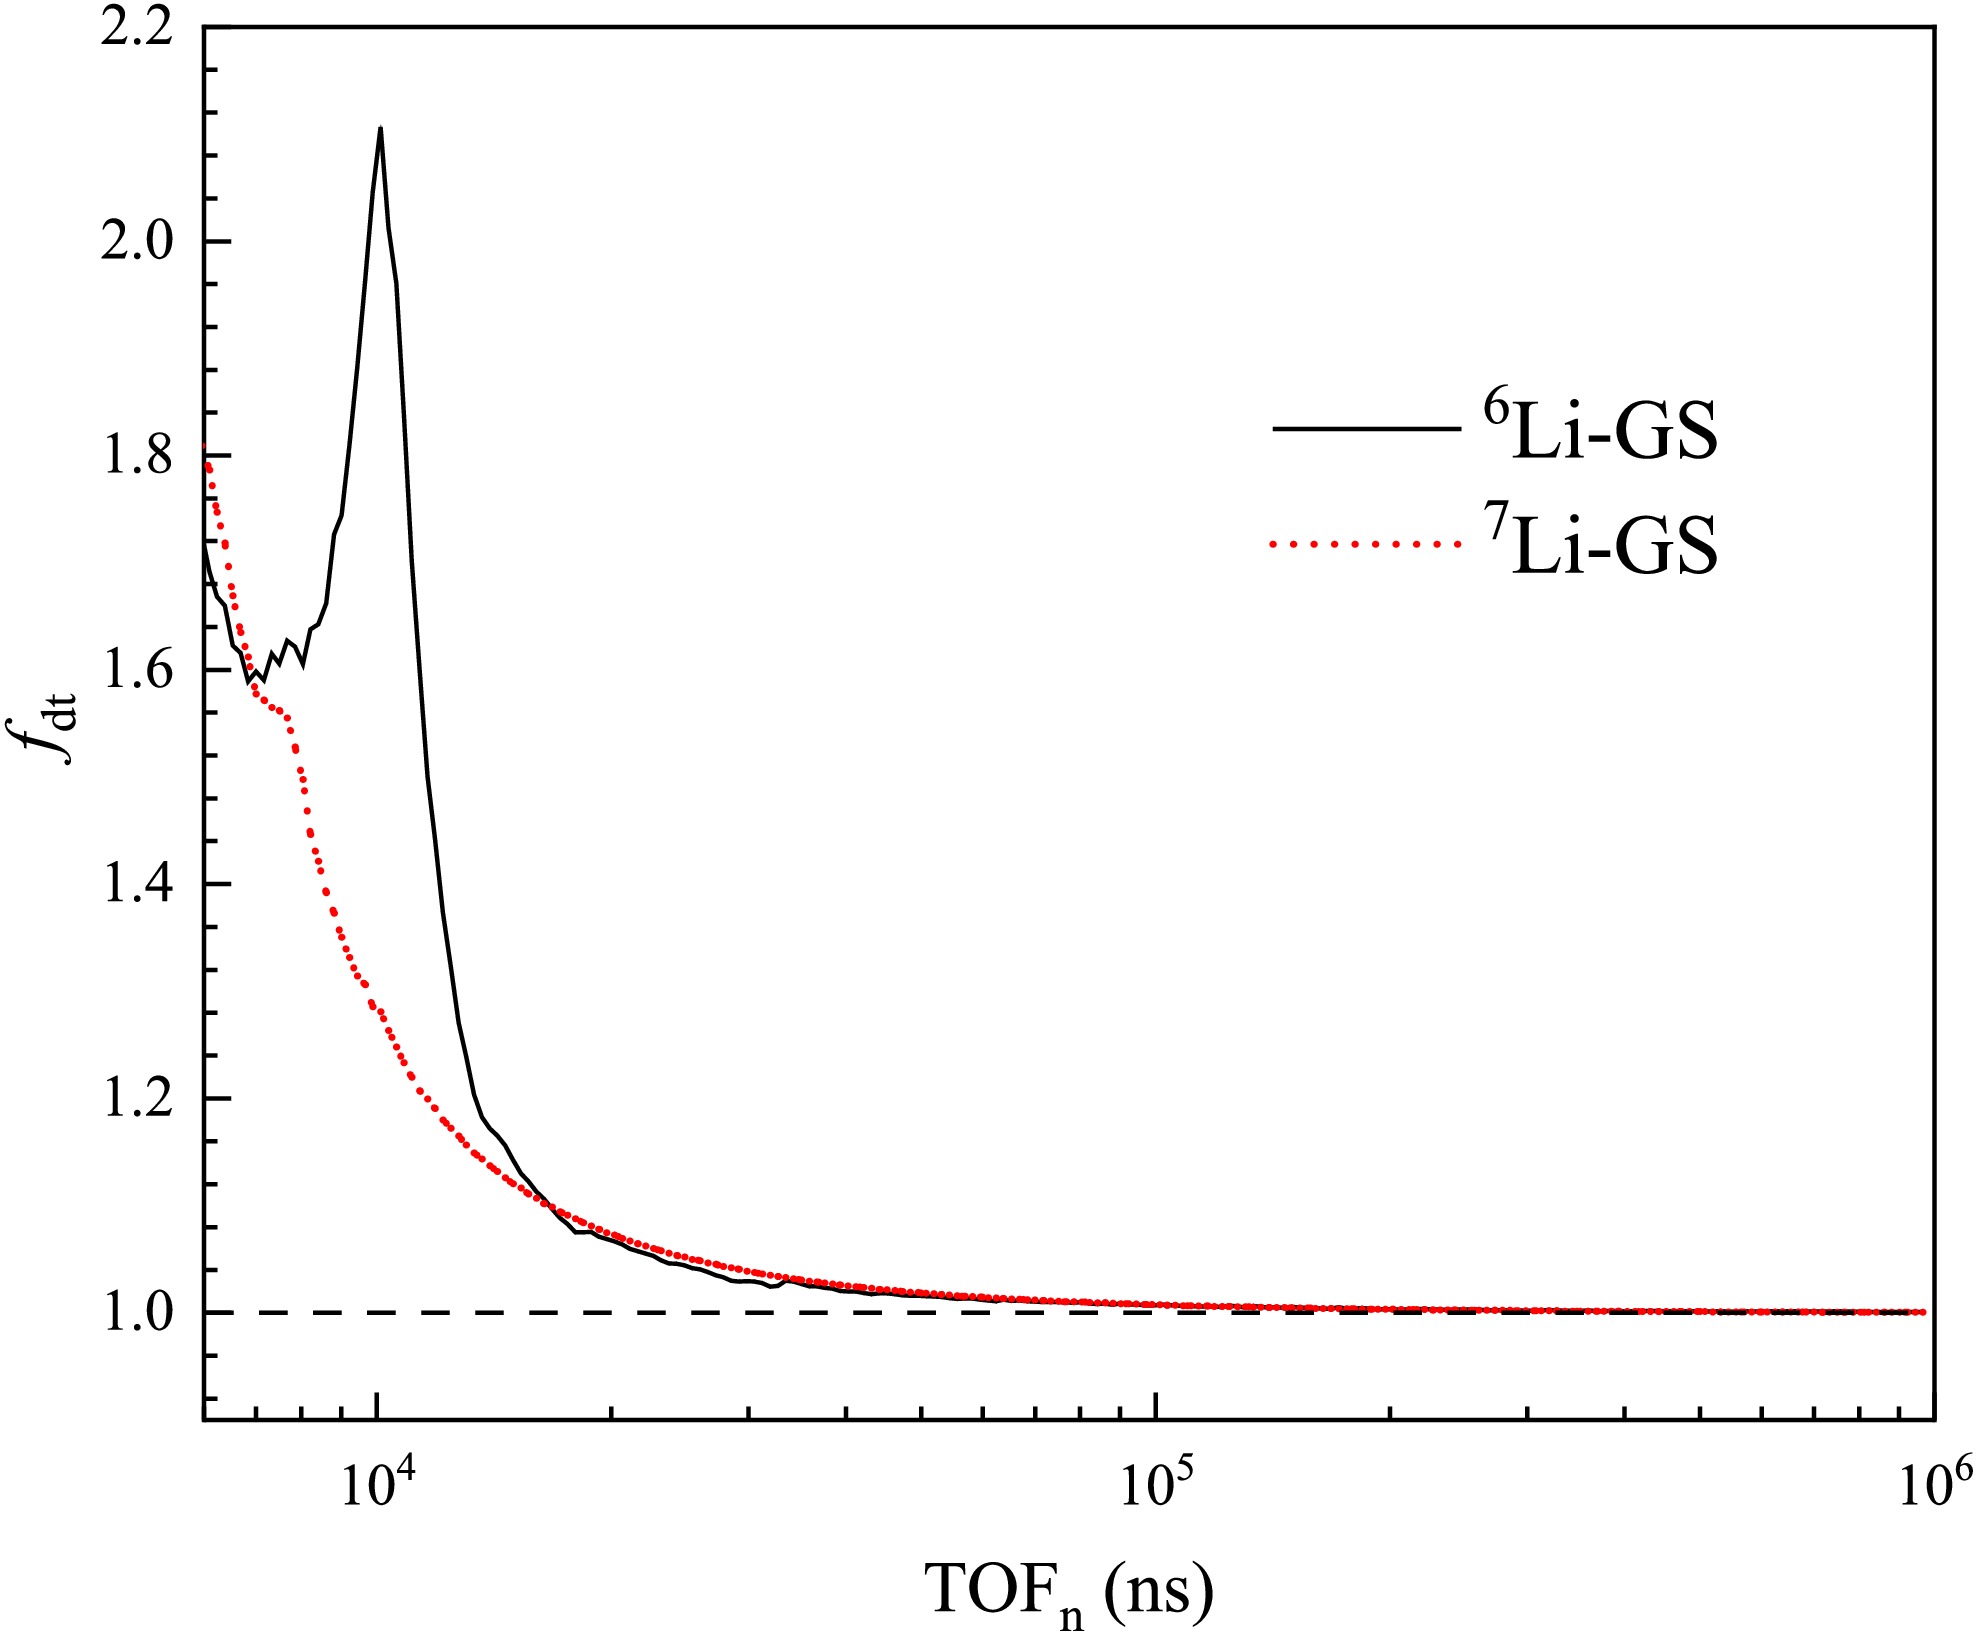
Figure 6. (color online) Variation of the dead-time correction factor with flight time. The black solid line represents the values for 6Li–GS detector without the filters or sample, while the red short-dashed line represents those for 7Li–GS detector.
-
The background in neutron total cross section measurements mainly consists of time-independent and time-dependent components. The time-independent background, arising from enviromental and sample radioactivity, remains constant over time and appears as a flat background. The time-dependent background includes sample-dependent and sample-independent parts, primarily originating from in-beam γ-ray with energies ranging from keV to several tens of MeV [23]. The sample-independent background was measured using a 7Li-GS detector with the saturated resonance technique. Given the large neutron cross section of 169Tm at 3.90 eV, it is assumed that all neutrons at this energy are absorbed [24], forming a obvious absorption valley in the
$ TOF_{n} $ spectra. This feature was used to determine the level of in-beam γ-ray background. The total background of the 6Li-GS detector under the sample-in conditions,$ B_{Li6in} $ can be expressed as:$ B_{Li6in} = B_{0Li6in} +\left[C_{Li7in} - B_{0Li7in}\right]\times k_{\text{in}} $
(7) where
$ B_{0Li6in} $ is the flat background of the 6Li-GS detector.$ C_{Li7in} $ is the measured counts of the 7Li-GS detector, and$ B_{0Li7in} $ is the flat background of the 7Li-GS detector. The background measured by the 6Li-GS detector for 169Tm without filters is shown in Fig. 7.$ k_{in} $ is determined to be 0.43 according to the valley at 3.90 eV. The in-beam γ-ray span the entire energy range and become more dominant at higher energies, while the flat background mainly affects the region above$ 10^6 $ ns (below 30 eV).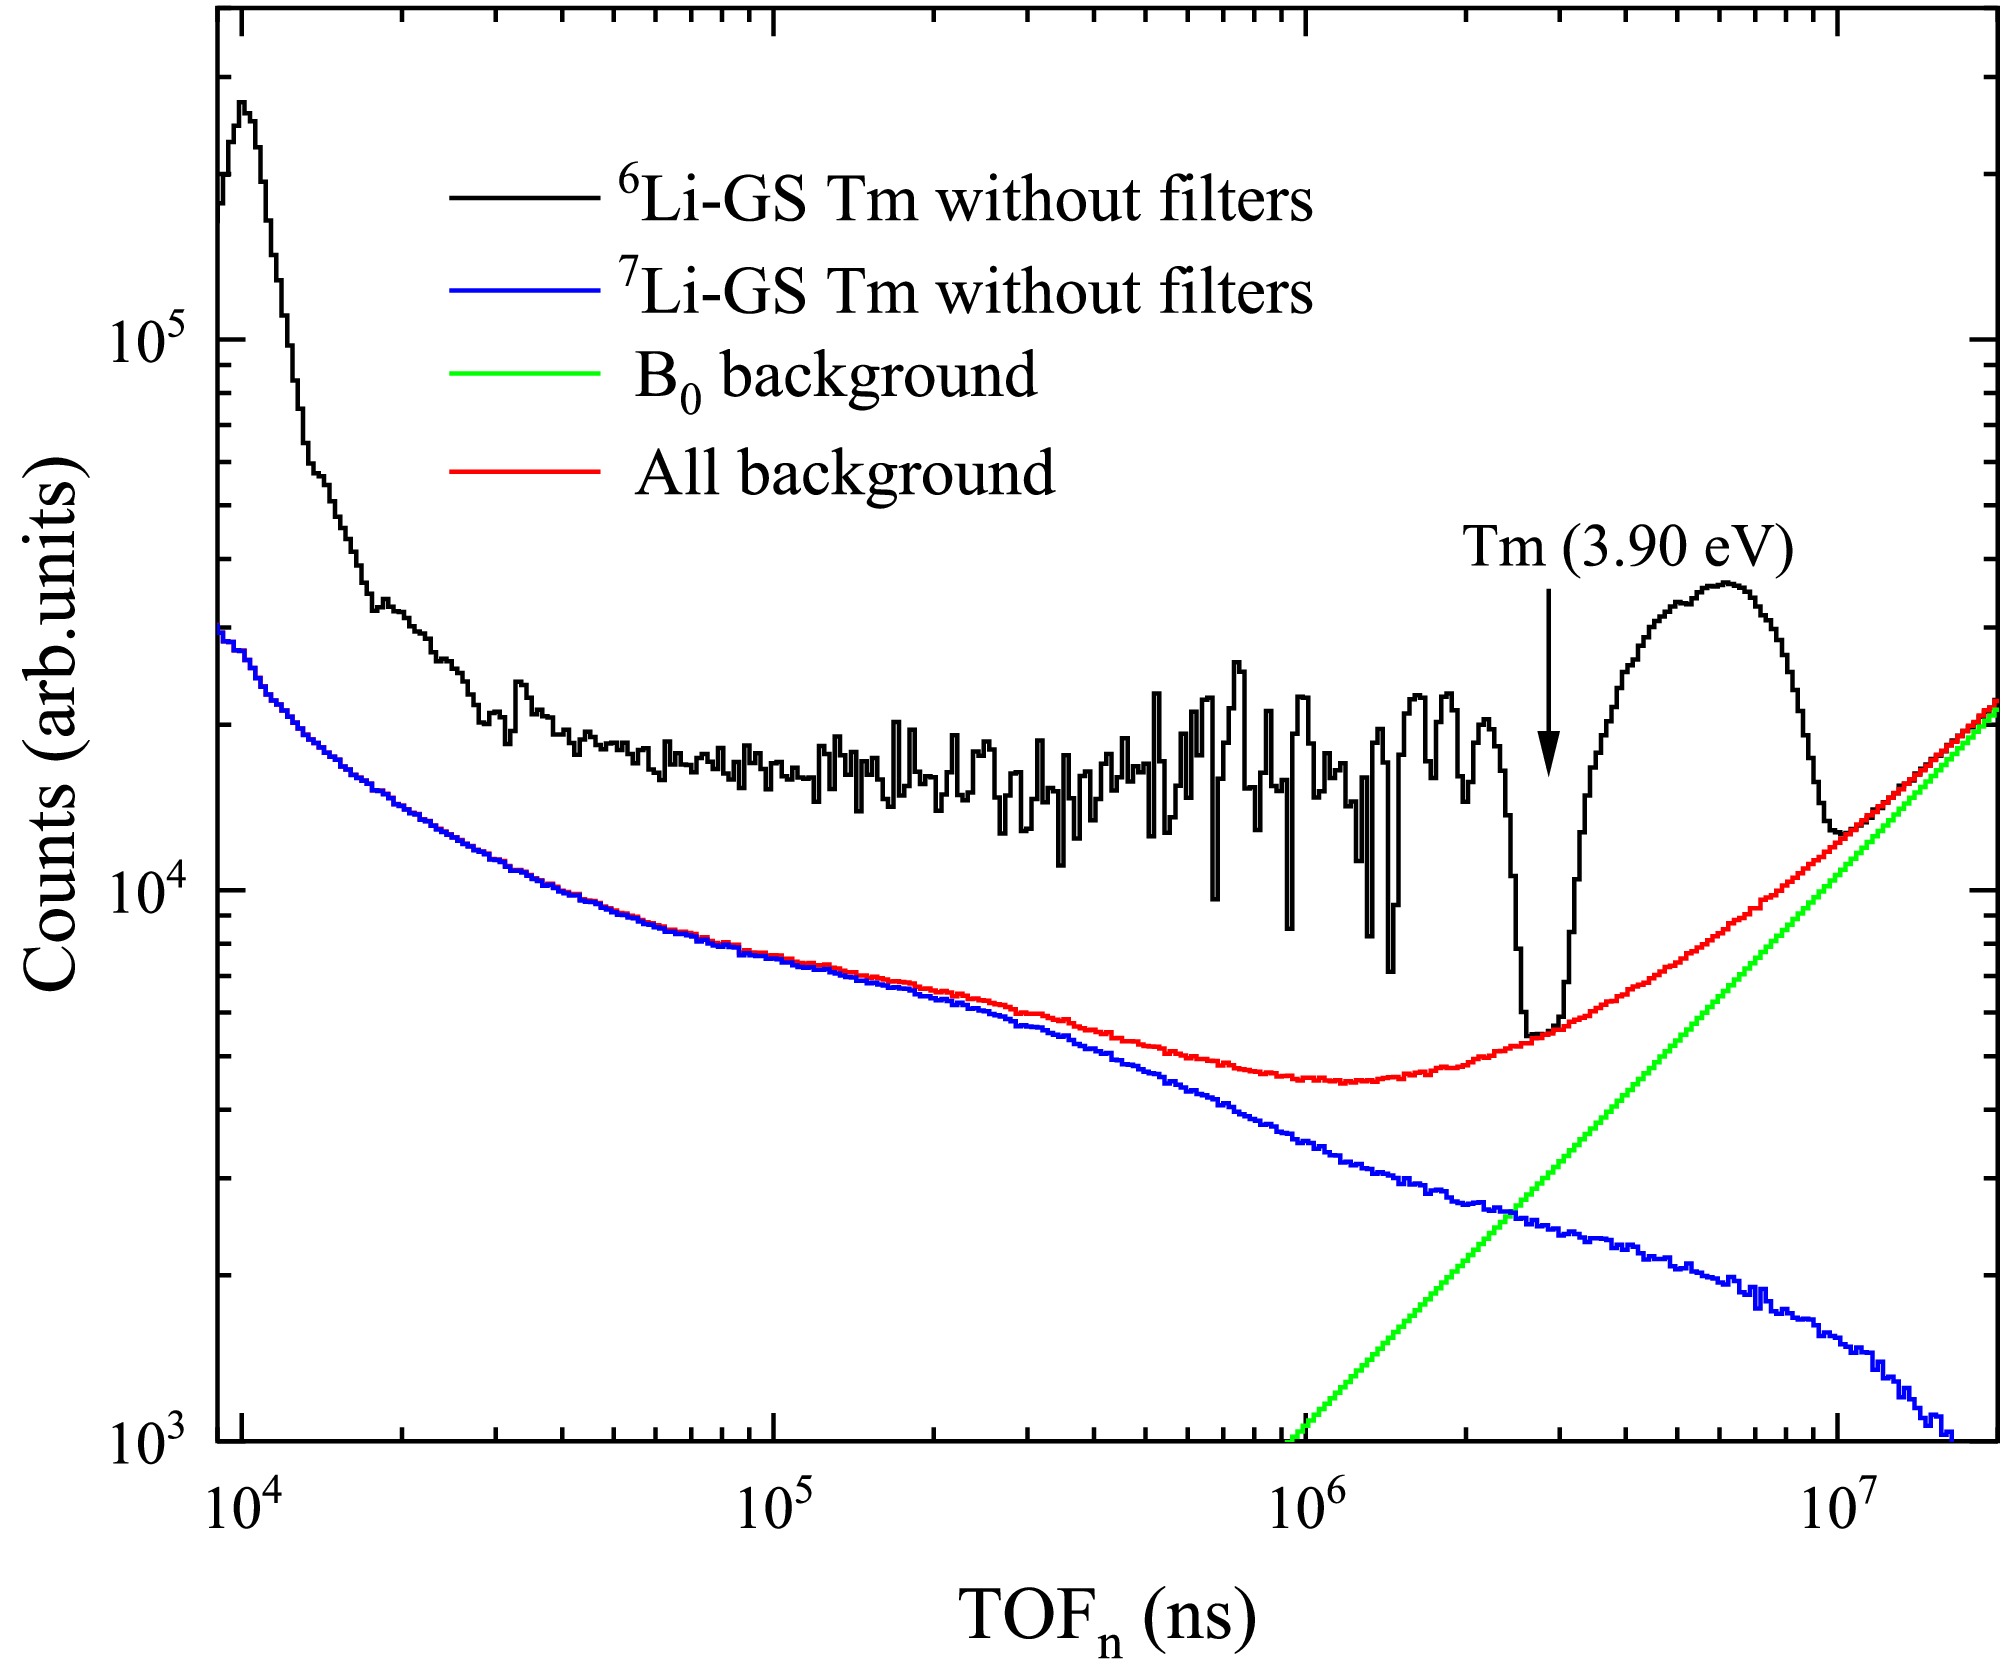
Figure 7. (color online) Background with the sample using the 6Li-GS and 7Li-GS detectors. The green curve represents the flat background, the blue curve represents the in-beam γ-ray background, and the red curve shows the total background contributing to the TOF spectrum measured by the 6Li-GS detector (black curve).
Under the sample-out conditions, the absence of the sample absorption peak makes it impossible to determine the in-beam γ-ray normalization factor directly, instead, it is obtained using the 7Li-GS detector combined with the black resonance filter technique. Filters with strong cross section at neutron resonance absorption peaks were employed to fully absorb neutrons at specific energies [25], thereby creating black resonance valleys in the spectra. As shown in Fig. 8, there are distinct valleys observed at the resonance peaks of 59Co (132 eV, 5.036 keV) and 181Ta (4.28 eV), where most incident neutrons are absorbed and the remaining part corresponds to background. The background of the 6Li-GS detector without filters can be determined by
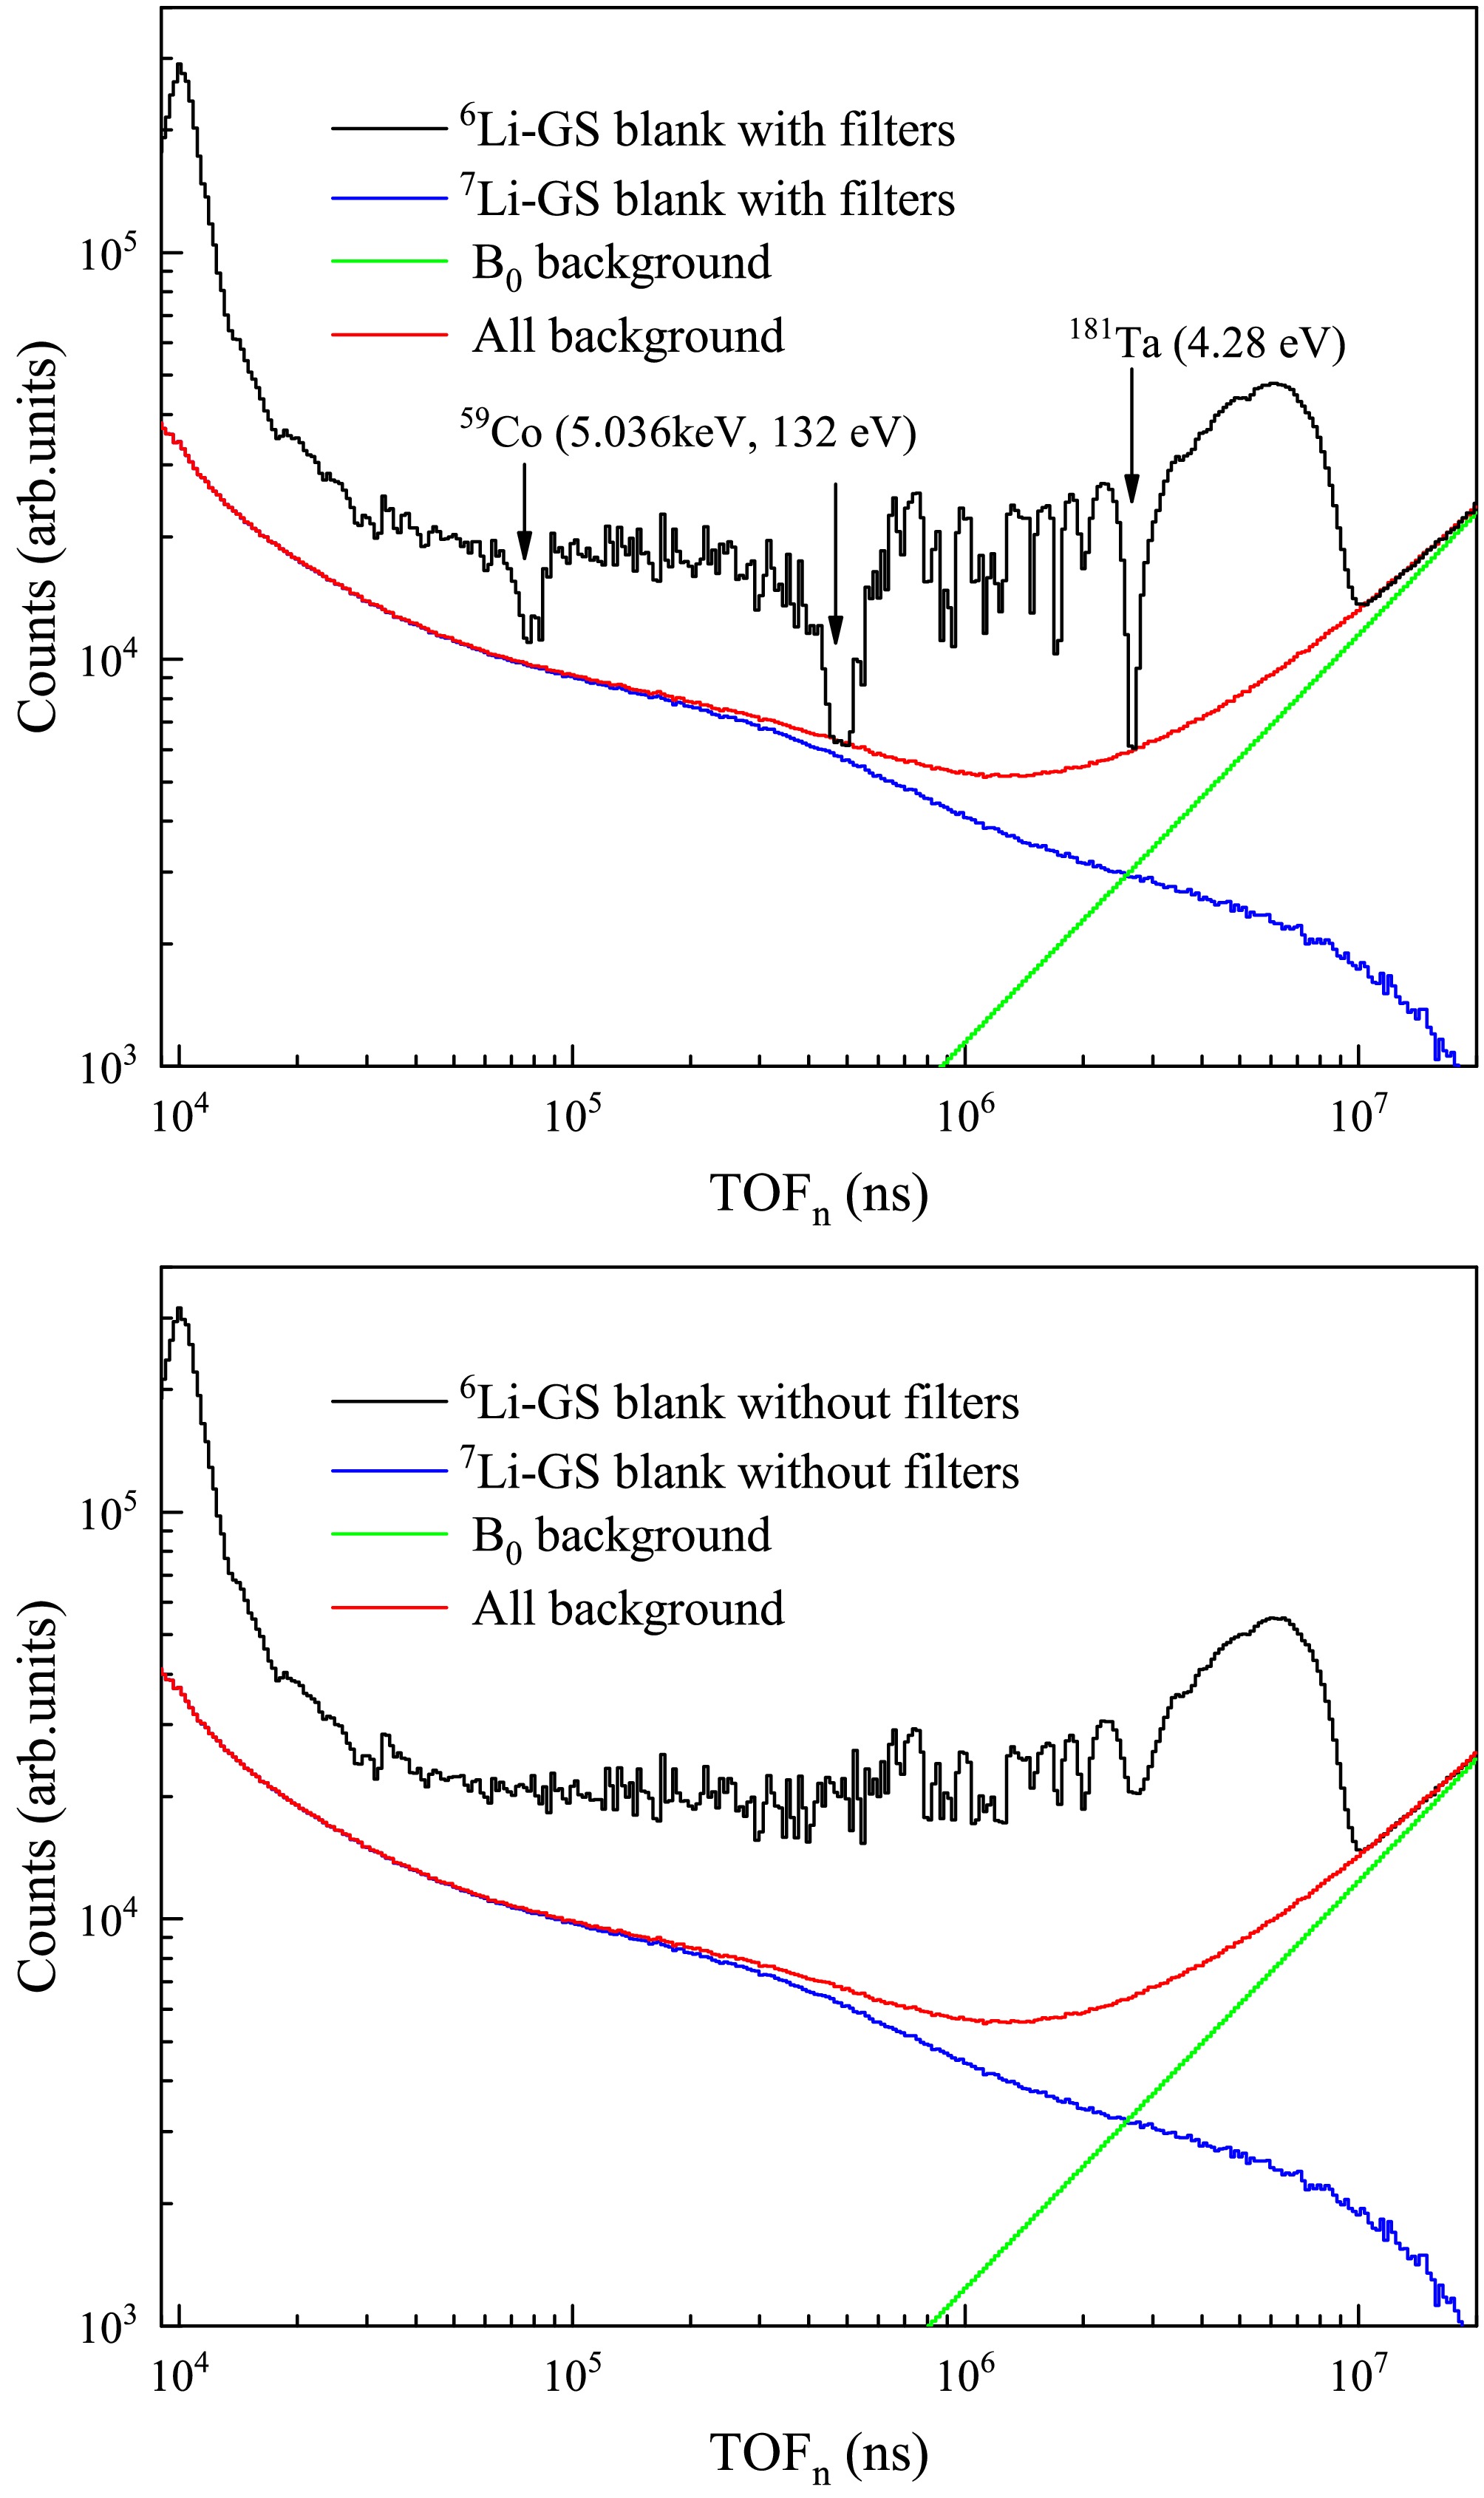
Figure 8. (color online) Background composition without sample measured by the 6Li-GS and 7Li-GS detector. Top panel: Background composition with filters. Bottom panel: Background composition without filters.
$ B_{\text{Li6out}} = B_{0\text{Li6out}} + \left[ C_{\text{Li7out}} - B_{0\text{Li7out}} \right] \times k_f / k_a $
(8) where
$ B_{\text{Li6out}} $ is the total background of the 6Li-GS detector without sample or filters.$ B_{0\text{Li6out}} $ is the flat background of the 6Li-GS detector.$ C_{\text{Li7out}} $ is the measured counts of the 7Li-GS, and$ B_{0\text{Li7out}} $ represents the flat background of the 7Li-GS detector.$ k_f $ is the normalization factor for in-beam γ ray, determined to be 0.42 from Eq. (7), similarly. As shown in Fig. 8, the top panel shows the background composition of the 6Li-GS detector with filters. The background curve passes through the obvious resonance peaks of 181Ta (4.28 eV) and 59Co (132 eV). And$ k_a $ is the attenuation factor of the in-beam γ-ray due to the filters. To determine the attenuation factor$ k_a $ , the in-beam γ-ray spectra with and without the filters were simulated using the Geant4 toolkit (version 10.7.4) [26–28]. As shown in Fig. 9, it shows the simulated γ-ray energy spectra measured by the 7Li-GS detector. Since the energy distribution of in-beam γ-ray remains invariant over different neutron flight time intervals [23],$ k_a $ is determined to be 0.91 [29]. The deviation between$ k_f / k_a $ and$ k_{\text{in}} $ is within 5%, indicating the accuracy of the simulation and validating the reliability of the background estimation based on Eq. (8).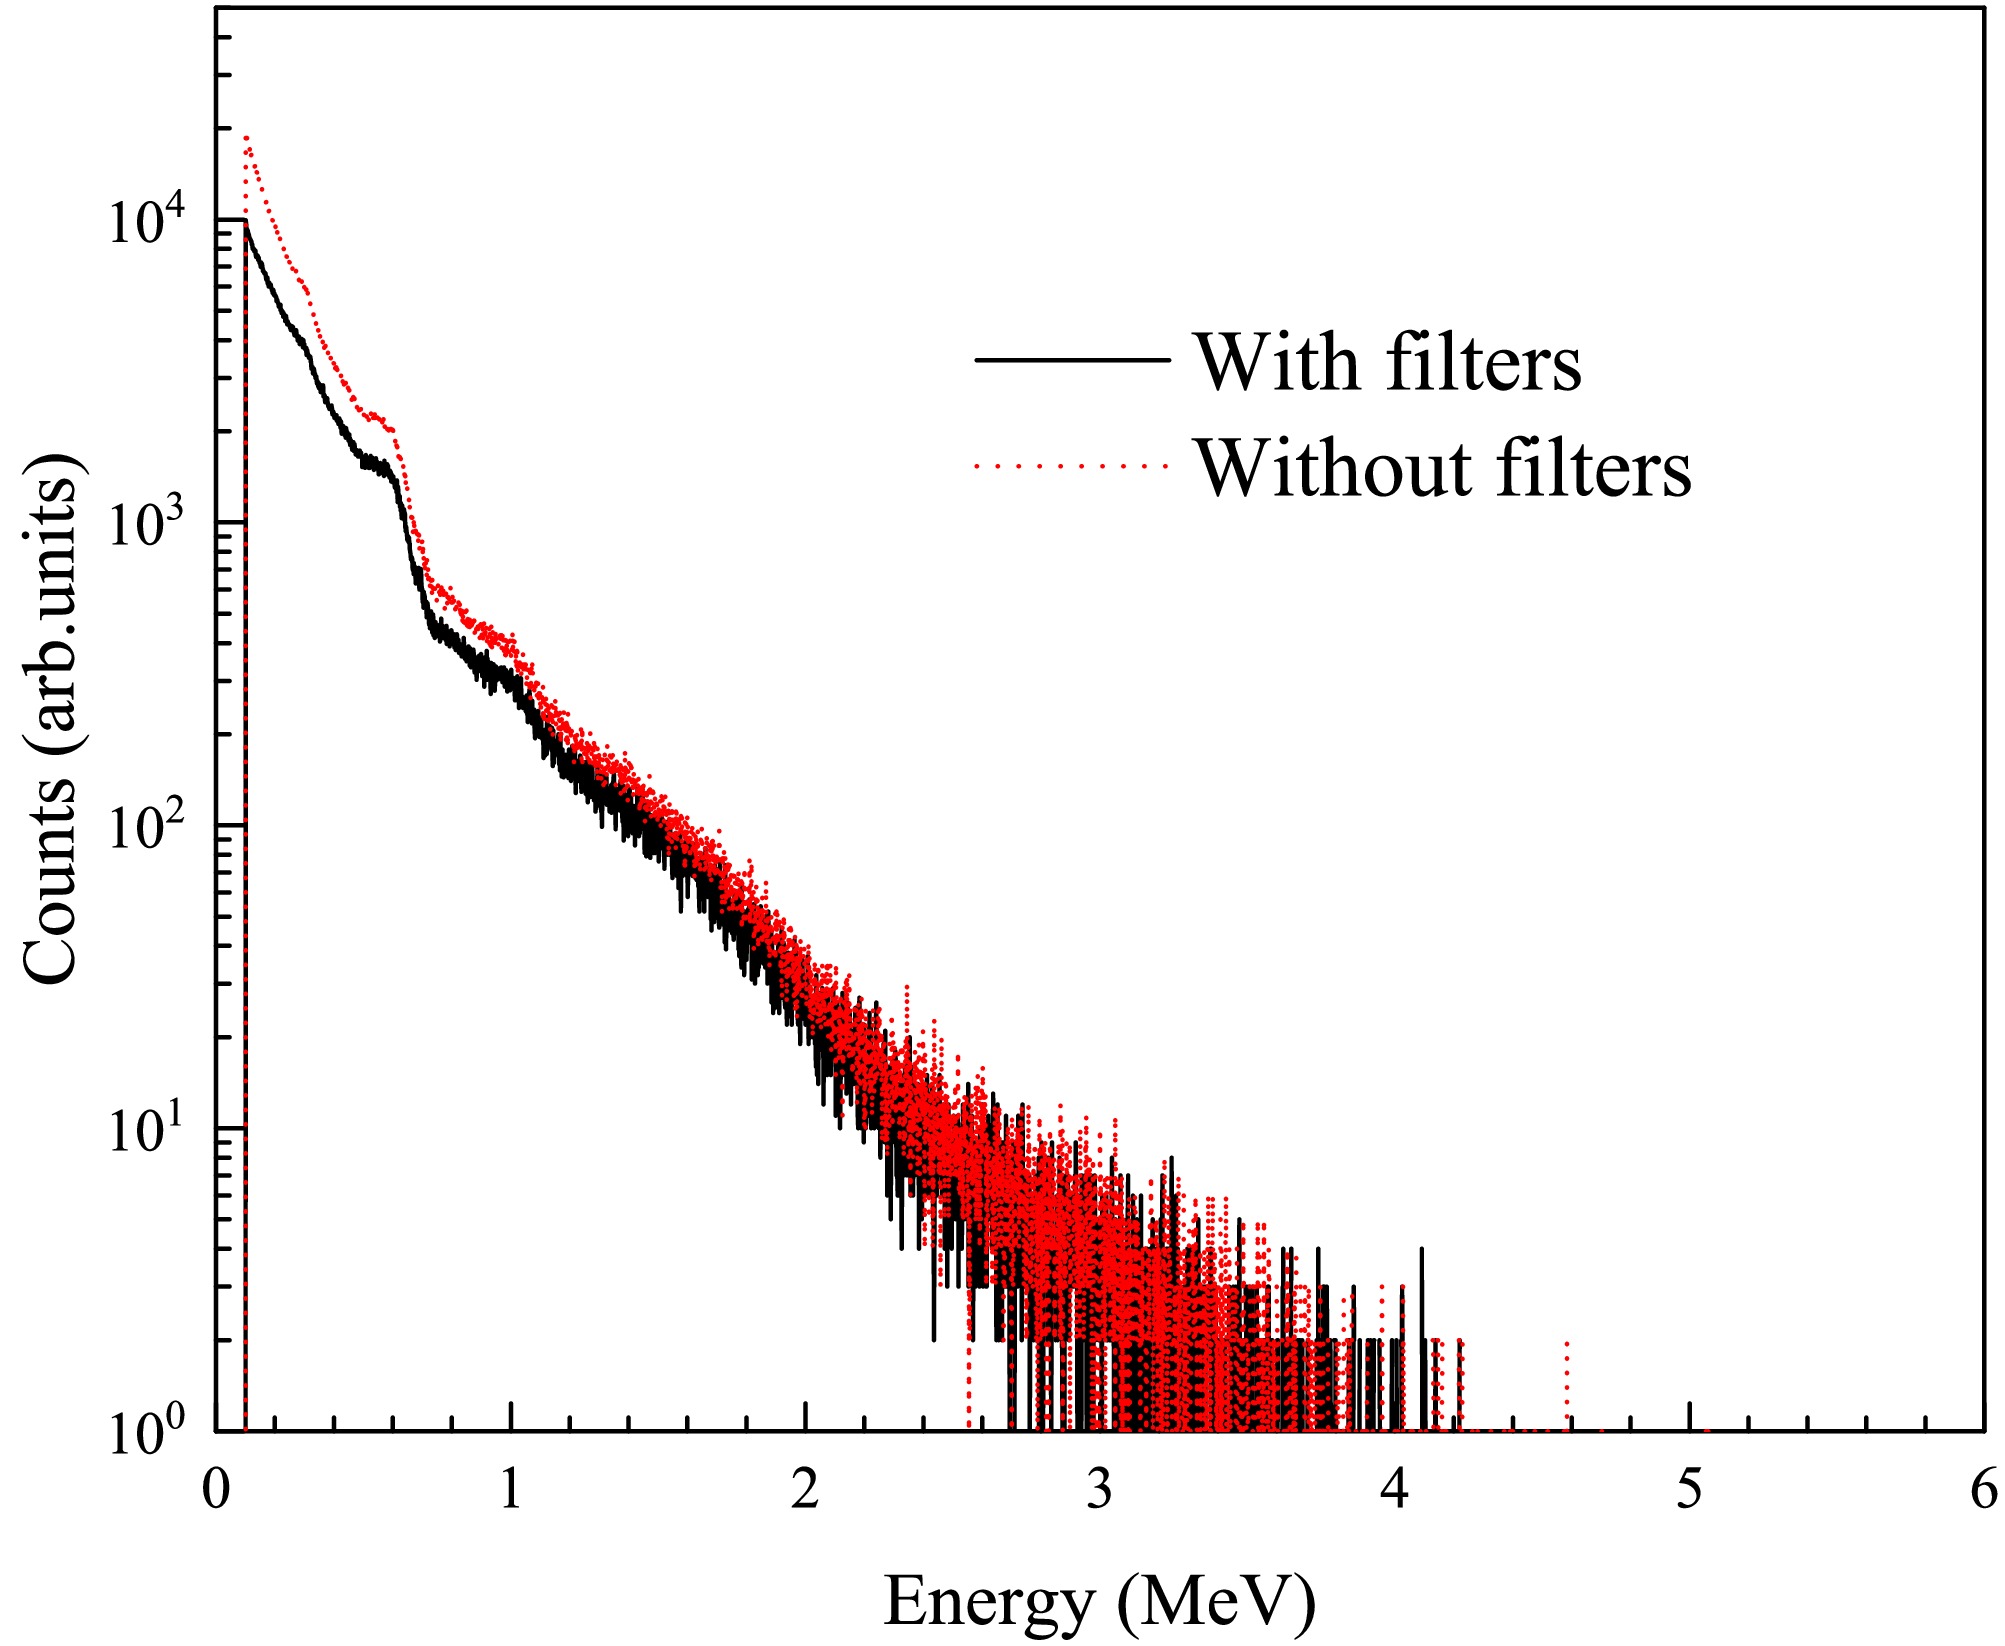
Figure 9. (color online) Simulated spectra of the in-beam γ-ray for the 7Li-GS detector. The solid line represents the values with filters, while the short-dashed line represents those without filters.
-
After background subtraction, the average neutron transmission (
$ \bar{T}_{\text{exp}} $ ) of 169Tm can be determined using Eq. (4). However, the cross section directly calculated by$ \bar{T}_{\text{exp}} $ does not represent the real average total cross section ($ \langle\sigma_t\rangle $ ). This work primarily focuses on the total cross section in the URR where individual resonance peaks overlap significantly, the experimental resolution may be insufficient to fully resolve them. According to the Hauser-Feshbach statistical model [30], the average total cross section$ \langle\sigma_t\rangle $ can be statistically estimated as$ \langle\sigma_t\rangle=\frac{1}{n}\ln\left(e^{-n\sigma_t}\right)+\frac{1}{n}\ln\left[1 + \frac{n^2}{2}\text{var}(\sigma_t)\pm\cdots\right] $
(9) As shown in Eq. (9), the first term corresponds to the quantity frequently misinterpreted as the experimental total cross section in high-resolution measurements. The additional terms, which are frequently neglected in theoretical treatments, provide corrections involving the variance of the cross section and higher-order statistical moments, thereby accounting for the contribution of unresolved resonances [31]. To incorporate the influence of resonant self-shielding in the URR, the self-shielding factor
$ (F_T) $ is applied to the average transmission. It can be expressed as:$ F_T = \frac{\overline{T}_{\text{exp}}(E_i)}{e^{-n\langle\sigma_t\rangle}}\approx 1+\frac{1}{2}n^2\text{var}(\sigma_t)\pm\cdots $
(10) The self-shielding correction factor was calculated using the SESH code developed by F. Fröhner, which employs Monte Carlo sampling based on statistically generated resonance parameters and utilizes nuclear properties such as level spacing and strength functions [32]. As shown in Fig. 10, the factor decreases with increasing neutron energy and follows a double-exponential decay, as given by
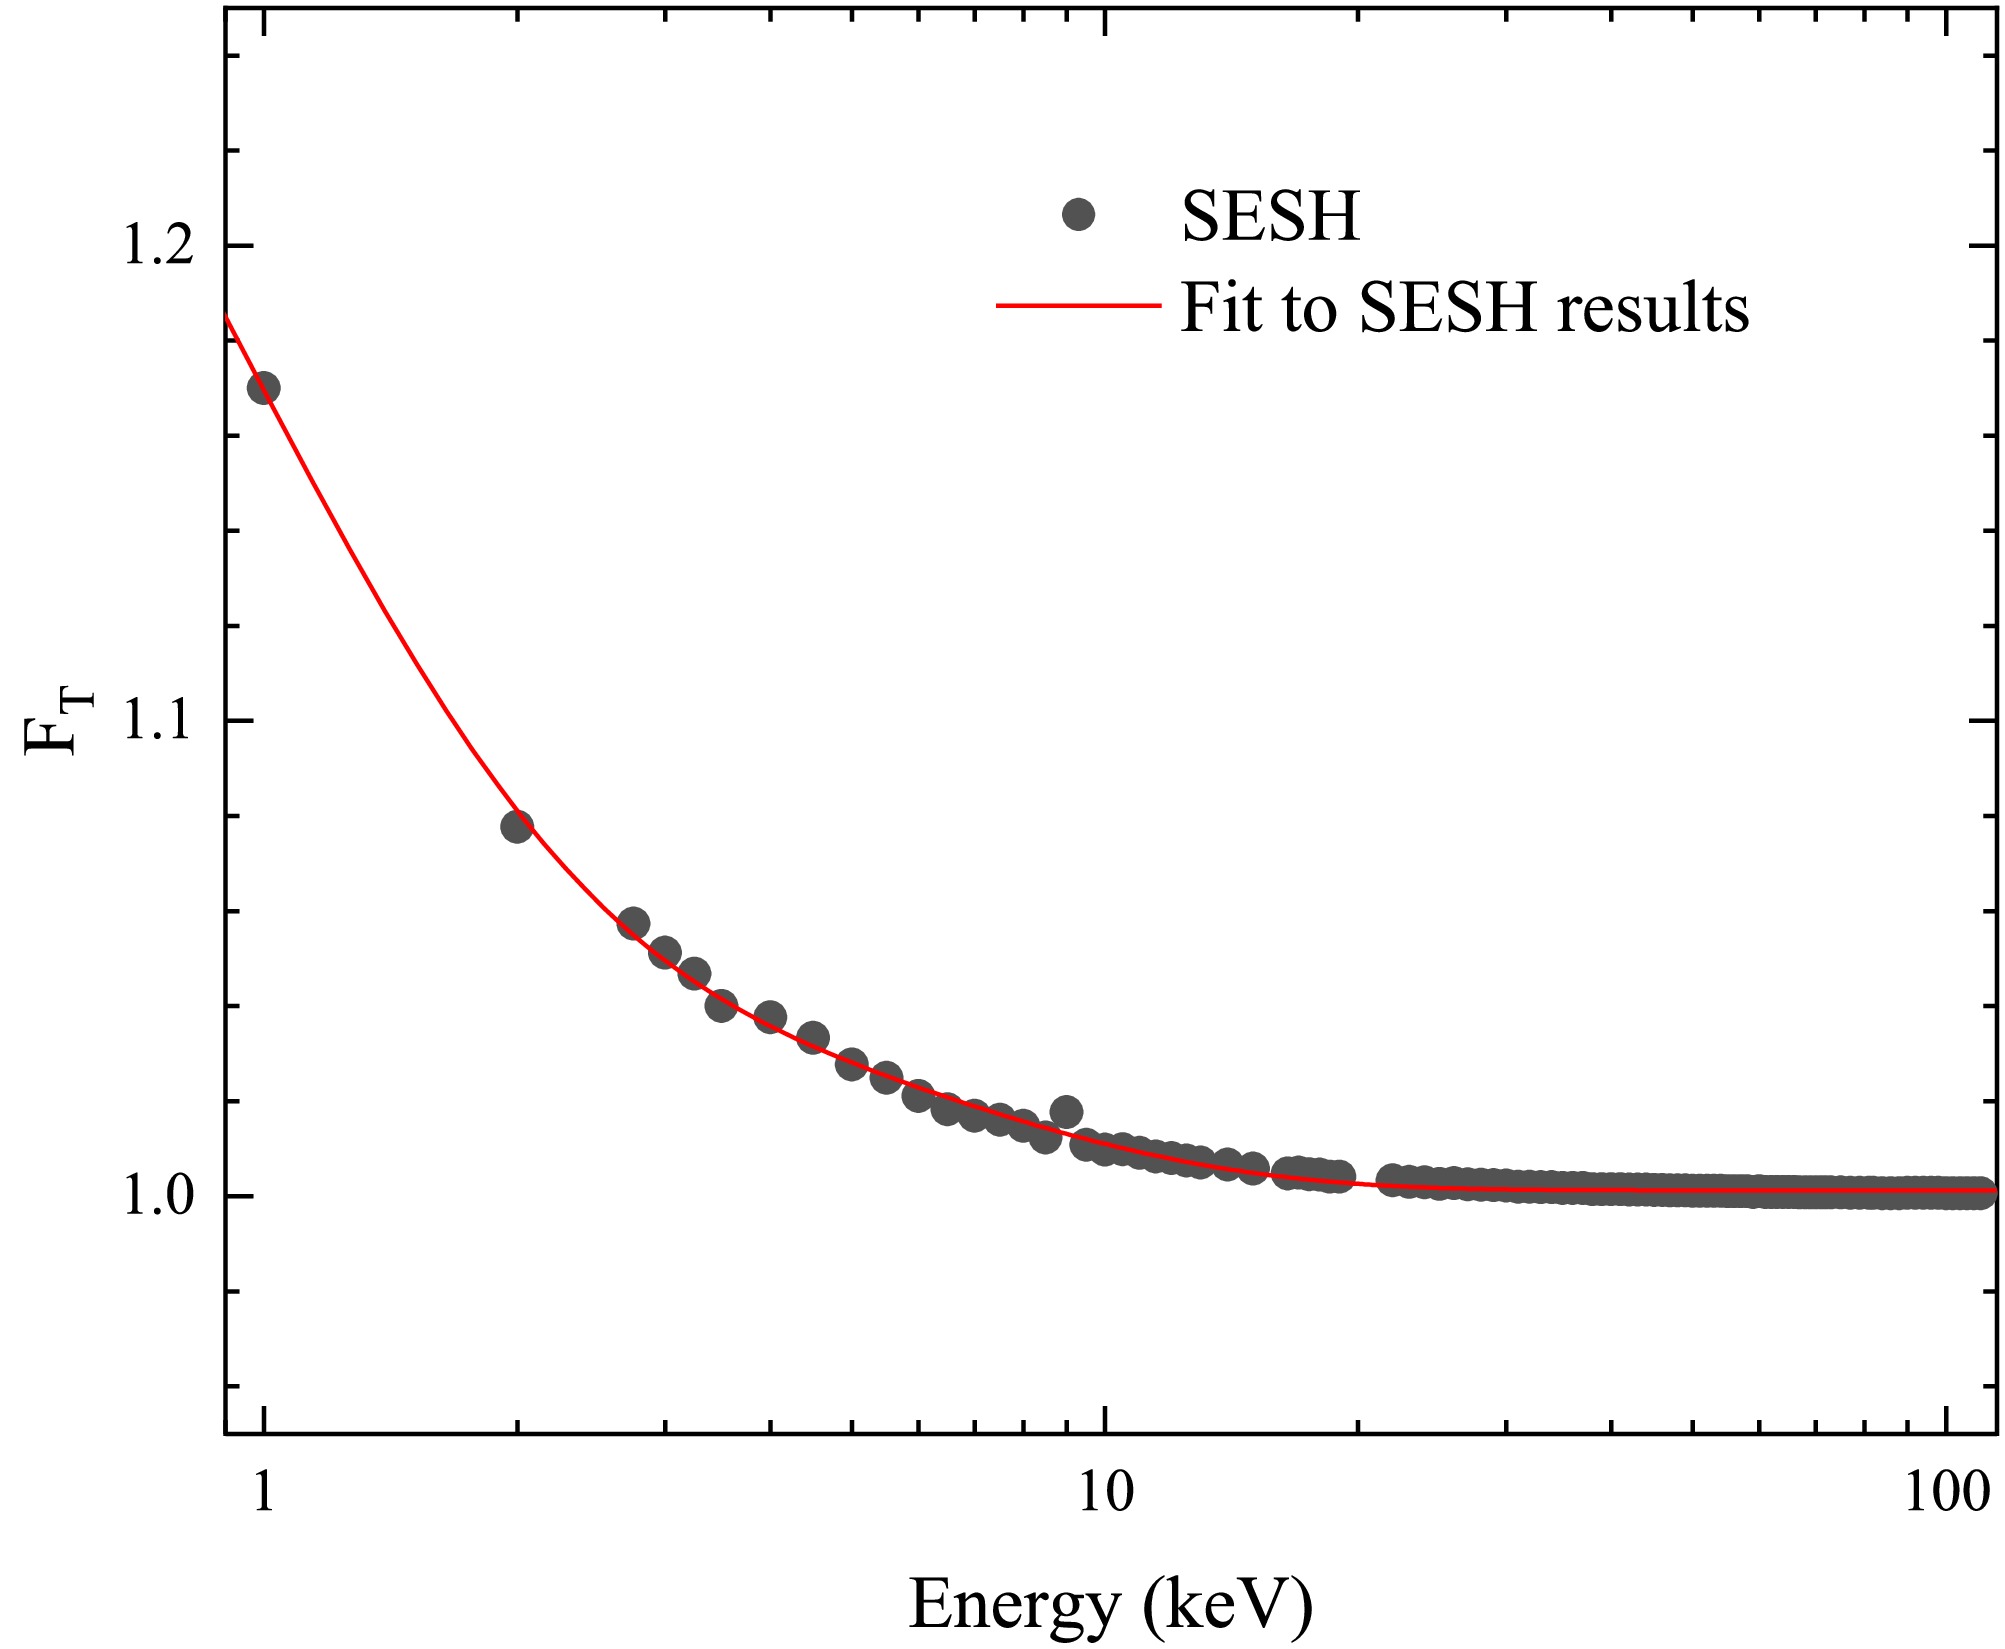
Figure 10. (color online) Self-shielding correction factor. Black points represent the SESH simulation, and the red curve shows the fit. The factor remains below 1.01 for neutron energies above 10 keV.
$ y = A_1\times e^{-x/a}+A_2\times e^{-x/b}+A_3 $
(11) where
$ A_1 $ = 0.375 ± 0.013, a = 0.823 ± 0.033,$ A_2 $ = 0.069 ± 0.003, b = 5.108±0.187,$ A_3 $ = 1.001 ± 0.001. As shown in Fig. 11, it shows a comparison between the transmission data with and without self-shielding correction. The corrected transmission is reduced to 0.87-0.99 of the original value. These results confirm that the application of the self-shielding correction significantly improves the accuracy and reliability of cross section measurements in the URR.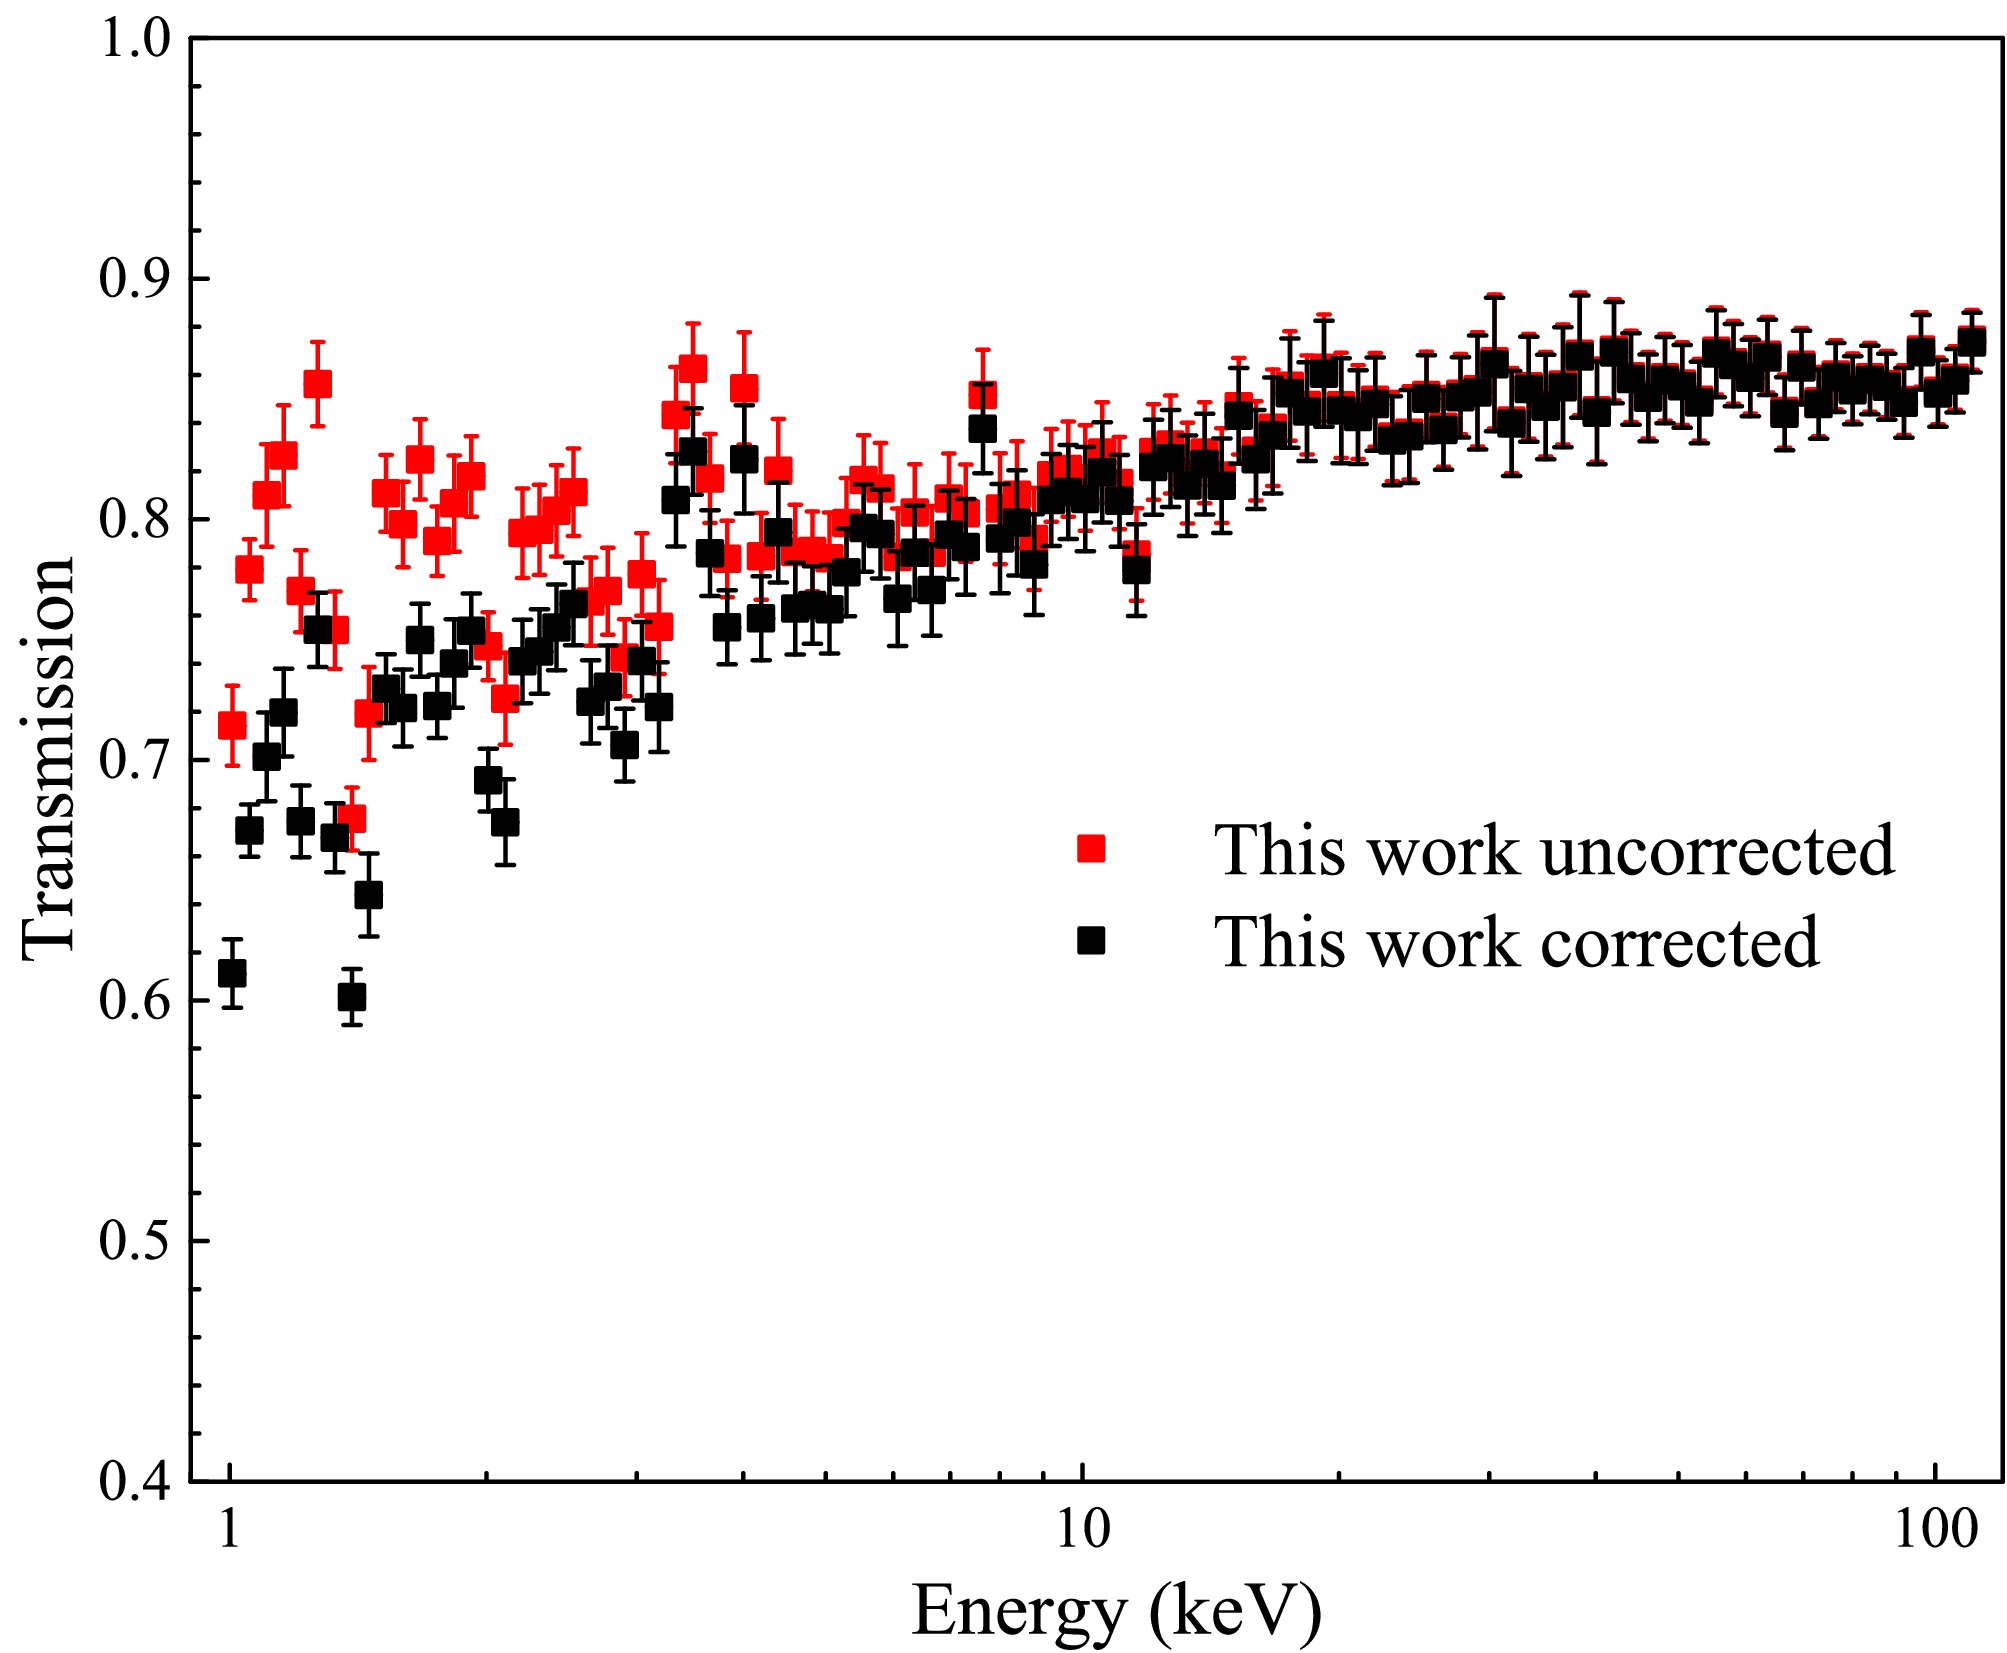
Figure 11. (color online) Comparison of corrected (black) and uncorrected (red) transmission from this work.
-
The average total cross section
$ \langle\sigma_t\rangle $ , defined through the sample areal density and the transmission corrected for self-shielding, can be given by$ \langle\sigma_t\rangle=-\frac{1}{n}\ln\left[\frac{T_{\text{exp}}(E_i)}{F_T}\right] $
(12) As shown in Fig. 12, the neutron energy grid is intentionally sparse in order to obtain average total cross sections and optical model parameters. The measured total cross section appears as a smooth curve and shows good agreement with both the evaluated nuclear data libraries and previous experimental results. In the energy range of 1-110 keV, it decreases from 33 b to 9 b, performing a generally declining trend. The results of this work can be used to fill the data gap in the 5-110 keV energy range. The measured value at 2.0 keV is 11% higher than that obtained by V. P. Vertebnyy [7], whereas at 2.7 keV, it is 13% lower than that reported by W. Dilg [8]. Among the evaluated libraries, the present results show the closest agreement with JENDL-5 evaluations. Minor deviations are observed from other evaluated libraries, with most points lying slightly above JEFF-3.3, and slightly below ENDF/B-VIII.1.
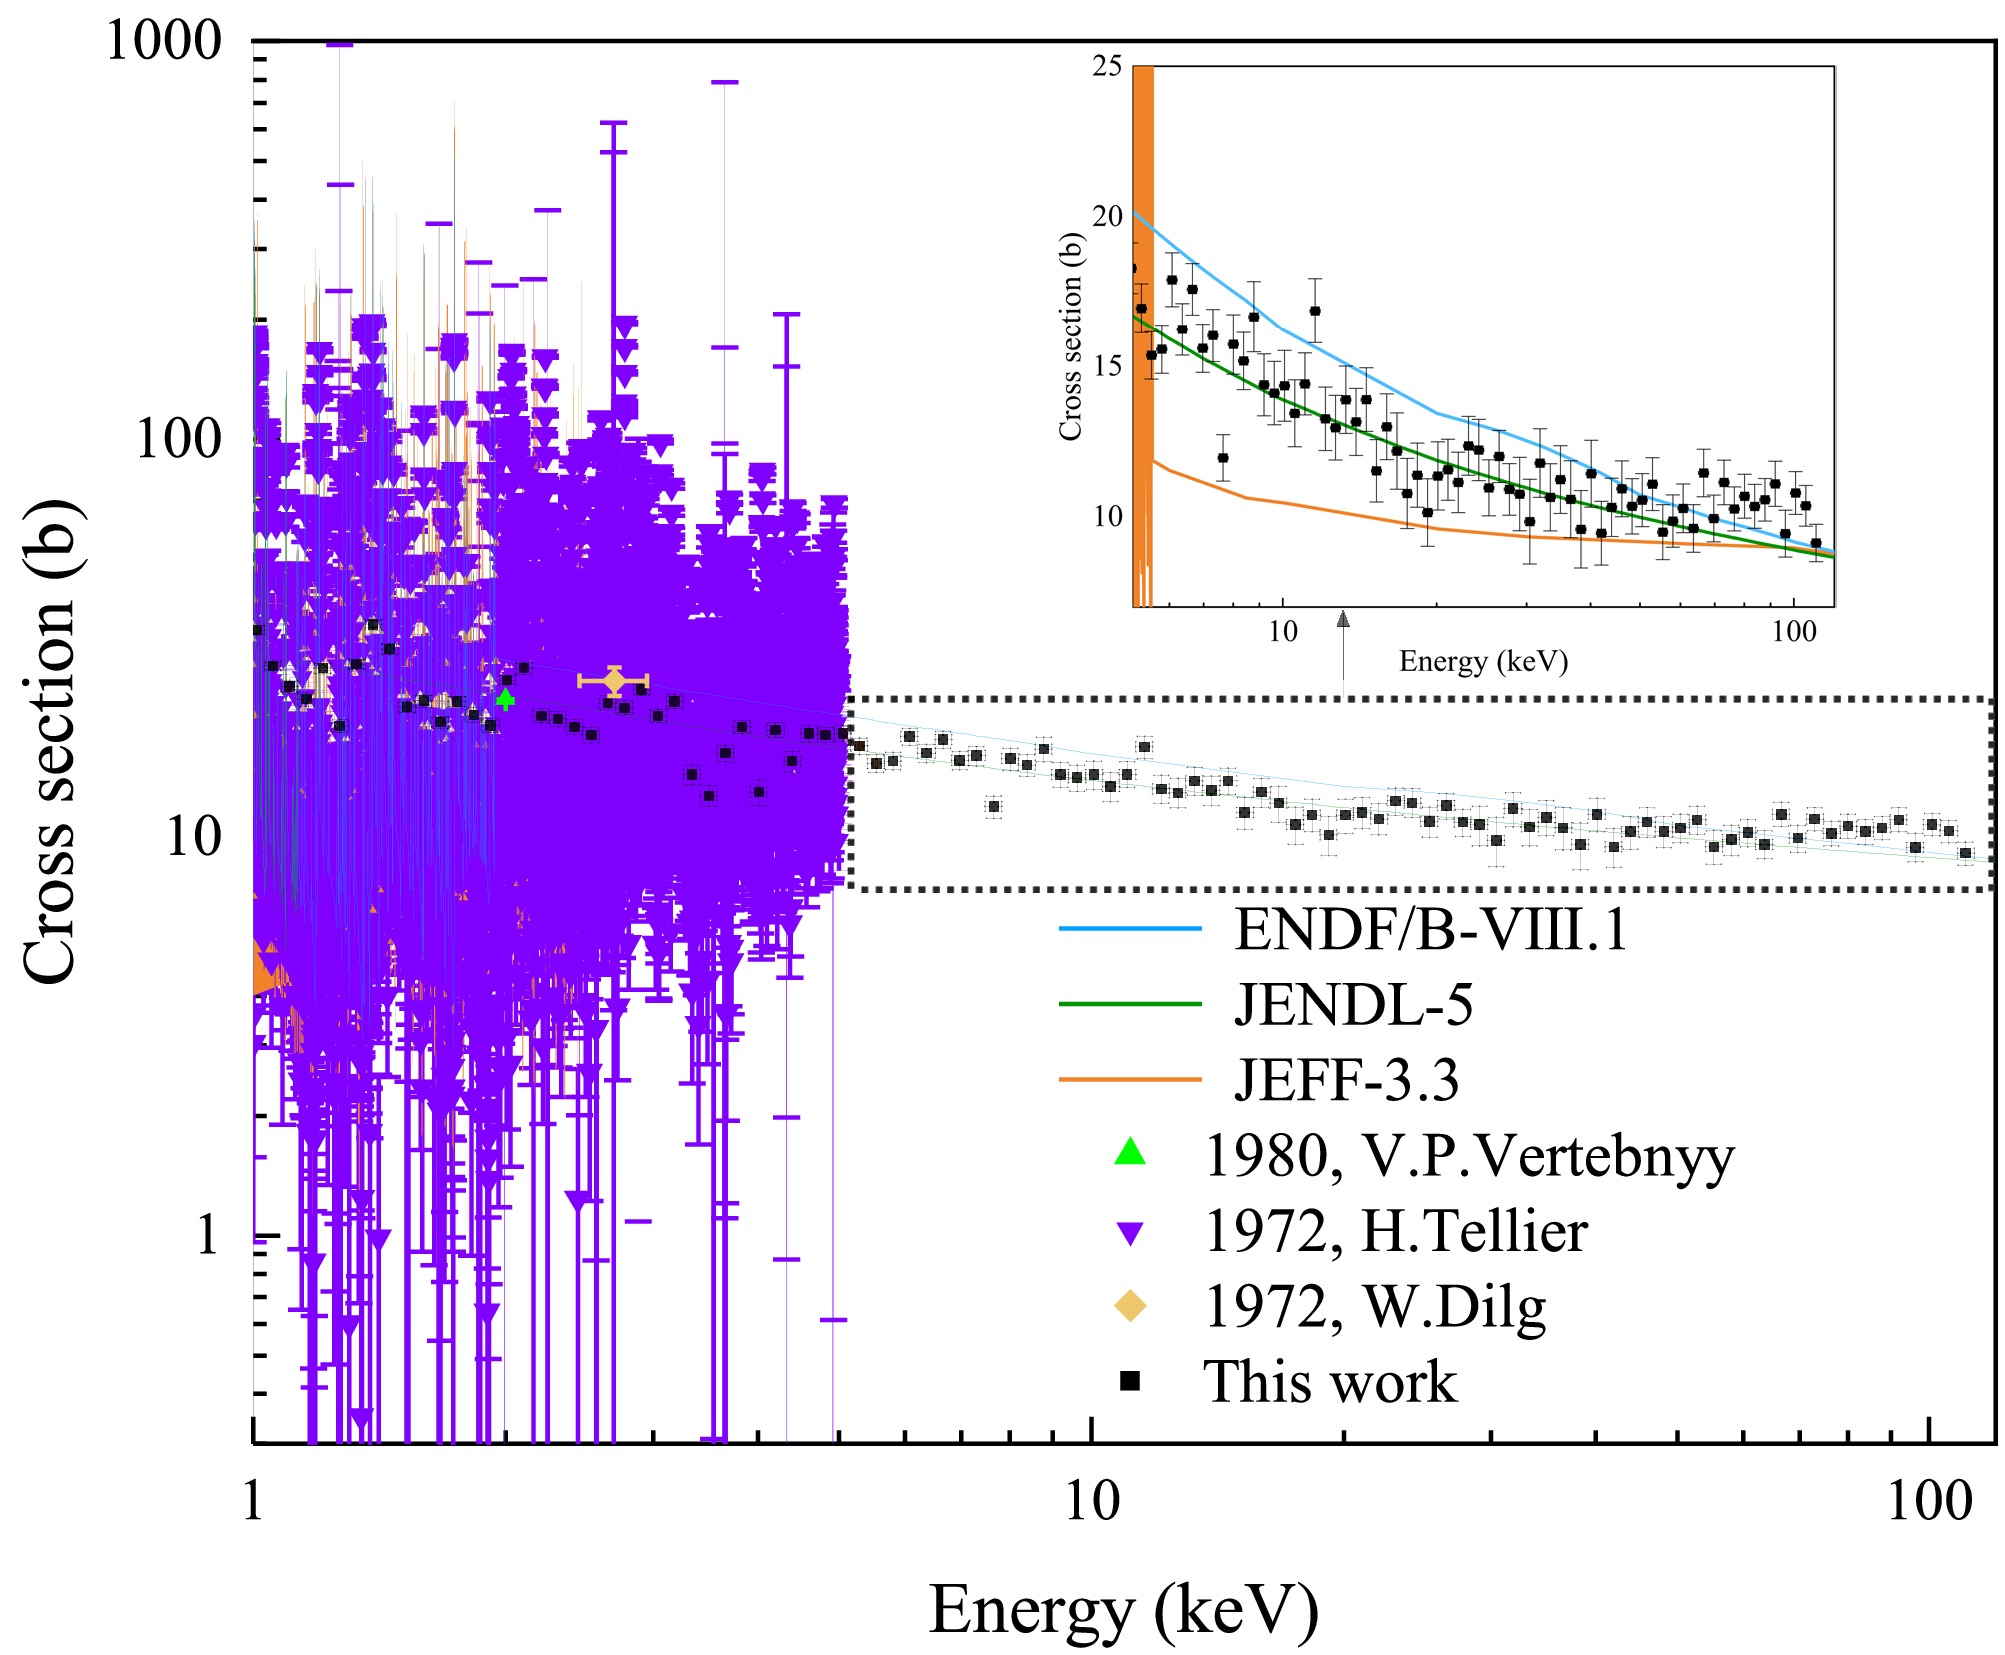
Figure 12. (color online) Neutron total cross section measured in this work compared with ENDF/B-VIII.1 (blue), JENDL-5 (green), JEFF-3.3 (orange) evaluations and EXFOR data.
-
The uncertainty analysis is primarily divided into two parts: the energy uncertainty and the cross section uncertainty. As shown in Eq. (3), the main uncertainties in the TOF neutron energy measurement stem from the flight time (
$ \Delta TOF $ ) and flight length ($ \Delta L $ ). In the measurements, the proton beam pulse width was approximately 42 ns. According to the uncertainty propagation law, the energy uncertainty was calculated as$ \frac{\Delta E}{E}=2\times\sqrt{\left(\frac{\Delta L}{L}\right)^2+\left(\frac{\Delta TOF}{TOF}\right)^2} $
(13) The relative uncertainty of the measured energy points is within 0.50%. The uncertainty in neutron transmission primarily arises from the statistical errors of the measured counts with and without the sample, it can be expressed as
$ \begin{aligned}[b] \left(\frac{\Delta T}{T}\right)^2 =\;& \left(\frac{\Delta C_{in}}{C_{in}-B_{in}}\right)^2 + \left(\frac{\Delta B_{in}}{C_{in}-B_{in}}\right)^2 \\ &+ \left(\frac{\Delta C_{out}}{C_{out}-B_{out}}\right)^2 + \left(\frac{\Delta B_{out}}{C_{out}-B_{out}}\right)^2 \end{aligned} $
(14) All uncertainties are propagated based on single-σ counting statistics. Where
$ \Delta T $ is the standard uncertainty of neutron transmission,$ \Delta C_{in} $ ,$ \Delta C_{out} $ ,$ \Delta B_{in} $ and$ \Delta B_{out} $ represent the statistical uncertainties of the 6Li-GS detector and 7Li-GS detector counts under the sample-in and sample-out conditions, respectively. The relative uncertainty of the transmission is below 2.0%. The relative uncertainty of cross section is expressed as$ \frac{\Delta\sigma_t}{\sigma_t}=-\frac{1}{\ln T}\cdot\left[\left(\frac{\Delta T}{T}\right)^2 + (\ln T)^2\left(\frac{\Delta n}{n}\right)^2\right]^{\frac{1}{2}} $
(15) where
$ \Delta n $ is the standard uncertainty of the areal density of the sample. The relative uncertainty areal density is approximately 0.19%, which is negligible compared to the uncertainty of the transmission. In the energy range of 1 keV to 3 keV, the relative uncertainty of the total cross section remained below 5%. In the energy range of 3 keV to 110 keV, most of the uncertainties are below 10%. -
In this study, the excitation function of the 169Tm (n,tot) was calculated using the TALYS-2.0 code. The global optical model parameters (OMP) proposed by Koning and Delaroche were adopted with the default level density model of the code, which combines the constant temperature model and the Fermi gas model (ldmodel = 1). The photon strength function was described using the Simplified Modified Lorentzian model (SMLO, strength = 9) [14, 33]. Given the strong sensitivity of the neutron total cross section to OMPs, key parameters including the potential depths, radii, and diffusenesses of both the real and imaginary components were fine-tuned to enhance agreement with experimental data in the 1-110 keV energy range [33]. The adjusted parameters summarized in Table 2 were scaled by factors ranging from 0.9 to 1.15, while all other input settings were kept at default values. Notably, the radius (
$ r_{{\rm{v}}} $ ) of the real volume potential was reduced by 10%, while its diffuseness ($ a_{{\rm{v}}} $ ) increased by 8%. Enhancements to the terms (rwd, awd,$ d_1 $ ,$ d_2 $ ) further strengthened neutron absorption in the energy region. Coupled-channels calculations were extended to include the$ 0^+-2^+-4^+-6^+-8^+ $ states by setting maxrot = 4.Parameter Unit Default Value Adjusted value Factor $ a_{V} $ fm $ 0.653 $ $ 0.705 $ $ 1.08 $ $ r_{V} $ fm $ 1.231 $ $ 1.108 $ $ 0.90 $ $ rvd $ fm $ 1.255 $ $ 1.443 $ $ 1.15 $ $ rwd $ fm $ 1.255 $ $ 1.443 $ $ 1.15 $ $ awd $ fm $ 0.517 $ $ 0.705 $ $ 1.10 $ $ d_{1} $ MeV $ 13.065 $ $ 14.372 $ $ 1.10 $ $ d_{2} $ MeV-1 $ 0.0186 $ $ 0.0205 $ $ 1.10 $ — — 2 4 — Table 2. Optical model parameters of unit, default value, adjusted value and factor are listed.
As shown in Fig. 13, both the default TALYS-2.0 results and the TENDL-2023 evaluations significantly underestimate the experimental data, whereas the calculations using optimized parameters reproduce the measured values more accurately. These improvements demonstrate not only better consistency with experimental results but also a more realistic description of the neutron total cross section of 169Tm. These optimized parameters serve as valuable reference for future neutron total cross section calculations of 169Tm and further refinement of optical model parameters.
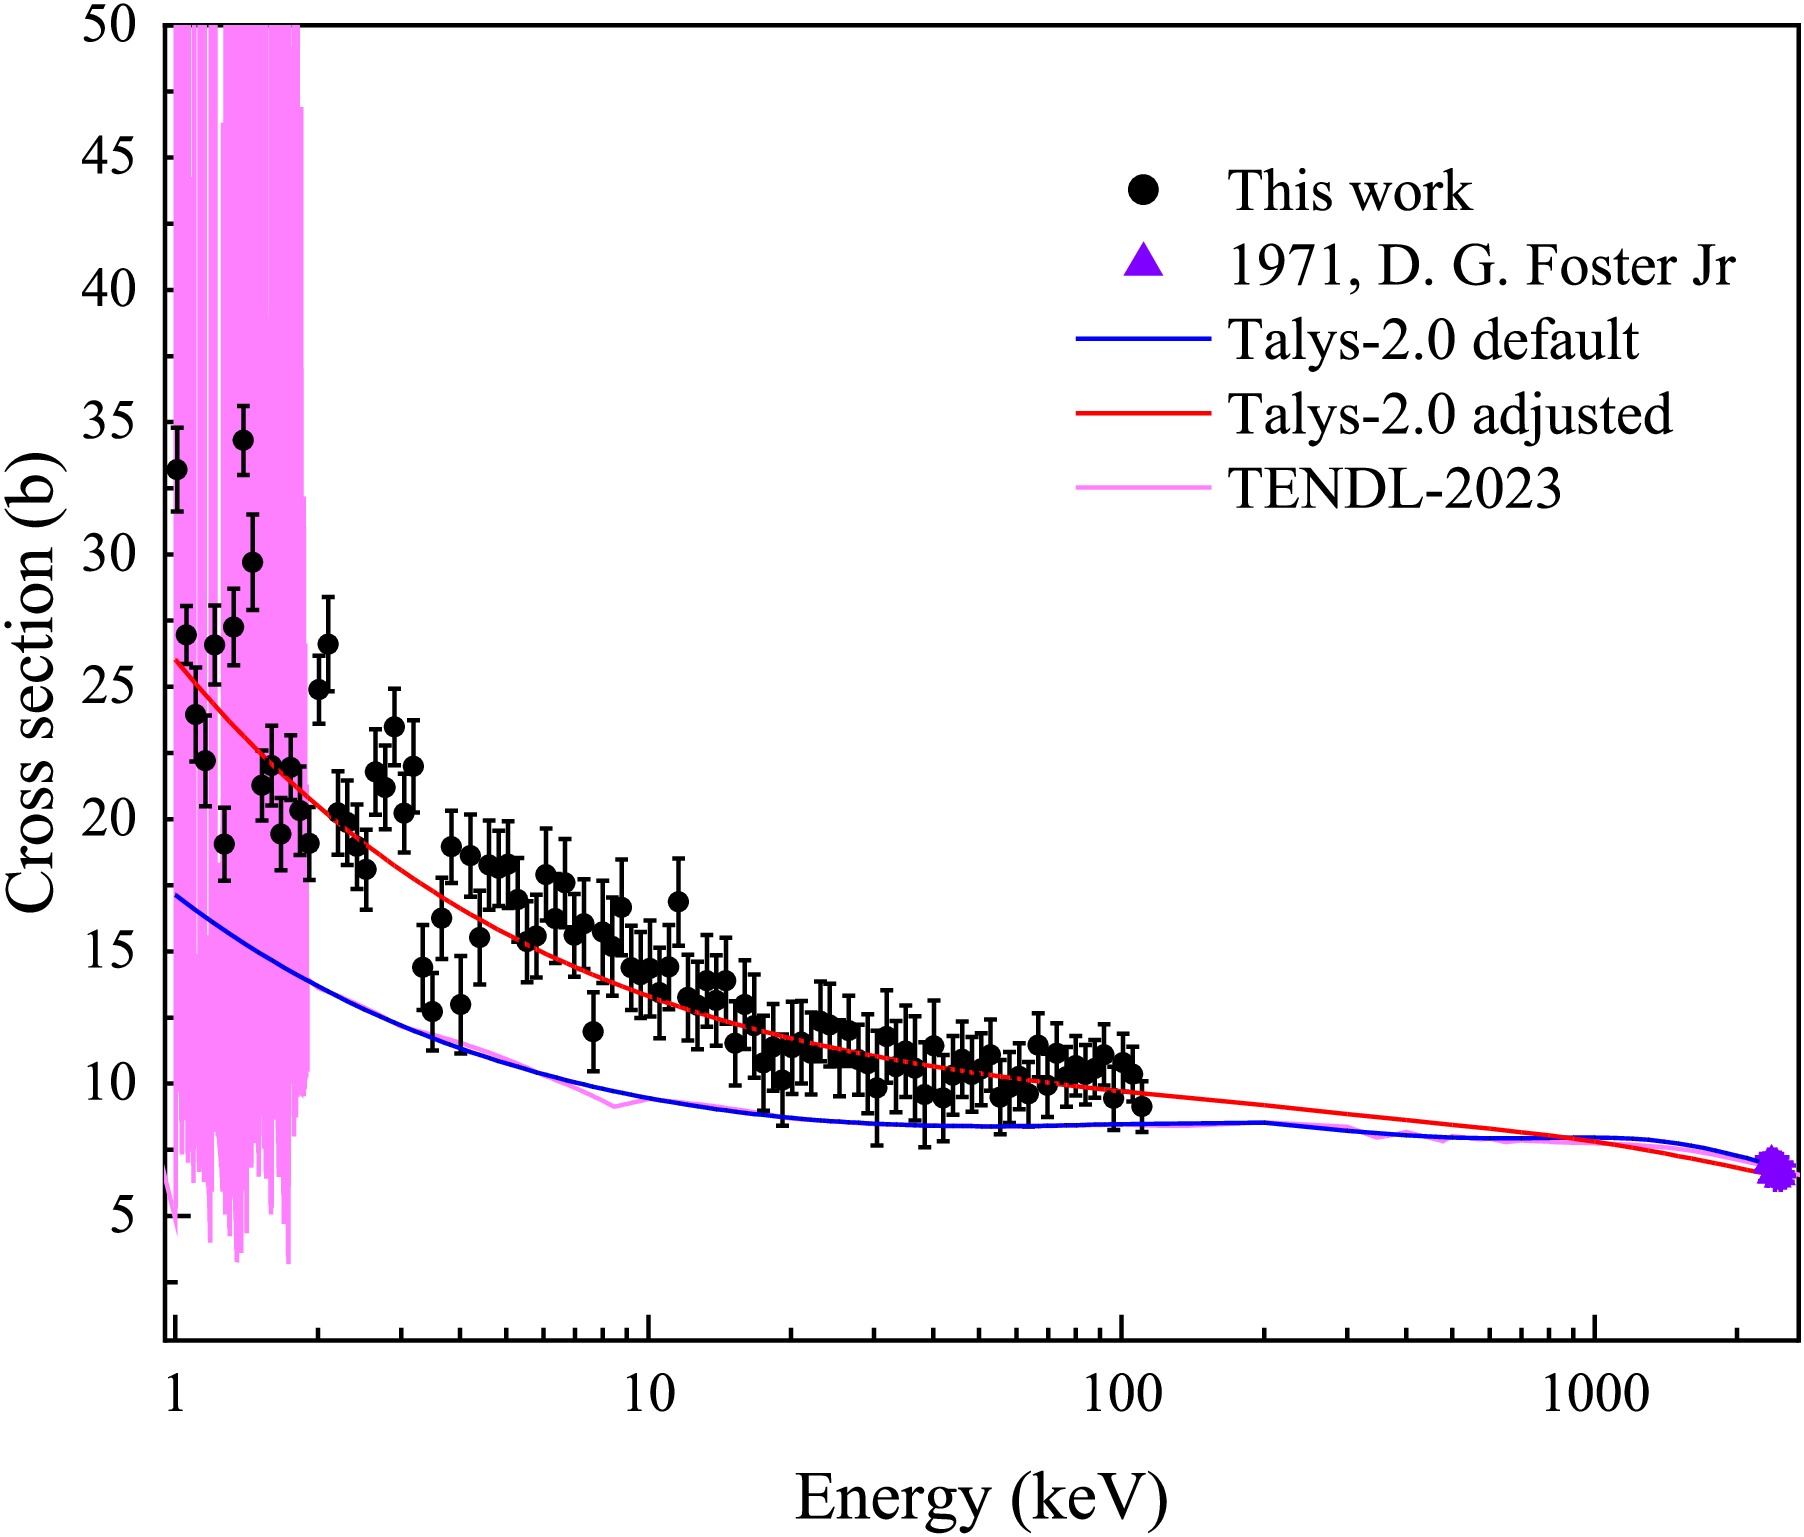
Figure 13. (color online) Experimental data in the 1–110 keV range (black) compared with TALYS-2.0 calculations using default (blue) and adjusted (red) parameters, and with evaluated data from TENDL-2023 (pink). When extended to 2.5 MeV, the adjusted parameters yield cross section consistent with the results of D. G. Foster Jr. [34] in the 2.3–2.5 MeV range, with deviations mostly below 5%.
-
The neutron total cross section of 169Tm was measured in the energy range of 1-110 keV at the CSNS Back-n facility using a wing-shaped lithium glass detector. The in-beam γ-ray background was quantitatively determined by combining the saturated resonance absorption technique with Monte Carlo simulations. Experimental neutron transmissions were obtained after dead-time correction, normalization, and background subtraction, with a relative uncertainty maintained within 2%. Self-shielding correction factors were calculated using the SESH code to derive the average total cross section. In the 1-110 keV energy range, most of corrected results show good agreement with JENDL-5 evaluations, lying above TENDL-2023 evaluations, JEFF-3.3 evaluations and below ENDF/B-VIII.1 evaluations. The relative uncertainty of the total cross section was maintained below 5% in the 1 - 3 keV energy range and below 10% in the 3 - 110 keV energy range. The total cross section calculated using the TALYS-2.0 code with optimized optical model parameters agree well with the experimental results and the data of D. G. Foster Jr in the 2.3 - 2.5 MeV energy range, with most deviations within 5%.
Based on the present study, a systematic methodology for data acquisition and analysis has been established for neutron total cross section measurement with the wing-shaped lithium glass detector. However, there are several aspects requiring further improvement in the future. Firstly, transmission experiments with samples of different thicknesses will be used to improve the accuracy of total cross section measurements. Secondly, the thickness of the lithium glass scintillator used in this work is 4.0 mm, which results in excessively high detection efficiency and large measurement dead-time. The next step will involve optimizing the thickness of the lithium glass scintillator to reduce the dead-time and expand the measurable neutron energy range.
-
The authors thank the staff members of the Back-n white neutron facility at the China Spallation Neutron Source (CSNS) for providing technical support and assistance in data collection and analysis.
Measurement of the neutron total cross section of 169Tm in the energy range of 1-110 keV and recommendation of optical model parameters
- Received Date: 2025-10-30
- Available Online: 2026-04-01
Abstract: The neutron total cross section ($ \sigma_{t} $) of 169Tm is of considerable importance for nuclear reactor designs and nuclear technology applications. However, the $ \sigma_{t} $ of 169Tm is unavailable in the 5 keV to 2.3 MeV energy range in the Experimental Nuclear Reaction Data library and it shows significant discrepancies among different Evaluated Nuclear Data libraries in the keV region. To clarify the discrepancies in the $ \sigma_{t} $ of 169Tm in the keV energy region, a new measurement was performed at the back-streaming white neutron beamline of the China Spallation Neutron Source using the transmission method and the time-of-flight technique. The experimental background was quantitatively determined using the saturated resonance absorption technique with a 7Li-glass scintillator. As a result, the $ \sigma_{t} $ of 169Tm in the 1-110 keV energy range was obtained, which shows good agreement with the evaluated data in the JENDL-5 library. The optical model calculations agree well with the results and the fine-tuned optical model parameters in TALYS validated against the 2.3–2.5 MeV data reported by D. G. Foster Jr., with deviations below 5%. The results fill the experimental gap in the 5–110 keV range, which provide valuable input for nuclear reaction studies and nuclear data evaluations.


 DownLoad: