


 Abstract
 HTML
HTML Reference
 Related
 PDF
PDF


-
Chromium (Cr), essential in stainless steel, is key for Accident Tolerant Fuel (ATF) coatings[1, 2], structural materials in Gen IV reactors[3, 4], and Accelerator-Driven System (ADS)[5],attracting broad interests in the nuclear data research. Natural Cr consists of four isotopes, namely
$^{50}{\rm{Cr}}$ (4.345%),$^{52}{\rm{Cr}}$ (83.789%),$^{53}{\rm{Cr}}$ (9.501%), and$^{54}{\rm{Cr}}$ (2.365%). Extensive nuclear data evaluations for these isotopes have been performed as listed in Table 1. The evaluations of n+$^{50,52,53,54}{\rm{Cr}}$ reactions are included in the major evaluation libraries, and the nuclear reaction cross sections for important channels$(n,el)$ ,$(n,inl)$ ,$(n,\gamma)$ ,$(n,p)$ ,$(n,2n)$ , angular distributions and double differential cross sections for particle emission are provided. In addition, in the recent study of International Nuclear Data Evaluation Network (INDEN) in IAEA, the neutron data of$^{52}{\rm{Cr}}$ in good quality are also presented.Major Libraries Place Year First Author Energy Information of evaluation Ref. INDEN-Aug2023 IAEA 2020 G. Nobre 200 MeV New evaluation from BNL, ORNL, IAEA [6] ENDF/B-VIII.1 USA 2024 G. Nobre 65 MeV Taken from INDEN-Aug2023 [7] JEFF-4.0 Europe 2025 G. Nobre 65 MeV Taken from ENDF/B-VIII.1 [8] JENDL-5 Japan 2021 N. Iwamoto 200 MeV Evaluated in 2009 and revised in 2021 by N. Iwamoto [9] CENDL-3.2 China 2020 B.S. YU 20 MeV Evaluated by Bao-Sheng YU in 1991;
Revised by Haicheng WU in 2009[10] BROND-3.1 Russia 2016 V. G. Pronyaev 20 MeV
(For$^{50}$ Cr 150 MeV)50,54Cr: Taken from ENDF/B-VII.1 (S. Chiba);
52Cr: 1995 by V.G. Pronyaev;
53Cr: Mainly from JENDL-3.0 (S. Chiba, 1997)[11] TENDL-2023 IAEA 2023 A.J. Koning 200 MeV Evaluated by TALYS [12] Note: All abbreviations are defined in Appendix A. Table 1. The evaluation status of n+
$^{50,52,53,54} {\rm{Cr}}$ in major libraries.Significant discrepancies still exist between the evaluated data and measurements. Taking the
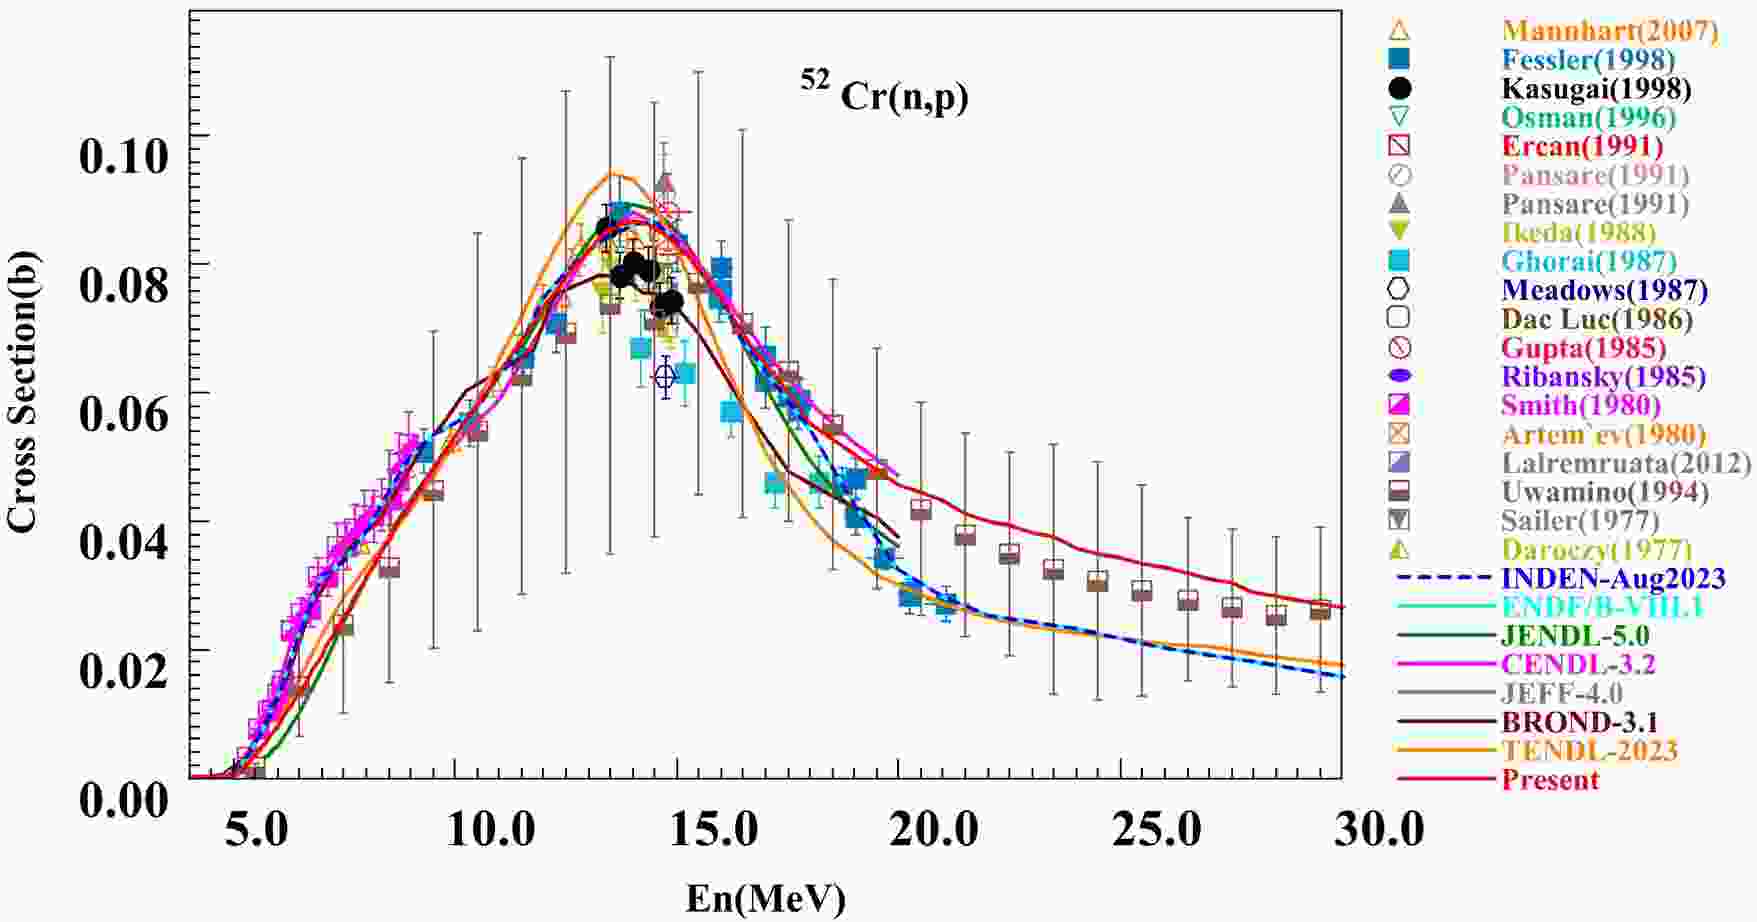
$^{52}{\rm{Cr}}(n,p)$ reaction cross sections as an example, significant discrepancies can be observed above neutron energy 14 MeV, as shown in Fig. 1. At the same time, as for the$^{52}{\rm{Cr}}(n,2n)$ reaction, the experimental data for the neutron energy surpass 15 MeV exhibit substantial discrepancies up to 200 mb, as illustrated in Fig. 2, which deduce the big difference for various libraries. Therefore, more elaborate study to understand these differences are required.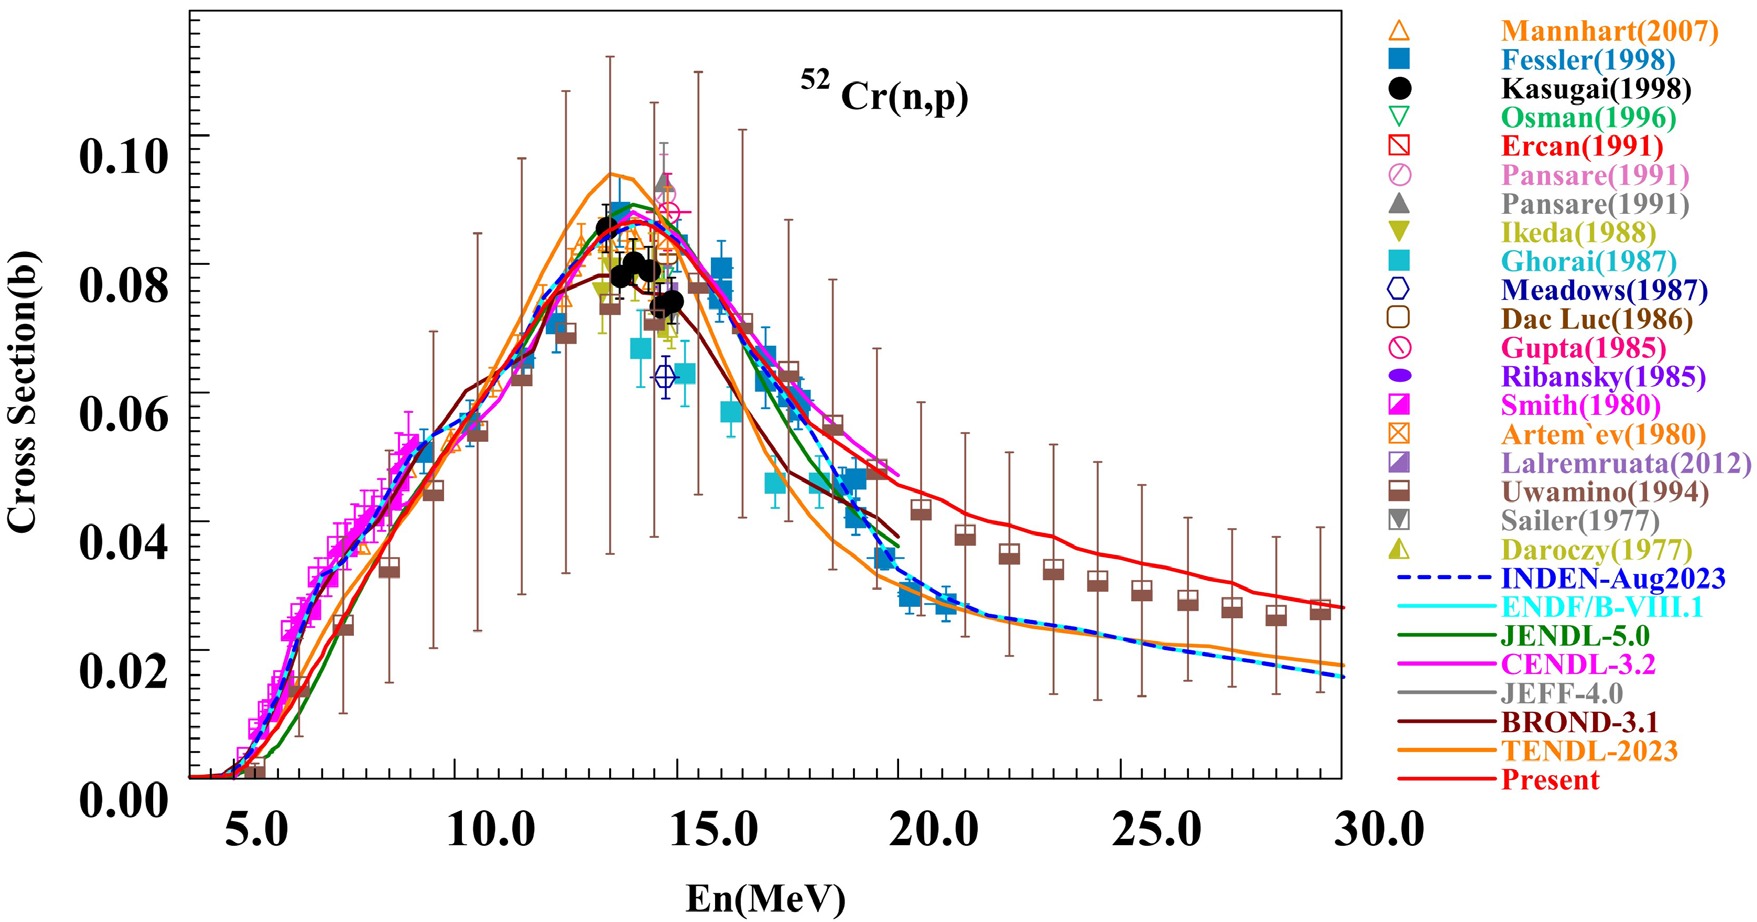
Figure 1. (color online) Experimental and evaluated data of protect
$^{52} {\rm{Cr}}(n, p)$ cross sections.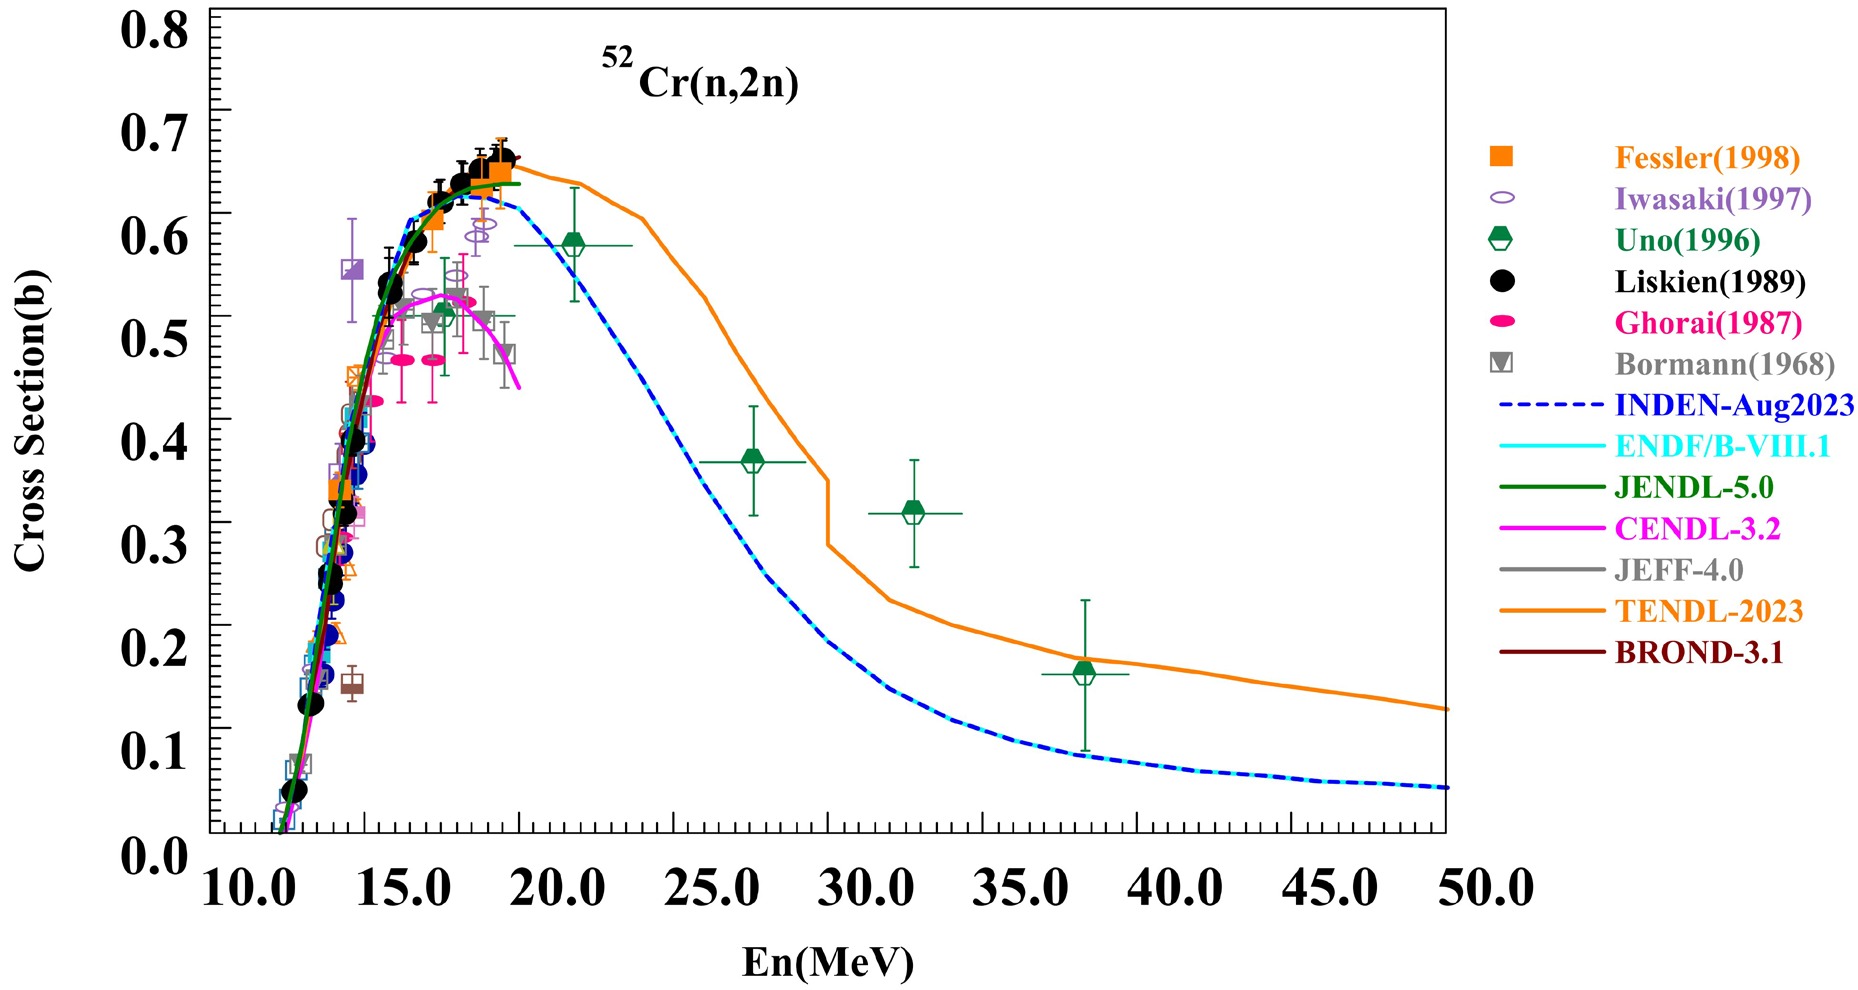
Figure 2. (color online) Experimental and evaluated data of protect
$^{52} {\rm{Cr}} (n, 2n)$ cross sections.To address these issues, we perform a new evaluation and analysis for neutron data of n+
$^{50,52,53,54}{\rm{Cr}}$ nuclear reaction systems at neutron energies below 200 MeV. Following the approach outlined in Ref. [13−15], we conduct experimental data evaluation by focusing on 571 datasets covering cross sections, angular distributions, energy spectra, and double differential cross sections. To ensure a rigorous evaluation of the measured data quality, a full consideration is given to various factors, including experimental methods, neutron source properties, samples, detection techniques, and other relevant technical aspects. Consequently, based on this systematic and in - depth assessment, it is highly recommended to employ a complete experimental dataset to provide solid support for the current evaluation.Regarding the theoretical calculation study, the principal nuclear reaction processes under consideration are illustrated in Fig. 3. As the incident neutron energy increases, a broader range of nuclear reaction mechanisms gradually come into play, with the dominant reaction mode transitioning from statistical equilibrium emission to pre - equilibrium and direct reaction pathways.

Figure 3. (color online) Neutron reaction scheme for
$ {\rm{Cr}}$ isotopes with neutron energy below 200 MeV.In our research, we first utilize the Chinese nuclear reaction code UNF[16] to handle neutron data within the energy range spanning from a few keV to 20 MeV. This code is well suited for capturing the relevant nuclear reaction characteristics in this relatively lower energy regime. Subsequently, to extend our calculations to a higher energy range, we employ another Chinese nuclear reaction code, MEND[17]. This code enables us to compute the complete set of nuclear reaction data for energies below 200 MeV. By integrating the results from these two codes, we have successfully accomplished new evaluations of neutron data for the chromium isotopes
$^{50}{\rm{Cr}}$ ,$^{52}{\rm{Cr}}$ ,$^{53}{\rm{Cr}}$ , and$^{54}{\rm{Cr}}$ . Moreover, our study offers in - depth analysis regarding the discrepancies in reactions such as$(n, p)$ and$(n, 2n)$ , providing valuable insights into the underlying nuclear reaction mechanisms.The paper is arranged as follows. The details of experimental data evaluation are introduced in Sec. II; Section III briefly outlined the current theoretical models; Section IV make comparison and analysis for the evaluated results; An integral examination for
$^{52}{\rm{Cr}}$ are exampled in Section V; Finally, a brief summary is presented in Section VI. -
Based on Experimental Nuclear Reaction Data (EXFOR)[18] database, we investigate 571 sets of experimental data from different measurements reported for n+
$^{50,52,53,54,nat}{\rm{Cr}}$ systems. These data are diverse in type, covering cross sections, angular distributions, energy spectra, and double differential cross sections. The majority of the 547 measurement sets provide values below 20 MeV, with only 24 sets recorded at energies from above this threshold up to 200 MeV. Although the measurements in higher energy region are limited, they are also highly concentrated in our work to satisfy the evaluated results within 200 MeV, which are presented in Table 2, and all types are cross sections.Year Author Reaction Source Method Detector En(MeV) Points EXFOR Entry 1980 S. M. Qaim $^{50}{\rm{Cr}}(n,3n)^{48}{\rm{Cr}}$ D-BE ACTIV, CHSEP GELI, SILI 20.0-30.0 1 21649 1992 Y. Uwamino $^{50}{\rm{Cr}}(n,3n)^{48}{\rm{Cr}}$ P-BE ACTIV GE-IN 26.5-38.5 13 22703 1978 S. M. Qaim $^{50}{\rm{Cr}}(n,x)^{48}{\rm{V}}$ D-BE ACTIV, CHSEP GELI 22.5 1 20840 2007 V. Semkova $^{50}{\rm{Cr}}(n,x)^{48}{\rm{V}}$ D-T ACTIV, GSPEC HPGE, LONGC 17.3-20.6 5 22877 2000 R. F. Carlton $^{52}{\rm{Cr}}(n,tot)$ - TOF, TRN SCIN 0.050-69.13 25833 13840 1990 N. Olsson $^{52}{\rm{Cr}}(n,n')$ D-T TOF SCIN 21.6 1 22128 1998 A. Fessler $^{52}{\rm{Cr}}(n,p)^{52}{\rm{V}}$ D-T, D-D ACTIV, TOF, GSPEC HPGE, BF3, SCIN 9.31-21.07 22 22406 1996 Y. Uno $^{52}{\rm{Cr}}(n,2n)^{51}{\rm{Cr}}$ P-7Li ACTIV, TOF GE-IN 17.6-38.3 5 22702 1980 S. M. Qaim $^{53}{\rm{Cr}}(n,3n)^{51}{\rm{Cr}}$
$^{53}{\rm{Cr}}(n,^{3}He)^{51}{\rm{Ti}}$ D-BE ACTIV, CHSEP GELI, SILI 20.0-30.0 2 21649 1998 A. Fessler $^{53}{\rm{Cr}}(n,p)^{53}{\rm{V}}$
$^{53}{\rm{Cr}}(n,x)^{52}{\rm{V}}$ D-T, D-D ACTIV, TOF, GSPEC HPGE, BF3, SCIN 11.57-21.07 24 22406 1998 A. Fessler $^{54}{\rm{Cr}}(n,\alpha)^{51}{\rm{Ti}}$
$^{54}{\rm{Cr}}(n,p)^{54}{\rm{V}}$
$^{54}{\rm{Cr}}(n,x)^{53}{\rm{V}}$ D-T, D-D ACTIV, TOF, GSPEC HPGE, BF3, SCIN 16.02-20.24 15 22406 2001 W. P. Abfalterer $^{nat}{\rm{Cr}}(n,tot)$ EVAP TOF SCIN 5.29-559.1 467 13753 1980 D. C. Larson $^{nat}{\rm{Cr}}(n,tot)$ PHOTO TOF SCIN 2.00-80.62 685 12882 1973 F. G. Perey $^{nat}{\rm{Cr}}(n,tot)$ - - - 0.19-29.50 3658 10342 1968 S. Cierjacks $^{nat}{\rm{Cr}}(n,tot)$ EVAP TOF, TRN SCIN 4.41-31.94 1231 20012 1960 J. M. Peterson $^{nat}{\rm{Cr}}(n,tot)$ D-T - SCIN 17.5-28.6 4 11108 1987 N. Olsson $^{nat}{\rm{Cr}}(n,el)$ D-T TOF SCIN; SCIN 21.6 1 22048 1977 G. F. Auchampaugh $^{nat}{\rm{Cr}}(n,2n)$ D-T; D-T - STANK; STANK; SCIN 14.7-21.0 7 12936 1994 Y. Uwamino $^{nat}{\rm{Cr}}(n,x)^{52}{\rm{V}}$ P-BE ACTIV GE-IN 5.5-38.5 34 22700 1994 Y. Uwamino $^{nat}{\rm{Cr}}(n,x)^{53}{\rm{V}}$ P-BE ACTIV GE-IN 4.5-38.5 35 22700 Note: All abbreviations are defined in Appendix A. Table 2. Information on experimental data at energies above 20 MeV
In this table, it is observed that for natural chromium and
$^{52}{\rm{Cr}}$ , abundant experimental data exist for the total cross section, elastic scattering cross section, and elastic angular distributions. The total cross section data extend up to 80.62 MeV, enabling the extraction of reliable phenomenological optical-model parameters in the high energy region. Based on the systematic A and Z dependence of the phenomenological optical model, these parameters are extrapolated to describe the chromium isotopes$^{50}{\rm{Cr}}$ ,$^{53}{\rm{Cr}}$ , and$^{54}{\rm{Cr}}$ . In energy regions where experimental data are scarce, the results rely on theoretical models to ensure physical consistency. In the 20-200 MeV range, hundreds of nuclear reaction channels open, leading to strong competition among multiple pathways. As a result, direct measurement of individual reaction channel cross sections becomes challenging. Therefore, above 20 MeV, experimental data on emission energy spectra or double differential cross sections for particles including n, p, d, t,$^{3}He$ , and α are urgently needed to fill the measurements gap. Such data are vital for validating and refining theoretical models.With respect to the data below 20 MeV, the measurements for major nuclear reactions
$(n, tot), (n, el), (n, inl), (n, \gamma), (n, p), (n, d), (n, \alpha), (n,2n)$ et al. in Fig. 3 are all considered. To thoroughly evaluate the measured data, the experimental methods like activation, time-of-flight are systematically analyzed based on the original literature. Neutron sources (like type, neutron flux, monochromaticity), sample properties (like physical properties of samples, composition, purity, shape, and surface finish et al.), detection techniques (like detector type, resolution, and background) are over viewed. By integrating these considerations with rigorous experimental design and data validation, we establish experimental datasets by evaluating data reliability to support our assessment. The original experimental data and literature reports serve as the most important basis for investigation. We conducted a physical evaluation of the experimental data, which is primarily based on key factors of the experiments (experimental method, neutron source, detector, sample quantification, monitor, and decay data). Additional considerations included the year, laboratory, publication channel, and institution. Furthermore, the influence of nuclear reaction mechanisms is taken into account. A weight assignment and evaluation are performed on all experimental data to enhance reliability, with specific datasets being highlighted to support our assessment. Given the extensive volume of experimental data, this paper only provides briefly tabulated experimental lists in Appendix C, details can also be consulted in the EXFOR database.Here, using the evaluation oaref
$^{52}{\rm{Cr}}(n,2n)$ cross sections as an illustrative instance, we analyze 21 sets of experimental data. As shown Fig. 4, 14 sets are populated for neutron energy below 15 MeV using D-T neutron source and activation methods, and the reported values are in good agreement with each other across this energy region; however, for energy above 15 MeV, obvious discrepancies are exhibited even up to 200 mb in the rest six sets (EXFOR Entry: 22406, 22755, 22702, 22124, 12958, 20834). All six sets are performed using the activation method[19]. In contrast to the data by Bormann (1968) and Ghorai (1987), the remaining four sets of newly measured data are generally 200 mb higher around 20 MeV. These new measurements use HpGe detectors, which not only fixe the problems of NaI detectors (low energy resolution and easy to absorb moisture) but also solve the issues with Ge(Li) detectors, like needing constant low - temperature cooling, having complex production steps, small sensitive areas, and being easily damaged by radiation. Moreover, isotopic samples of$^{52}{\rm{Cr}}$ with a purity of 99.9% are utilized, effectively reducing interference from competing reaction channels of other isotopes (e.g.,$^{50}{\rm{Cr}}(n, \gamma) $ and$ ^{54}{\rm{Cr}}(n,2n)$ ). It is explicitly stated in Ref. 24 that a systematic underestimation of 20%–30% is exhibited in Ghorai's measurement in 1987. The latest INDEN-Aug2023 and IRDFF-II[20] evaluations support higher cross-sections values. Therefore, the$^{52}{\rm{Cr}}(n,2n)$ cross sections by Liskien and Fessler are adopted in this work. For the energy region above 20 MeV, the measurement data from Uno (1996) is recommended. The solid red line in Fig. 4 is our new evaluated values.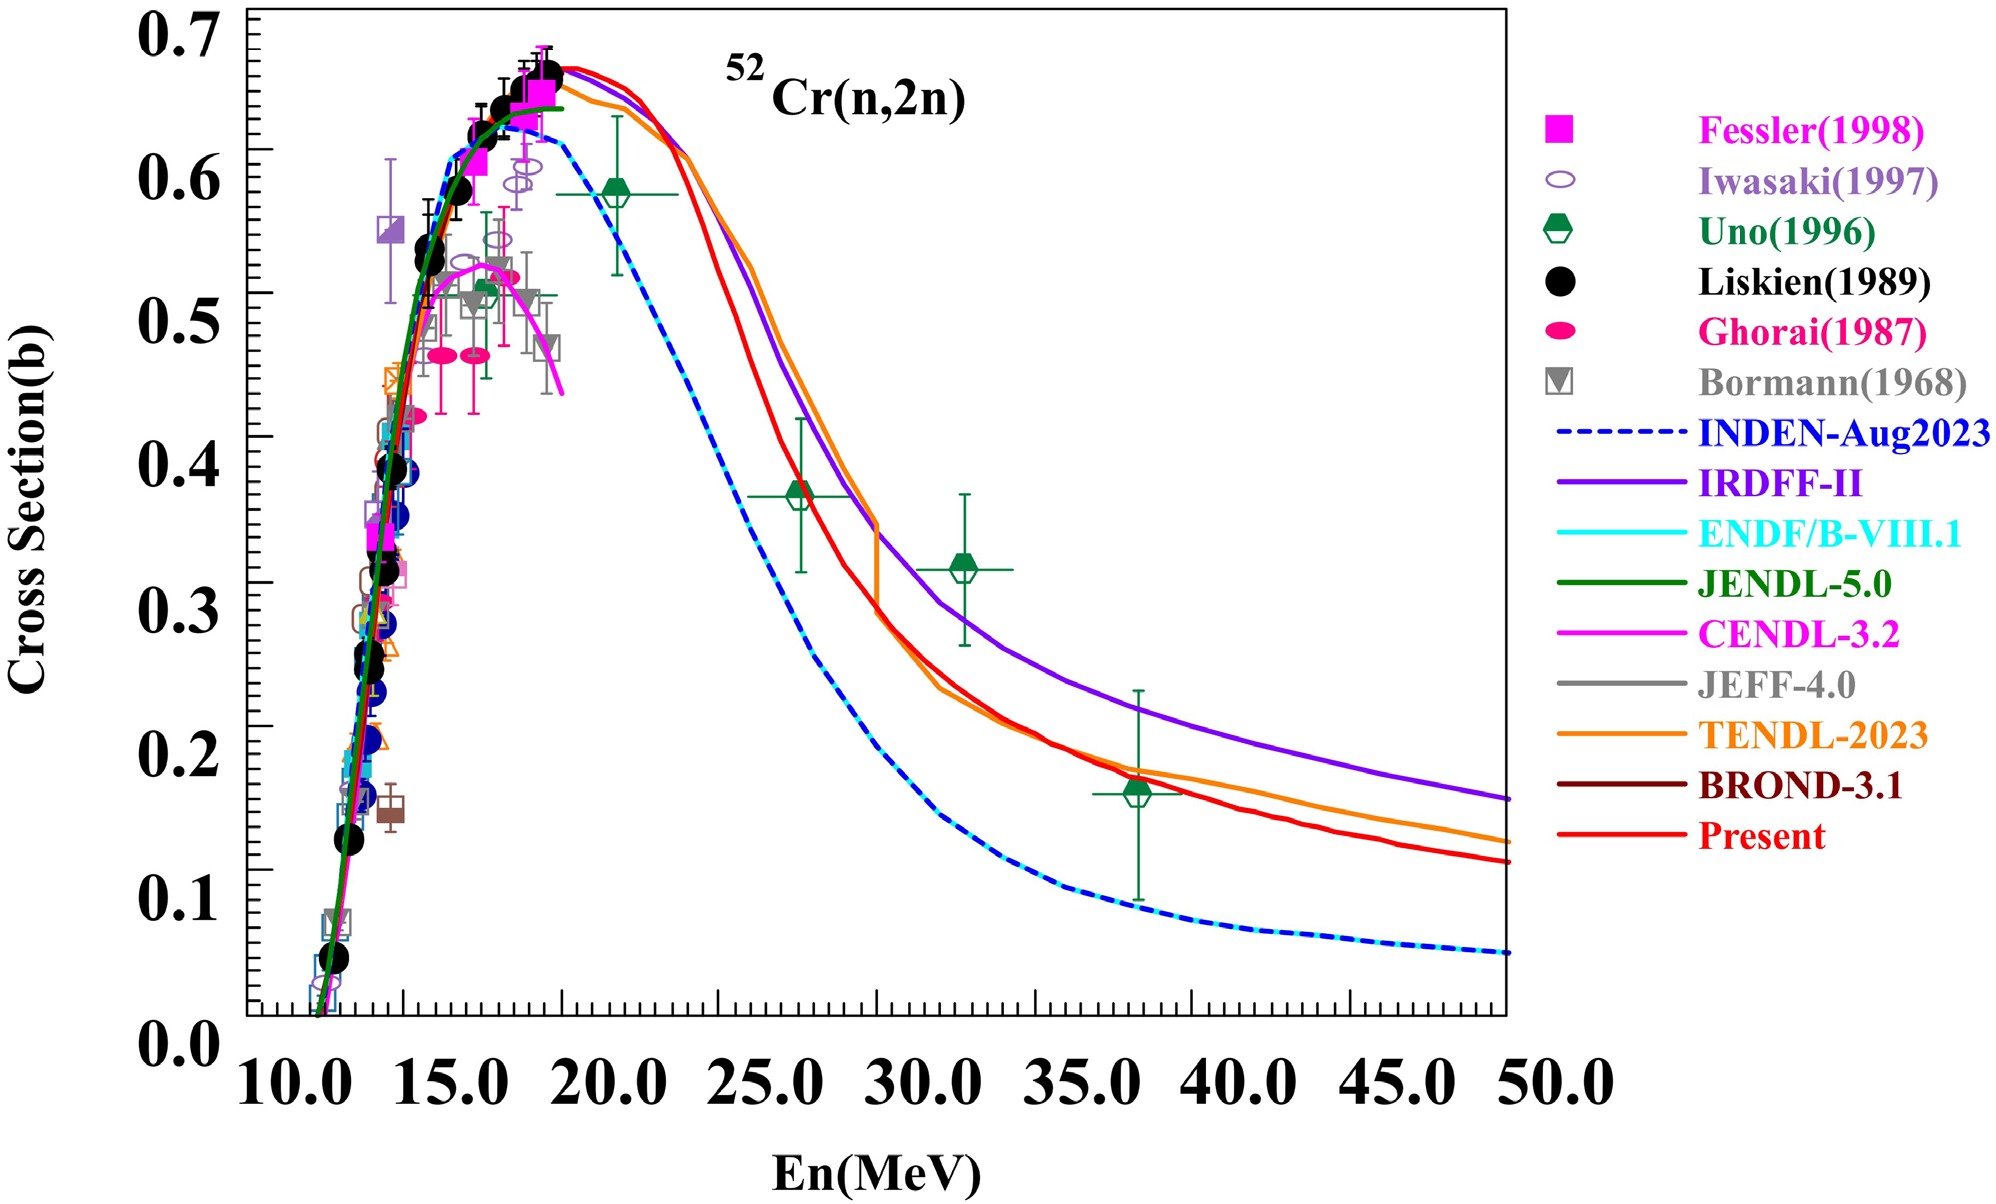
Figure 4. (color online) Comparison of
$^{52} {\rm{Cr}}(n,2n)$ cross sections between evaluated data (red curve) and experimental data (symbols). -
Theoretical calculation of nuclear reactions in this work comprises three key stages. Firstly, the independent particle stage, detailing scattering / absorption between incident particles & target nucleus, must be considered across all neutron incident energies. It is described by the optical model potential based on the Woods-Saxon formula, for neutron. Secondly, the composite particle emission stage, which is divided into statistical equilibrium, pre-equilibrium, and direct reaction processes. As the incident neutron energy increases, the dominant reaction mechanism governing particle emission evolves.
In our calculations, when dealing with neutron energies below 20 MeV, we employ a unified approach that combines the Hauser-Feshbach and exciton models, as detailed in Ref. [21]. The UNF code, grounded in this unified model, takes into account both the conservation of angular momentum and recoil effects. It demonstrates a high degree of theoretical self-consistency, making it well suited for high precision data evaluation. To improve agreement with the experimental data, the level density parameter α and the pair correction parameters Δ are optimized according to the measurements, and the final values are listed in Appendix B for each reaction.
For neutron energies below 200 MeV, the MEND code offers broader coverage (up to 250 MeV). It integrates key nuclear reaction models—including the optical, evaporation, cascade emission, exciton, and Hauser-Feshbach (HF) theories—to support multi-particle and multi-stage emission processes. In this work, we systematically optimize its parameters using Su Zongdi’s[22] theoretical framework, resulting in an improved parameter set. Given the large number of parameters involved, specific numerical values are omitted here.
MEND and UNF are constructed within the same general reaction-model framework. The main difference lies in the treatment of angular-momentum and parity conservation, which reflects their respective energy domains and design goals.
In the UNF code, an angular-momentum–dependent exciton model combined with a fully
$J^\pi$ resolved Hauser–Feshbach formalism is employed, ensuring strict conservation of angular momentum and parity throughout the reaction process. This treatment is essential in the low-energy regime, where individual compound-nuclear states and selection rules play a dominant role.With increasing incident energy (
$E_n \gtrsim 20\,{\rm{MeV}}$ ), the influence of detailed$J^\pi$ conservation on inclusive observables gradually diminishes due to the increasing number of open channels and the dominance of multi-step, non-equilibrium processes. Accordingly, in MEND the reaction mechanism is organized as follows. Direct reaction contributions (for discrete levels taken as external input, and for continuum states described by empirical systematics) are evaluated first. Fast intranuclear cascade neutron emission is then described using empirical formulae and treated separately from the statistical stages. Pre-equilibrium emission is modeled with the standard exciton model, while the equilibrium decay is treated with a simplified evaporation model obtained as the high-energy limit of the Hauser–Feshbach formalism. In the cascade, pre-equilibrium, and evaporation stages, angular-momentum and parity conservation are not treated explicitly.This hierarchical mechanism chain allows MEND to provide a consistent description of reaction cross sections and spectra up to ~200 MeV, while keeping the computational complexity under control. A short subsection and a schematic summary have been added to the revised manuscript to make this organization explicit.
In addition, the contribution of direct reaction for inelastic scattering cross sections and angular distributions of discrete levels for n+
$^{50,52,53,54}{\rm{Cr}}$ reactions are determined by the DWUCK4[23] code performing the distorted wave Born approximation. The information on discrete energy levels is obtained from the Reference Input Parameter Library-3 (RIPL-3)[24]. Theoretical calculations consider 7, 8, 15, and 7 discrete levels, which contribute to direct reactions on$^{50,52,53,54}{\rm{Cr}}$ . -
Based on the evaluation of experimental data and theoretical model calculations, we have obtained a new set of evaluated results. The detailed discussion and analysis are presented below:
-
For
$^{52}{\rm{Cr}}$ and$^{53}{\rm{Cr}}$ , experimental data exhibit significant fluctuating structures in the low-energy region, while our results reasonably reproduce their average values. Based on comprehensive evaluation and analysis, the ENDF/B-VIII.1 evaluated data are recommended for energies below 7 MeV, with resonance parameters adopted from L. C. Leal et al. (2010)[25]. Comparisons between the evaluated data (ENDF/B-VIII.1 and JENDL-5) and experimental data are shown in Fig. 5 and 6. The isotopic abundance of$^{52}{\rm{Cr}}$ is as high as 83.789%. Therefore, our results have also been compared with the experimental data for natural chromium. The data for$^{nat}{\rm{Cr}}$ from Abfalterer (2001) (EXFOR Entry: 13753) and Larson (1980) (EXFOR Entry: 12882) are compared with the result of n+$^{52}{\rm{Cr}}$ reaction, as shown in Fig. 5.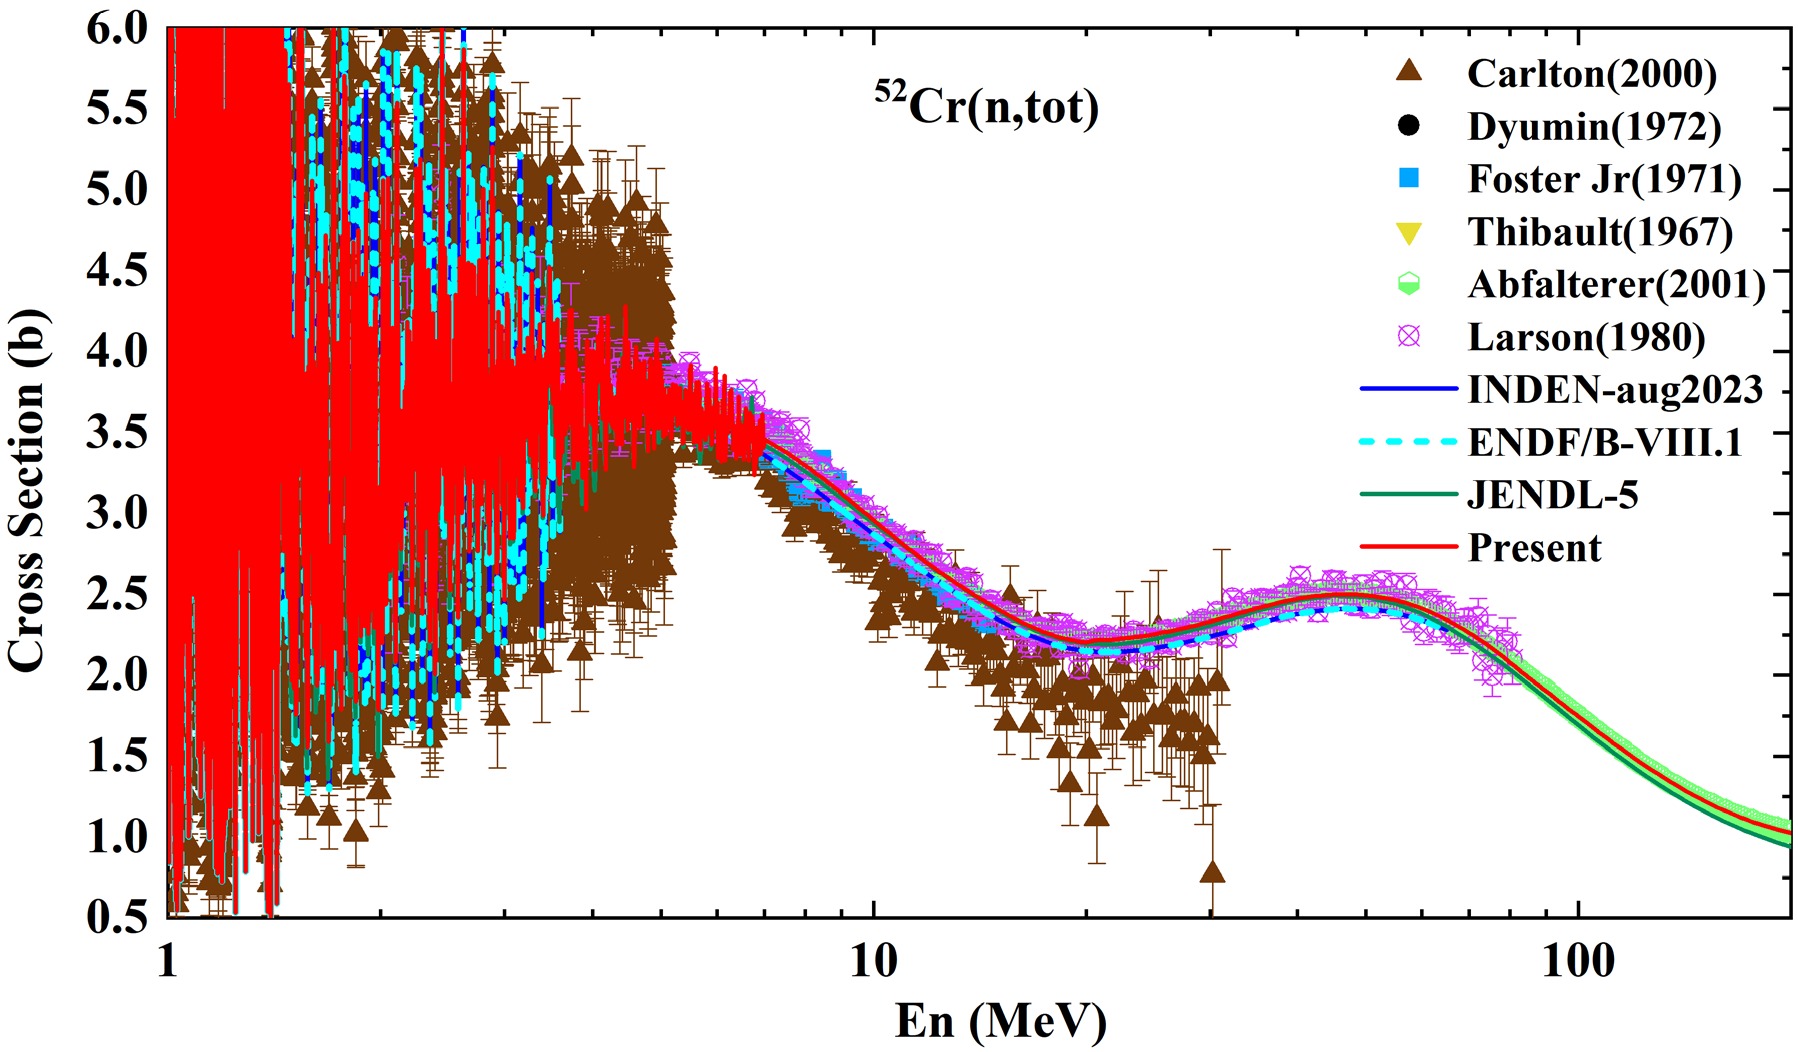
Figure 5. (color online) Comparison of
$^{52} {\rm{Cr}}(n, tot)$ cross sections between evaluated data (red curve) and experimental data (symbols).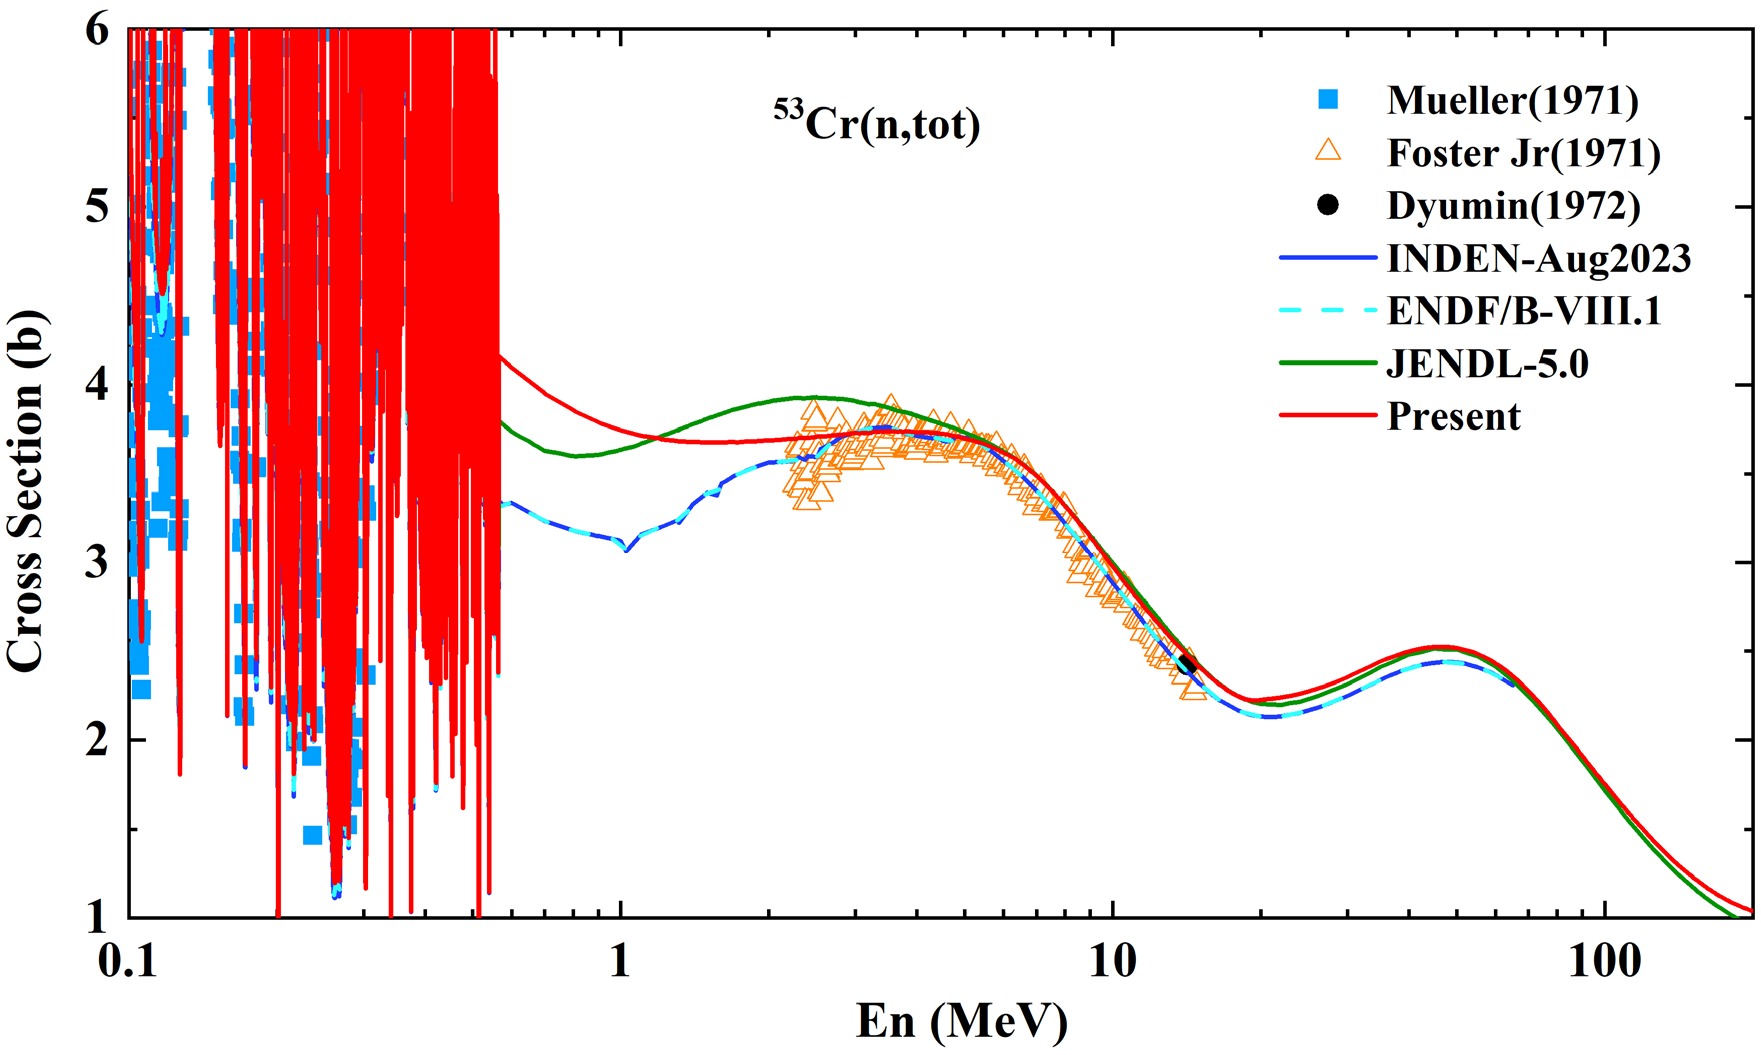
Figure 6. (color online) Comparison of
$^{53} {\rm{Cr}}(n, tot)$ cross sections between evaluated data (red curve) and experimental data (symbols).The experimental data for the n+
$^{50,54}{\rm{Cr}}$ reactions total cross sections are mainly concentrated in the resonance energy region. A. I. Dyumin (EXFOR Entry: 40149) have published the experimental data for the n+$^{50,52,53,54}{\rm{Cr}}$ reactions total cross sections at 14.2 MeV in 1972. The results of the total cross sections for n+$^{50,52,53,54}{\rm{Cr}}$ reactions show excellent agreement with existing experimental data.The comparisons of the results with existing experimental data for the elastic scattering cross sections of n+
$^{52}{\rm{Cr}}$ reaction are shown in Fig. 7. The experimental datasets comprises both$^{52}{\rm{Cr}}$ and natural chromium elastic scattering cross sections: the top two sets correspond to$^{52}{\rm{Cr}}$ data, while the latter four represent natural chromium data. Among these, I. A. Korzh et al. (1977) (EXFOR Entry: 40557) have measured elastic cross sections for$^{50,52,54}{\rm{Cr}}$ reactions, and the results show good agreement with these data.
Figure 7. (color online) Comparison of
$^{52} {\rm{Cr}}(n, el)$ cross sections between evaluated data (red curve) and experimental data (symbols). -
Fig. 8 display the comparisons between the evaluated results and the experimental data for the elastic scattering angular distributions. I. A. Korzh et al. (1975) (EXFOR Entry: 40531) have measured the elastic scattering angular distributions of
$^{50,52,54}{\rm{Cr}}$ for incident neutron energies from 1.5 to 3.0 MeV, and the theoretical results agree well with the existing experimental data. Fig. 9 shows the comparison between the elastic scattering angular distributions of n+$^{50,54}{\rm{Cr}}$ reactions and the experimental data for natural chromium. One can see that the theoretical results agree well with the experimental data.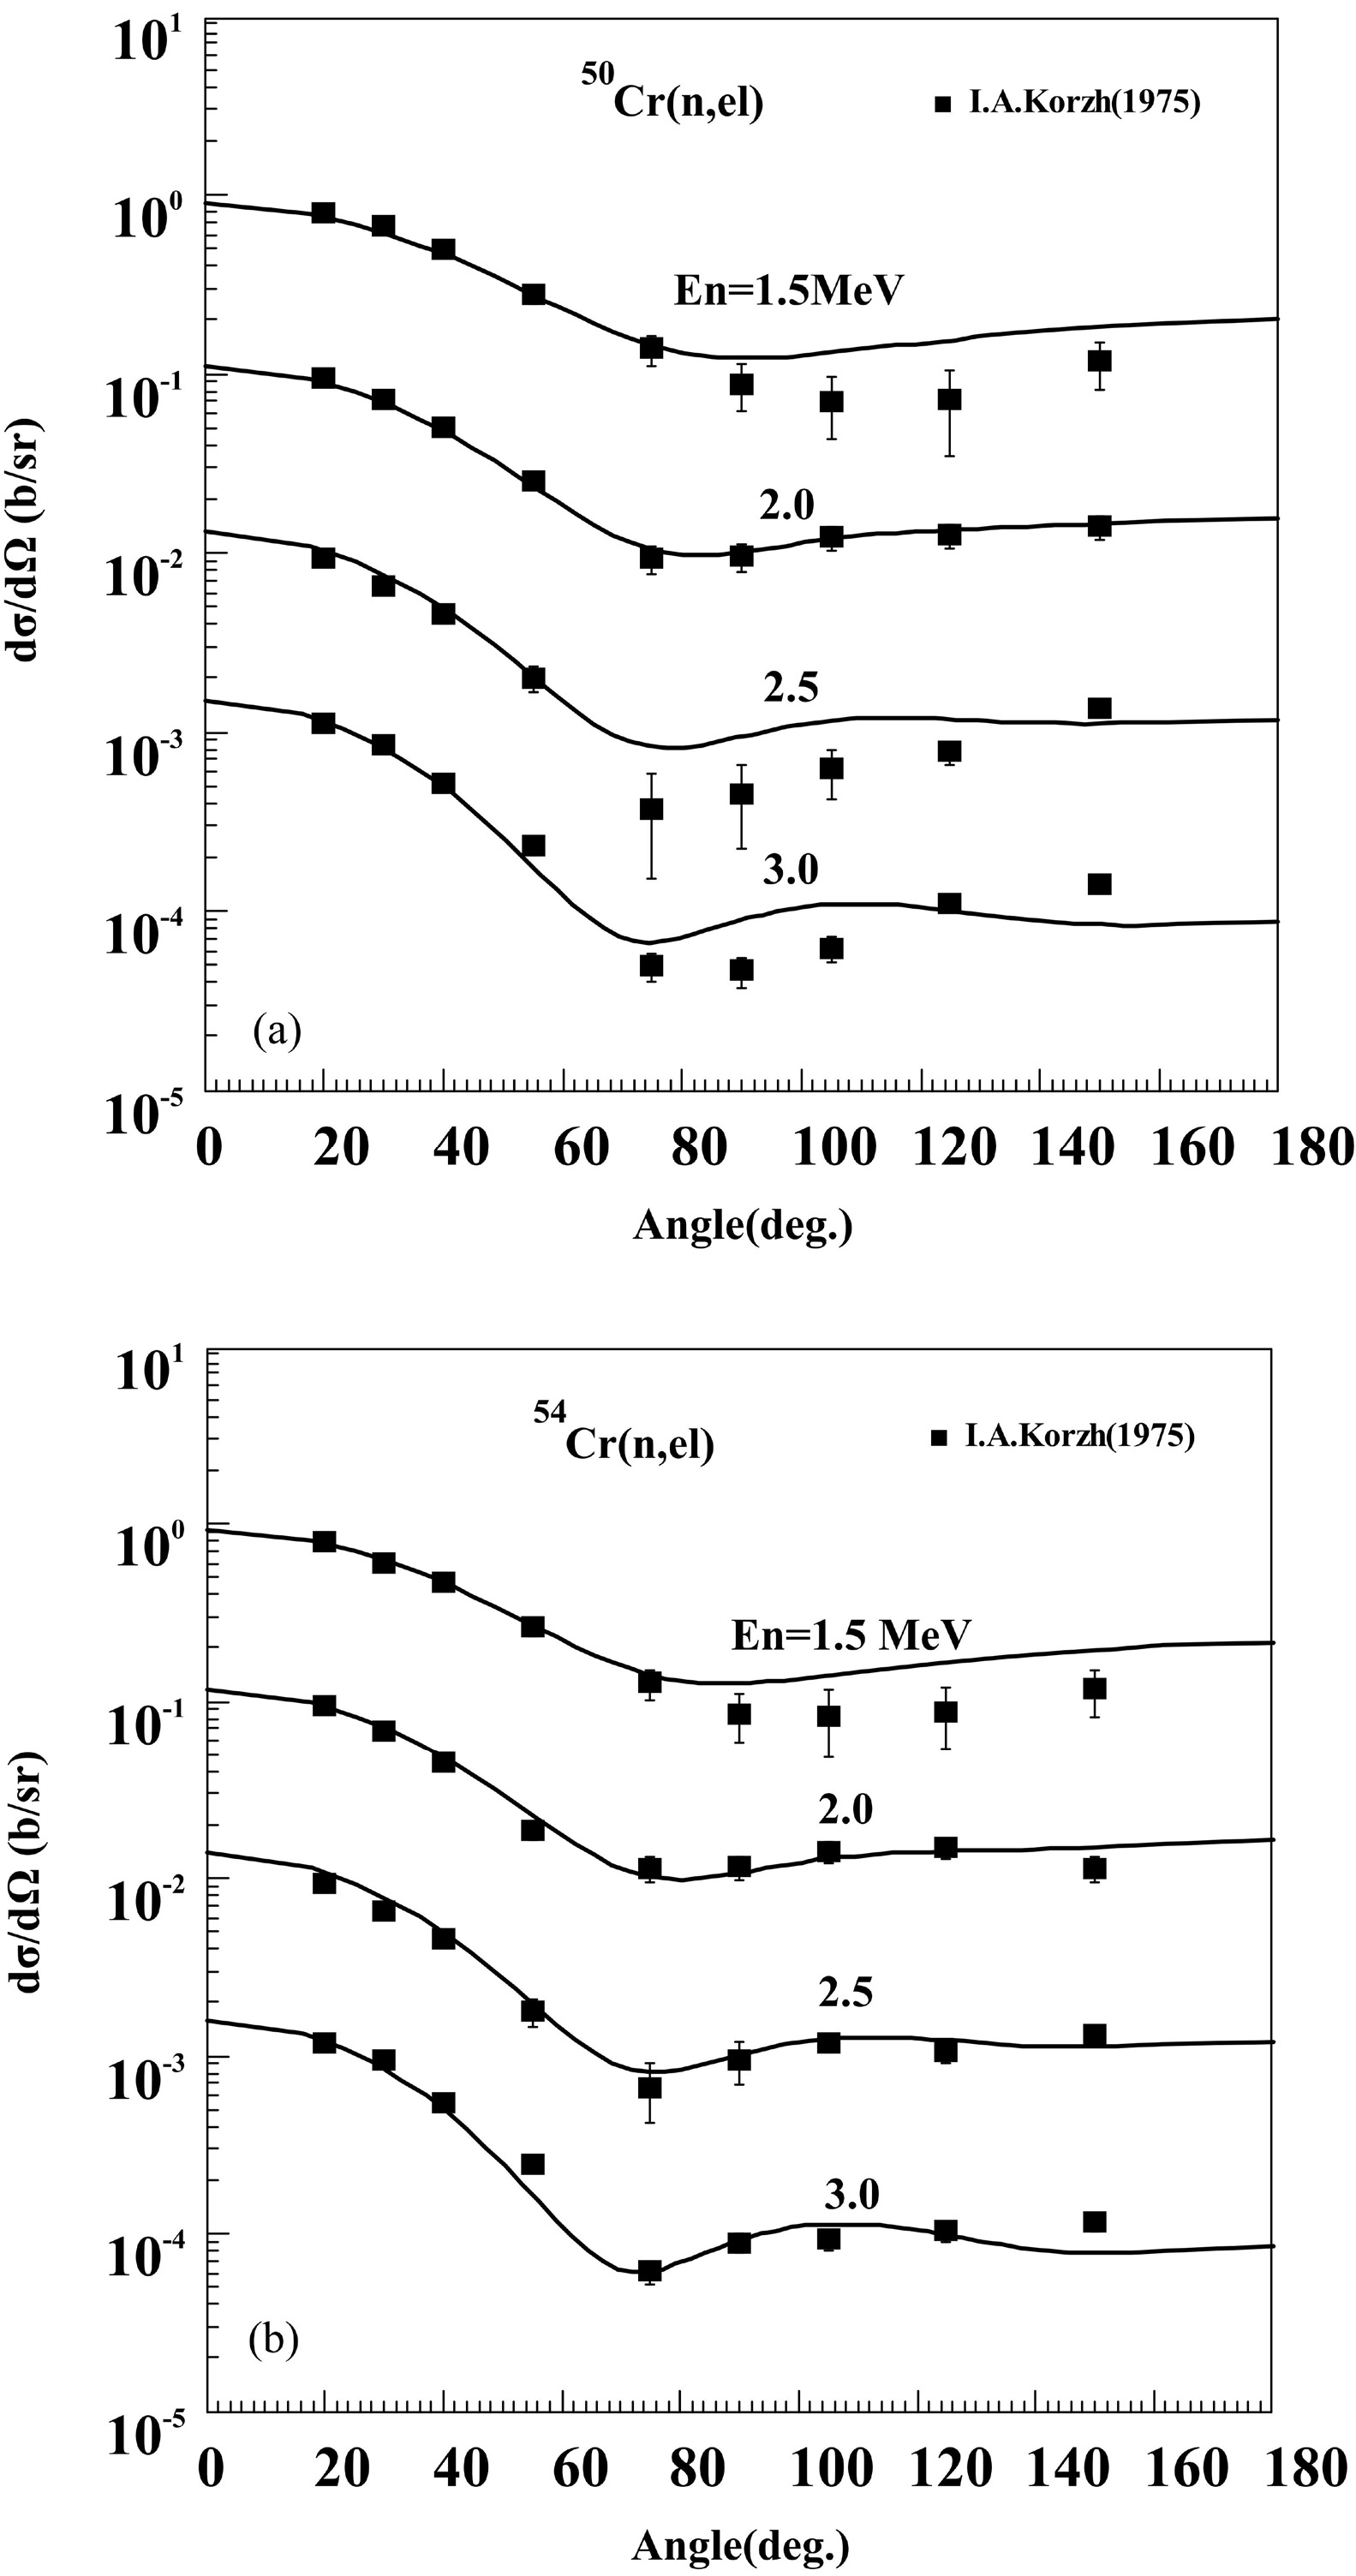
Figure 8. Comparisons of elastic scattering angular distributions for
$^{50,54} {\rm{Cr}}(n,el)$ between evaluated data (solid lines) and experimental data reported by I.A.Korzh (1975) (symbols). The energy region covers from 1.5 MeV to 3.0 MeV. In each panel, the topmost curve for 1.5 MeV remains the true reported values in the literature, and the other results from 1.5 MeV to 3.0MeV are multiplied by factors of 0.1, 0.01, and so on, respectively.
Figure 9. (color online) Comparisons of elastic scattering angular distributions for
$^{50,54} {\rm{Cr}}(n,el)$ between evaluated data (solid lines) and natural chromium experimental data (symbols). In each panel, the topmost curve remains the true reported values in the literature, and the other results from top to bottom are multiplied by factors of 0.1, 0.01, and so on, respectively.As shown in Fig. 5-9, the theoretical results exhibit excellent agreement with experimental data across the entire angular range. This demonstrates that the obtained neutron optical model potential parameters give a good description of the measured elastic and inelastic scattering angular distributions.
-
The inelastic scattering angular distributions for
$^{50}{\rm{Cr}} (n, n_1)$ (to the discrete excited level of 0.7833 MeV, 2+) and$^{54}{\rm{Cr}}(n, n_1)$ (to the discrete excited level of 0.8349 MeV, 2+) at incident neutron energies from 1.5 to 3.0 MeV are compared with the experimental data reported by I. A. Korzh et al. (EXFOR Entry: 40531) as shown in Fig. 10.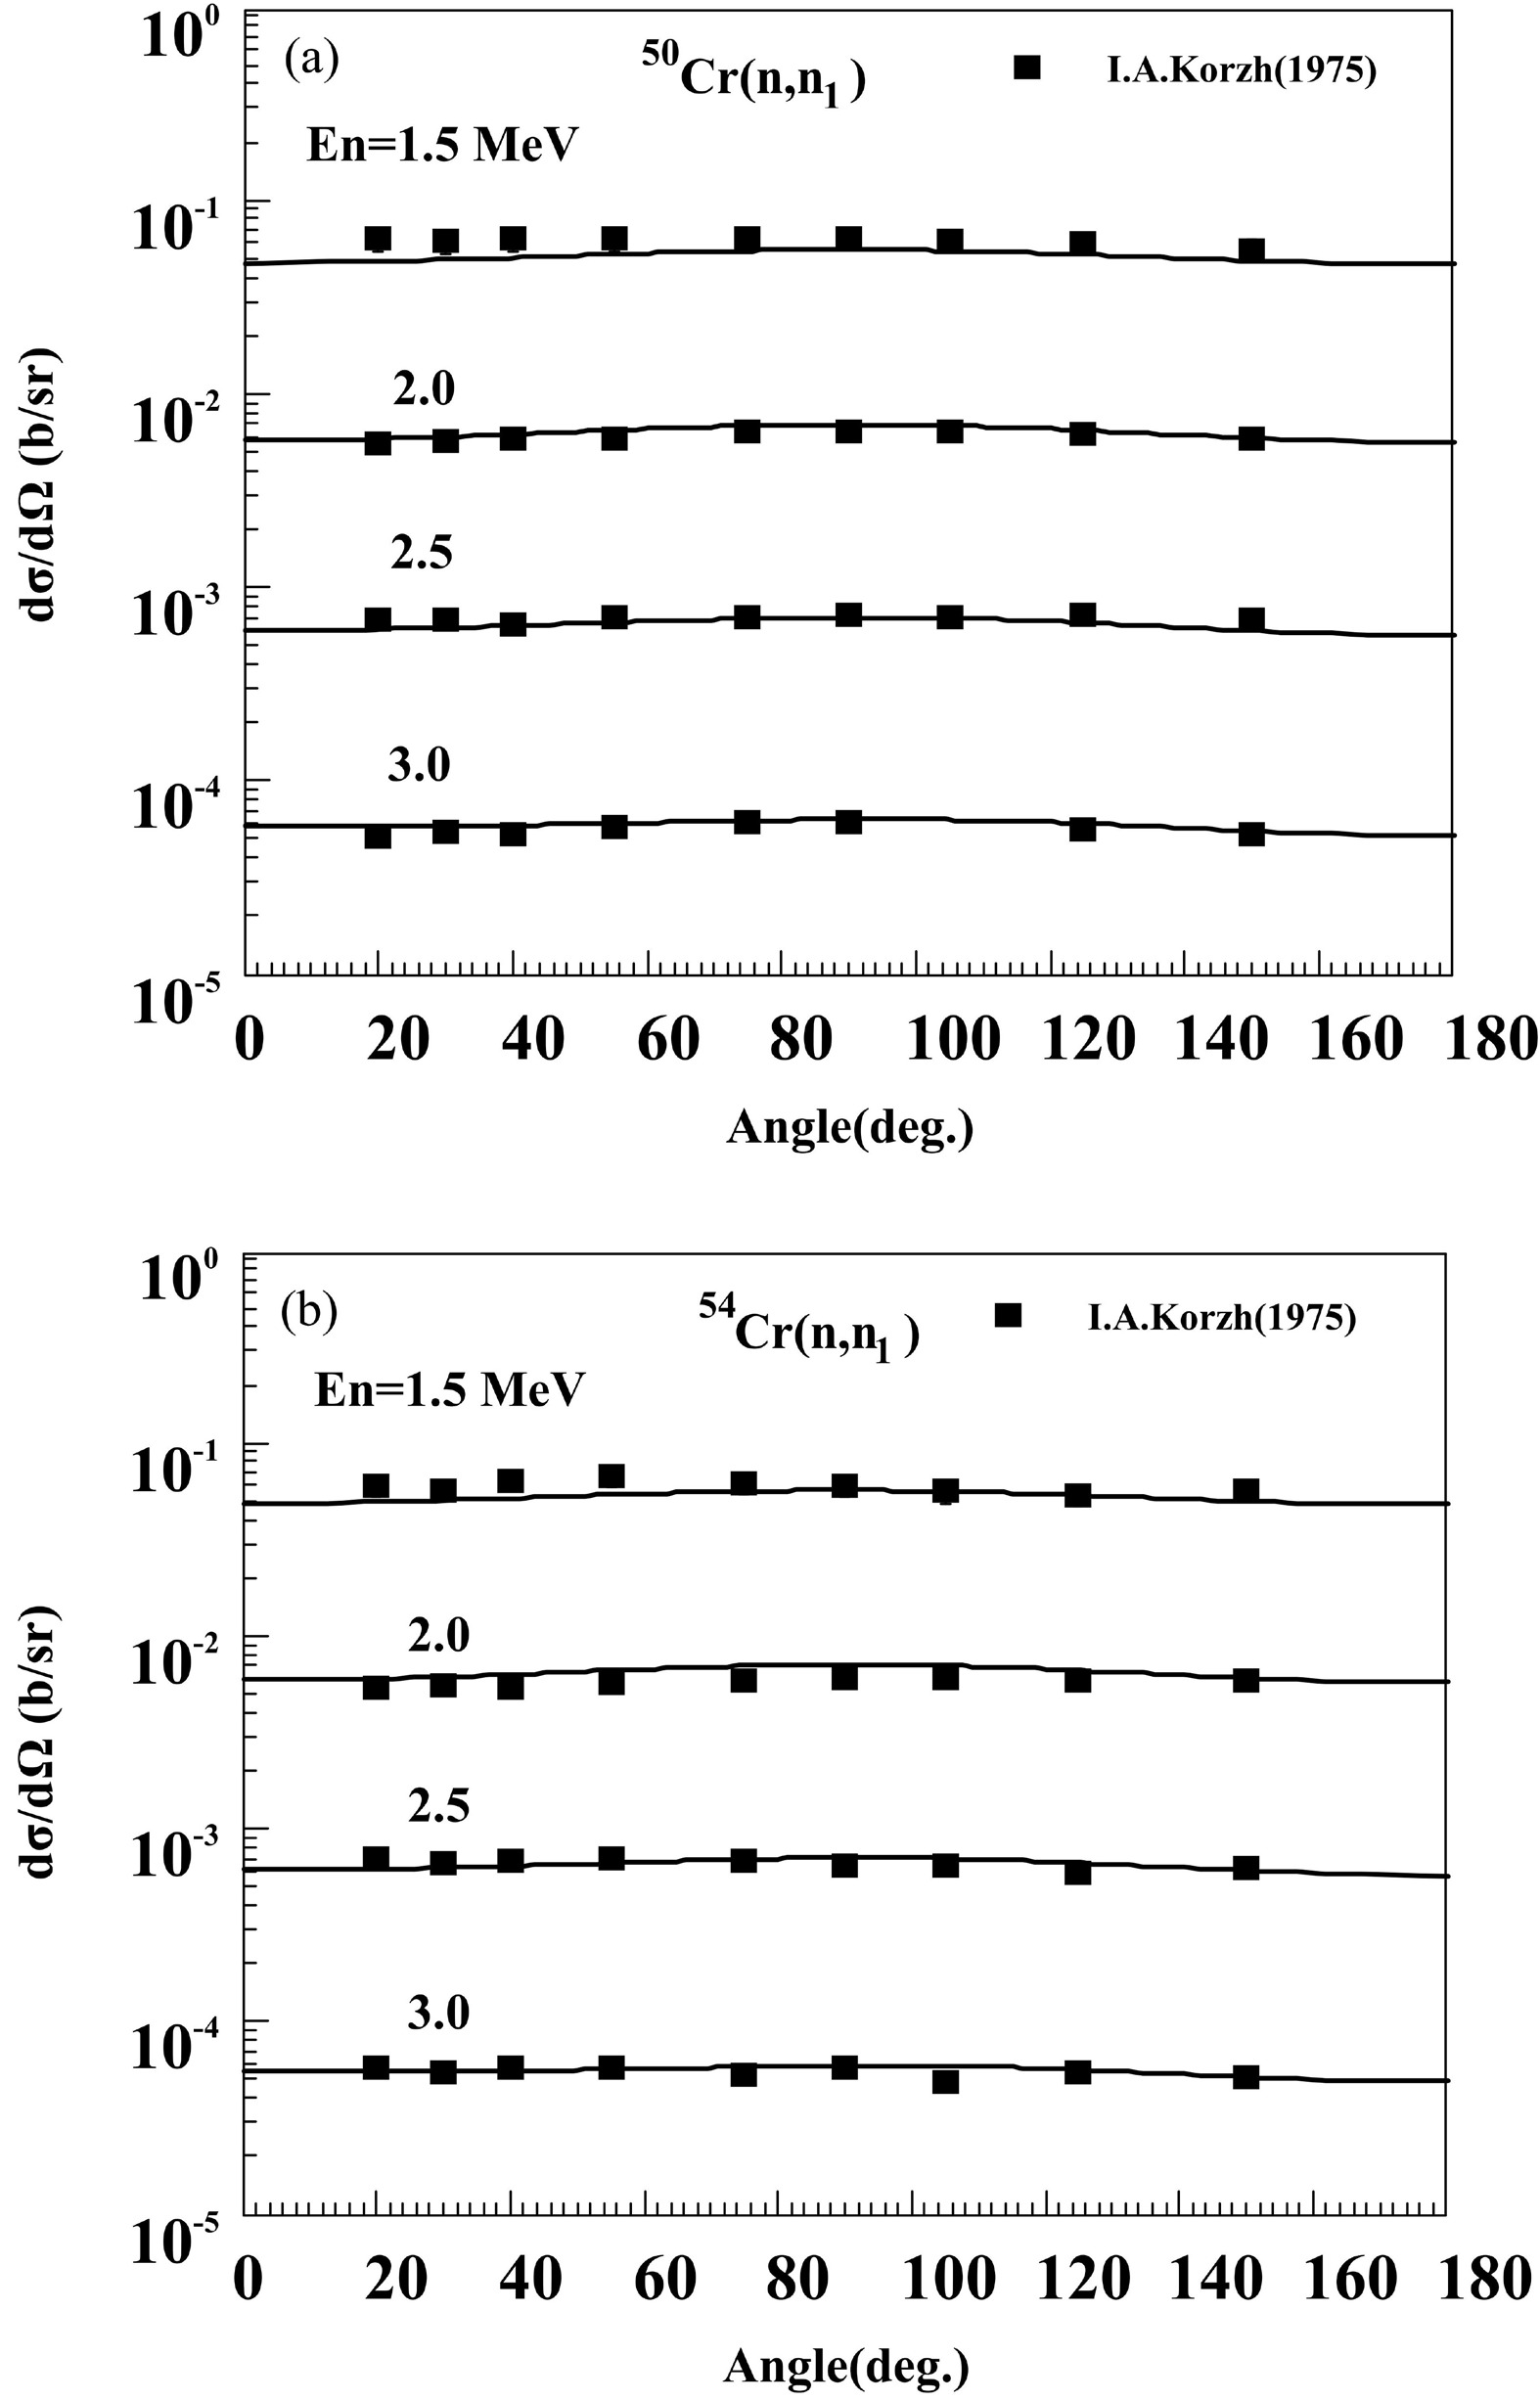
Figure 10. Comparisons of inelastic scattering angular distributions for
$^{50,54} {\rm{Cr}}(n, n_1)$ between evaluated data (solid lines) and experimental data reported by I.A.Korzh (1975) (symbols). The energy region covers from 1.5 MeV to 3.0 MeV. In each panel, the topmost curve for 1.5 MeV remains the true reported values in the literature, and the other results from 1.5 MeV to 3.0 MeV are multiplied by factors of 0.1, 0.01, and so on, respectively.The inelastic scattering angular distributions for
$^{52}{\rm{Cr}}(n, n_1)$ and$^{52}{\rm{Cr}}(n, n_2)$ (to the discrete excited level of 0.7833 MeV, 2+ and 2.3696 MeV, 4+) at incident neutron energies from 4.07-8.56 MeV are compared with the natural chromium experimental data reported by W. E. Kinney et al. (EXFOR Entry: 10413) as shown in Fig. 11-13. A comparison of the two angular distributions shows that the inelastic scattering angular distribution for the first discrete level exhibits a pronounced forward-peaking tendency, while that for the second discrete level is approximately isotropic. This reflects the$J^\pi$ dependence inherent in the unified exciton model and Hauser–Feshbach theory at energies below 20 MeV.
Figure 11. Comparisons of inelastic scattering angular distributions for
$^{52} {\rm{Cr}}(n, n_1)$ and$^{52} {\rm{Cr}}(n, n_2)$ between evaluated data (solid lines) and experimental data of natural Cr reported by W.E.Kinney (1974) (symbols). The energy region covers from 4.07 MeV to 8.56 MeV. In each panel, the topmost curve for 4.07 MeV remains the true reported values in the literature, and the other results from 4.34 MeV to 8.56 MeV are multiplied by factors of 0.1, 0.01, and so on, respectively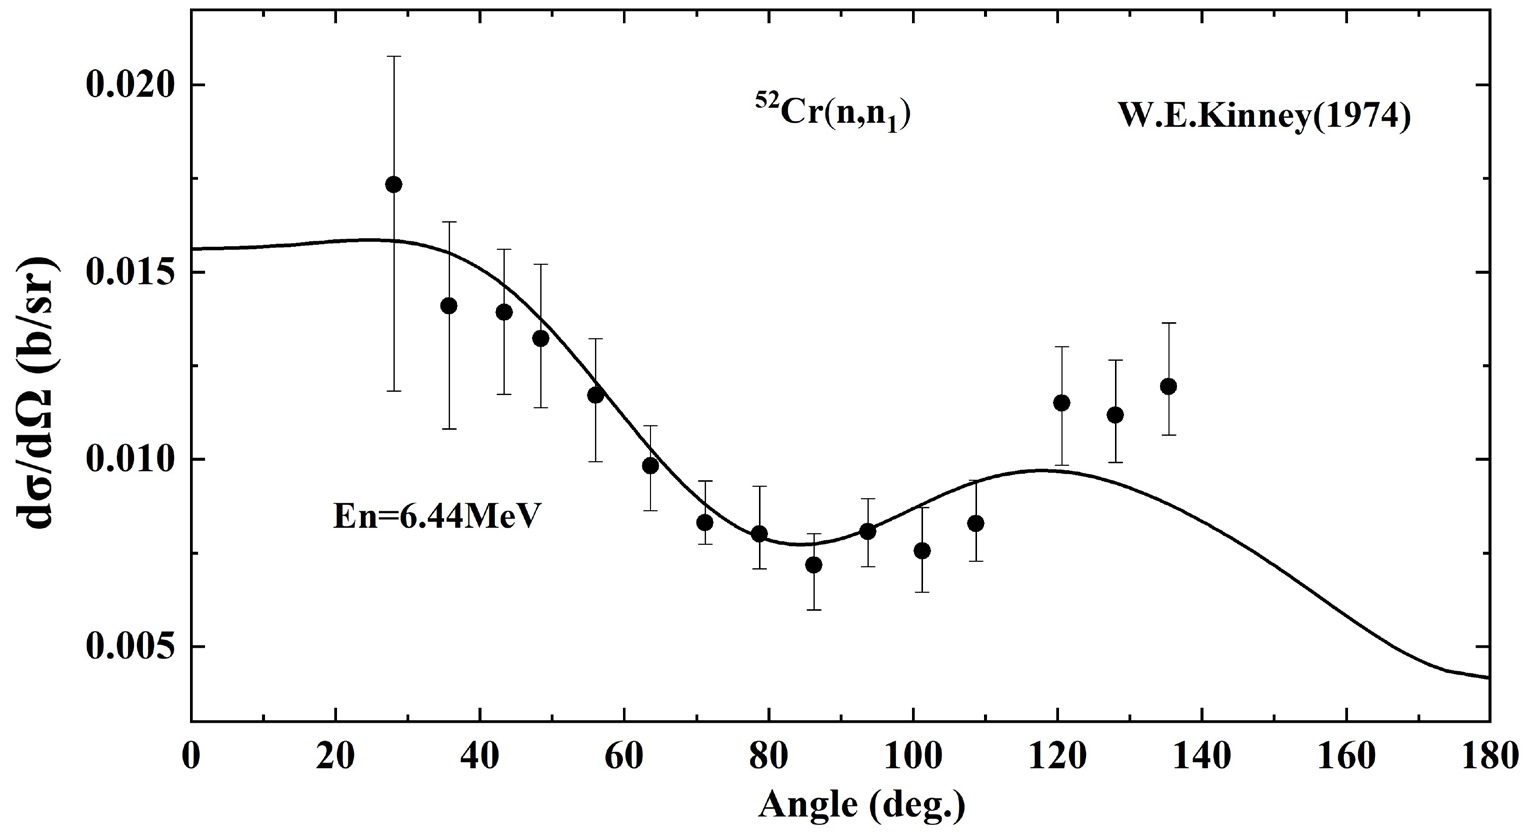
Figure 12. Comparison of inelastic scattering angular distributions for the first discrete level of
$^{52} {\rm{Cr}}$ between evaluated data (solid lines) and natural chromium experimental data reported by W.E.Kinney (1974) (symbols).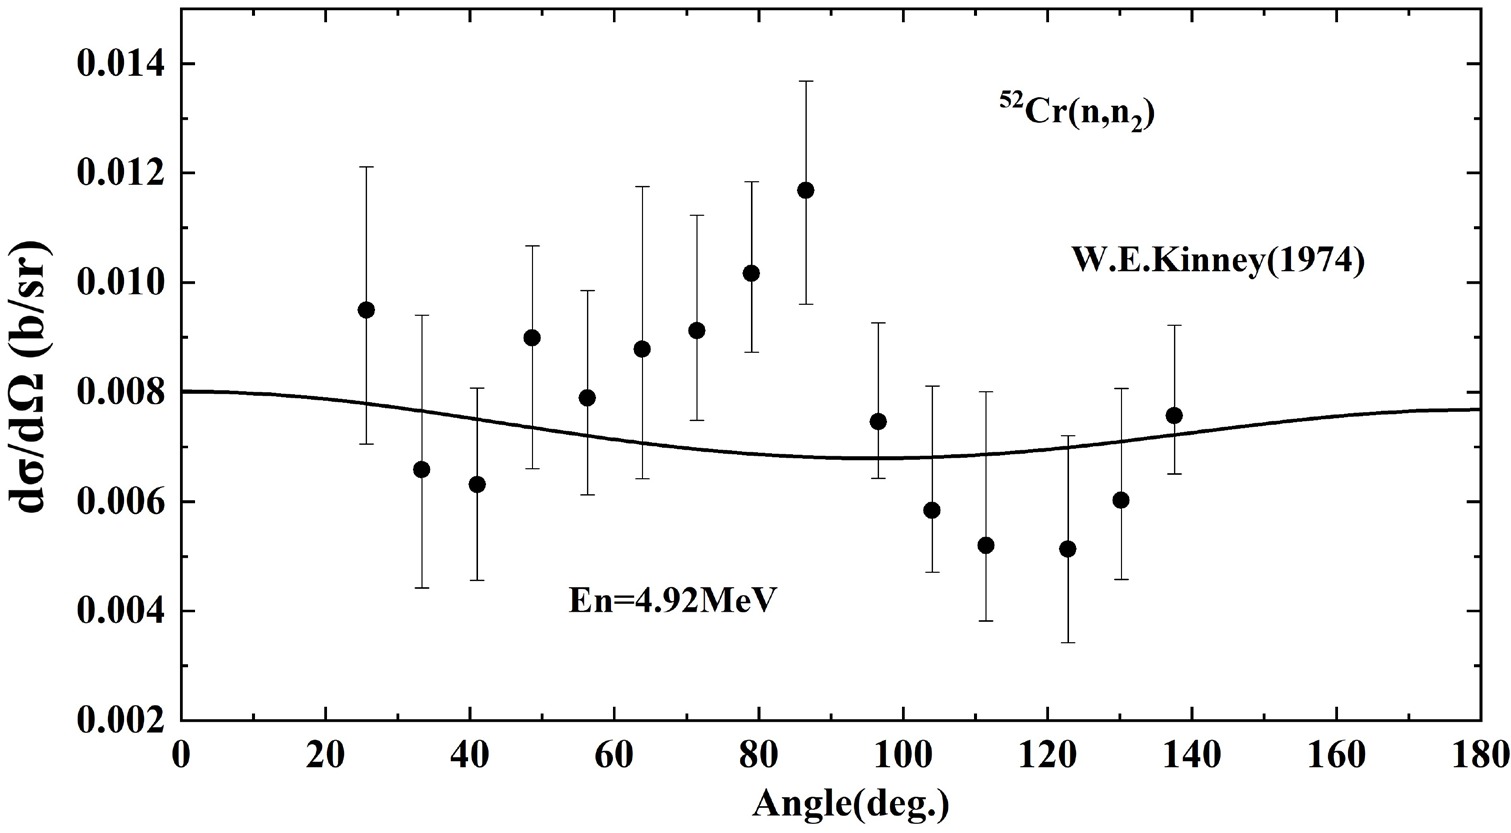
Figure 13. Comparison of inelastic scattering angular distributions for the second discrete level of
$^{52} {\rm{Cr}}$ between evaluated data (solid lines) and natural chromium experimental data reported by W.E.Kinney (1974) (symbols). -
In nuclear reaction processes, the contributions to inelastic scattering come from direct reactions, pre-equilibrium reactions, and statistical equilibrium reactions. At lower energies, statistical equilibrium reactions play a dominant role. As the energy increases, the contribution of direct reactions to inelastic scattering becomes more and more significant. A comparison between the evaluated results and experimental data for the inelastic scattering cross sections of
$^{50,53,54}{\rm{Cr}}$ reactions is shown in Fig. 14. Recently, Tan Boyu et al.[26] from the China Institute of Atomic Energy (CIAE) utilize the HI-13 Tandem Accelerator to generate monoenergetic neutrons with energies of 5.62 MeV, 6.24 MeV, and 7.95 MeV via the$D(d, n)^{3}He$ reaction. Employing the prompt γ -ray measurement method combined with a CLOVER-type high-purity germanium (HpGe) detector array, they successfully obtain the first experimental measurements of the production cross sections of five characteristic γ -rays of$^{52}{\rm{Cr}}$ in China. Correction terms for γ -ray self-absorption, neutron flux attenuation, and multiple scattering are incorporated during the experiment, resulting in a total uncertainty of only 6.5% for the final measurement results, which indicates superior precision. Notably, our results can achieve excellent agreement with this high-precision experimental data, which Fig. 15 shows. For the inelastic scattering cross sections of n+$^{50,52,53,54}{\rm{Cr}}$ reactions the evaluated results agree well with the low energy experimental data measured by D. M. Van Patter et al. (EXFOR Entry: 11676).
Figure 14. (color online) Comparison of
$^{50,53,54} {\rm{Cr}}(n, inl)$ cross sections between evaluated data (red curve) and experimental data (symbols).
Figure 15. (color online) Comparison of discrete levels’ inelastic cross sections and inelastic scattering gamma production cross sections for
$^{52} {\rm{Cr}}$ between evaluated data (red curve) and experimental data (symbols).Based on experimental data for inelastic scattering cross sections and inelastic scattering gamma production cross sections of discrete levels, the theoretical results for some discrete levels are compared.
Fig. 16(a)(b), Fig. 17(a)(b) and Fig. 18(a)(b), show the comparisons of evaluated results for discrete level inelastic scattering cross sections with existing experimental data. Among these, the inelastic scattering cross sections experimental data for
$^{50,54}{\rm{Cr}}$ measured by I. A. Korzh et al. (EXFOR Entry: 40531) are consistent with the results. The experimental inelastic scattering cross sections data for$^{50,52,53}{\rm{Cr}}$ measured by P. T. Karatzas et al. (1978) (EXFOR Entry: 10492) – deduced from inelastic gamma-ray production cross sections scaled by natural isotopic abundances – show good agreement with theoretical results after normalization by isotopic abundances.
Figure 16. (color online) Comparison of discrete levels’ inelastic cross sections and inelastic scattering gamma production cross sections for
$^{50} {\rm{Cr}}$ between evaluated data (red curve) and experimental data (symbols).
Figure 17. (color online) Comparison of discrete levels’ inelastic cross sections and inelastic scattering gamma production cross sections for
$^{53} {\rm{Cr}}$ between evaluated data (red curve) and experimental data (symbols).
Figure 18. (color online) Comparison of discrete levels’ inelastic cross sections and inelastic scattering gamma production cross sections for
$^{54} {\rm{Cr}}$ between evaluated data (red curve) and experimental data (symbols).Fig. 16(c)(d) show the comparisons of inelastic scattering gamma production cross sections evaluated results with existing experimental data for transitions from the first excited state to the ground state, and from the second excited state to the first excited state. Fig. 17(c)(d) show the comparisons of inelastic scattering gamma production cross sections evaluated results with existing experimental data for transitions from the first excited state to the ground state, and from the third excited state to the ground state. Fig. 18(c)(d) show the comparisons of inelastic scattering gamma production cross sections evaluated results with existing experimental data for transitions from the first excited state to the ground state, and from the third excited state to the first excited state. G. Tessler et al. (1975) (EXFOR Entry: 10439) have measured the gamma-ray production cross sections for inelastic scattering on chromium isotope chains, and generally, the present results are reasonably consistent with those data.
The results of (n,γ) cross sections are compared with available experimental data as well as evaluated data from ENDF/B-VIII.1 and JENDL-5.0. Most experimental data are concentrated in the resonance energy region. The results for
$^{50,52,53}{\rm{Cr}}$ agree well with the existing experimental data, while there is a lack of experimental data for$^{54}{\rm{Cr}}$ . -
Fig. 19 shows the comparisons of evaluated results for the
$(n, p)$ reaction cross sections with the experimental data and the evaluated data. The results agree well with the existing experimental data. For$^{52}{\rm{Cr}}$ , existing evaluated data show noticeable discrepancies above 20 MeV. Our results are in good agreement with the experimental data for natural${\rm{Cr}}(n, x)^{52}{\rm{V}}$ reported by Uwamino et al. within the energy range of 5.5–38.5 MeV. Analysis indicates that the natural${\rm{Cr}}(n, x)^{52}{\rm{V}}$ cross sections measured by Uwamino et al. (1994) mainly originate from the$^{52}{\rm{Cr}}(n, p)^{52}{\rm{V}}$ and$^{53}{\rm{Cr}}(n, x)^{52}{\rm{V}}$ reaction channels, while the$^{54}{\rm{Cr}}(n, t)^{52}{\rm{V}}$ cross sections is about 1 b and its contribution is negligible. In the following Section (8), Fig. 24(b) and Fig. 25 are shown that the weighted sum of the individual reaction cross sections agrees well with the experimental data for natural Cr, and each reaction channel is consistent with the corresponding experimental data, thus providing strong support for the validity of the$^{52}{\rm{Cr}}(n, p)^{52}{\rm{V}}$ cross sections presented in this work.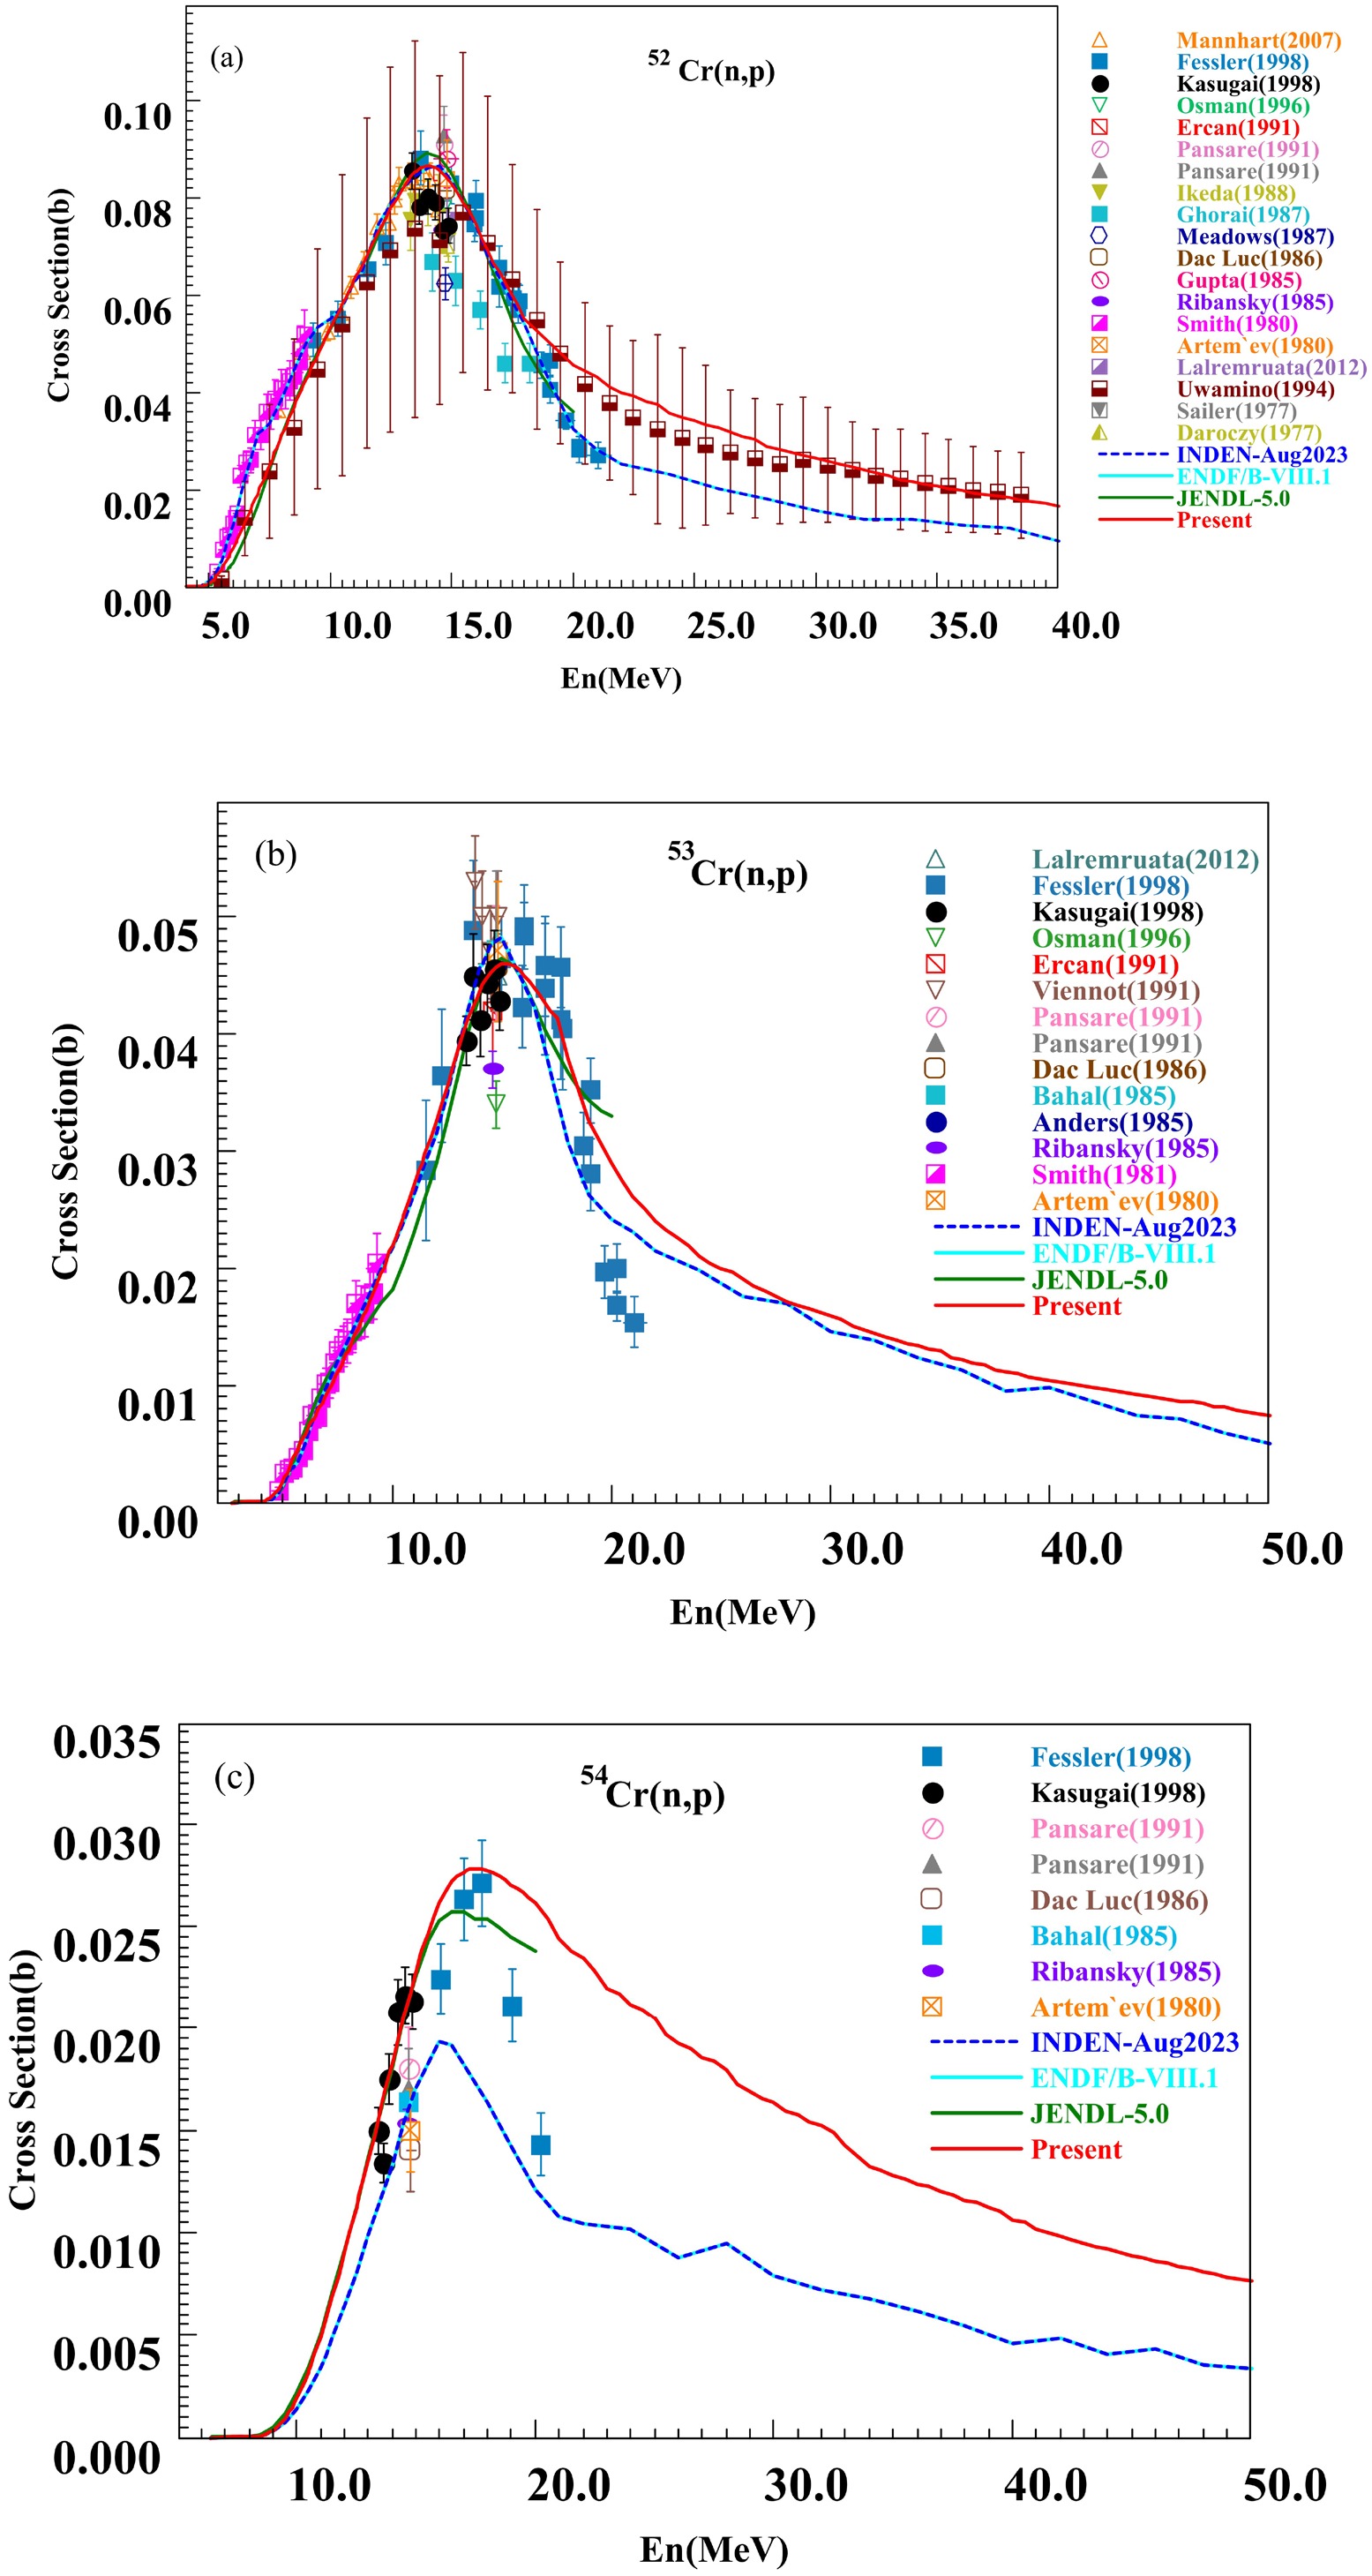
Figure 19. (color online) Comparison of
$^{52,53,54} {\rm{Cr}}(n,p)$ cross sections between evaluated data (red curve) and experimental data (symbols).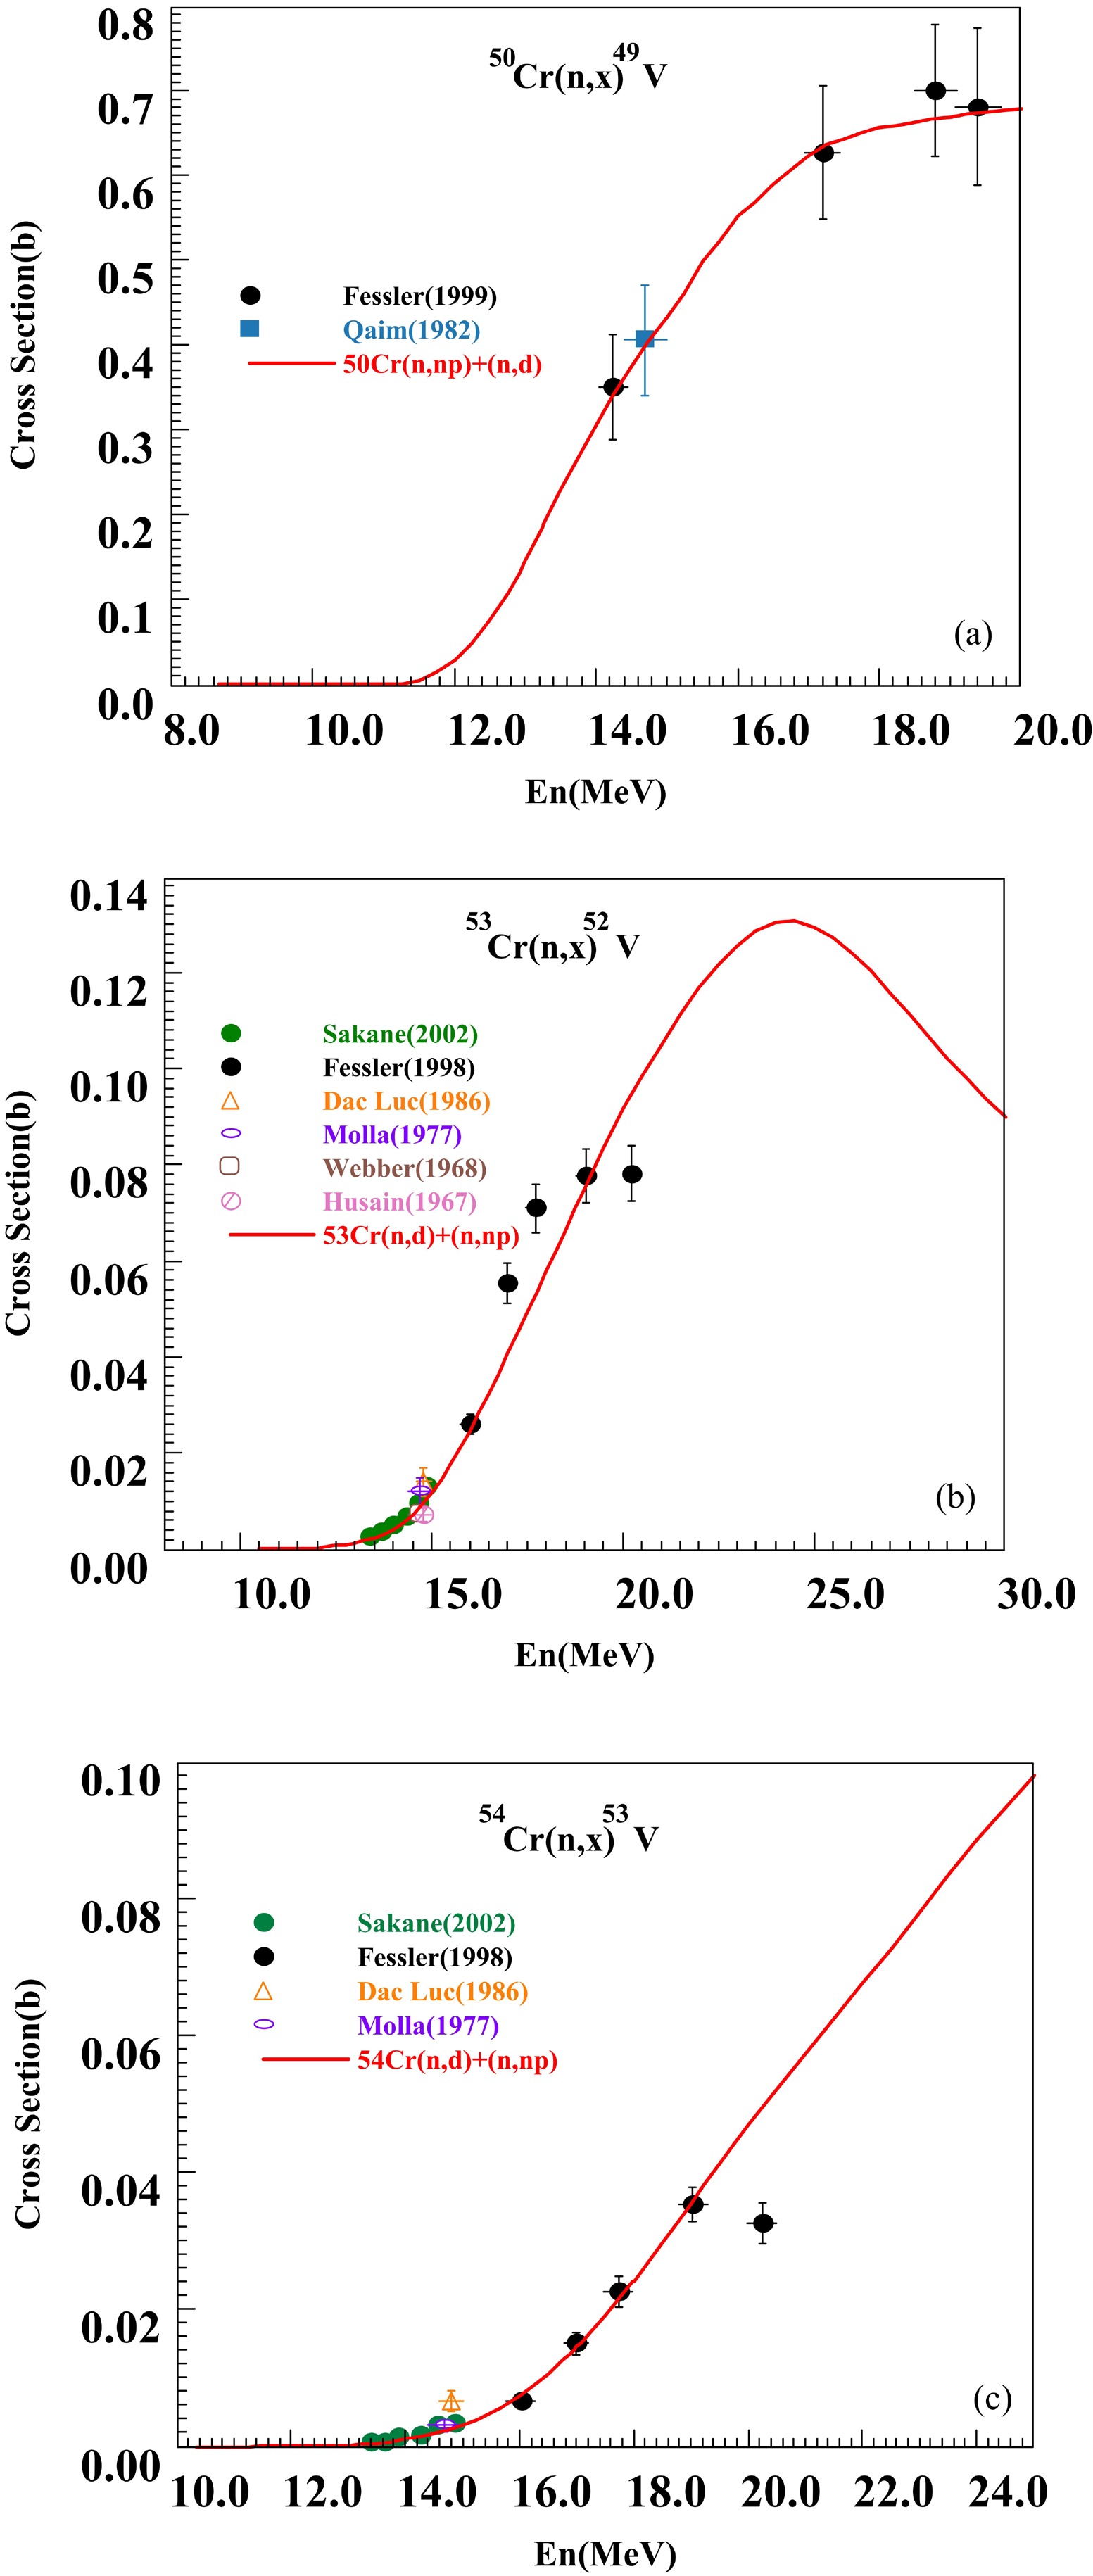
Figure 24. (color online) Comparison of
$^{50} {\rm{Cr}}(n,x)^{49} {\rm{V}}$ ,$^{53} {\rm{Cr}}(n,x)^{52} {\rm{V}}$ and$^{54} {\rm{Cr}}(n,x)^{53} {\rm{V}}$ cross sections between evaluated data (red curve) and experimental data (symbols).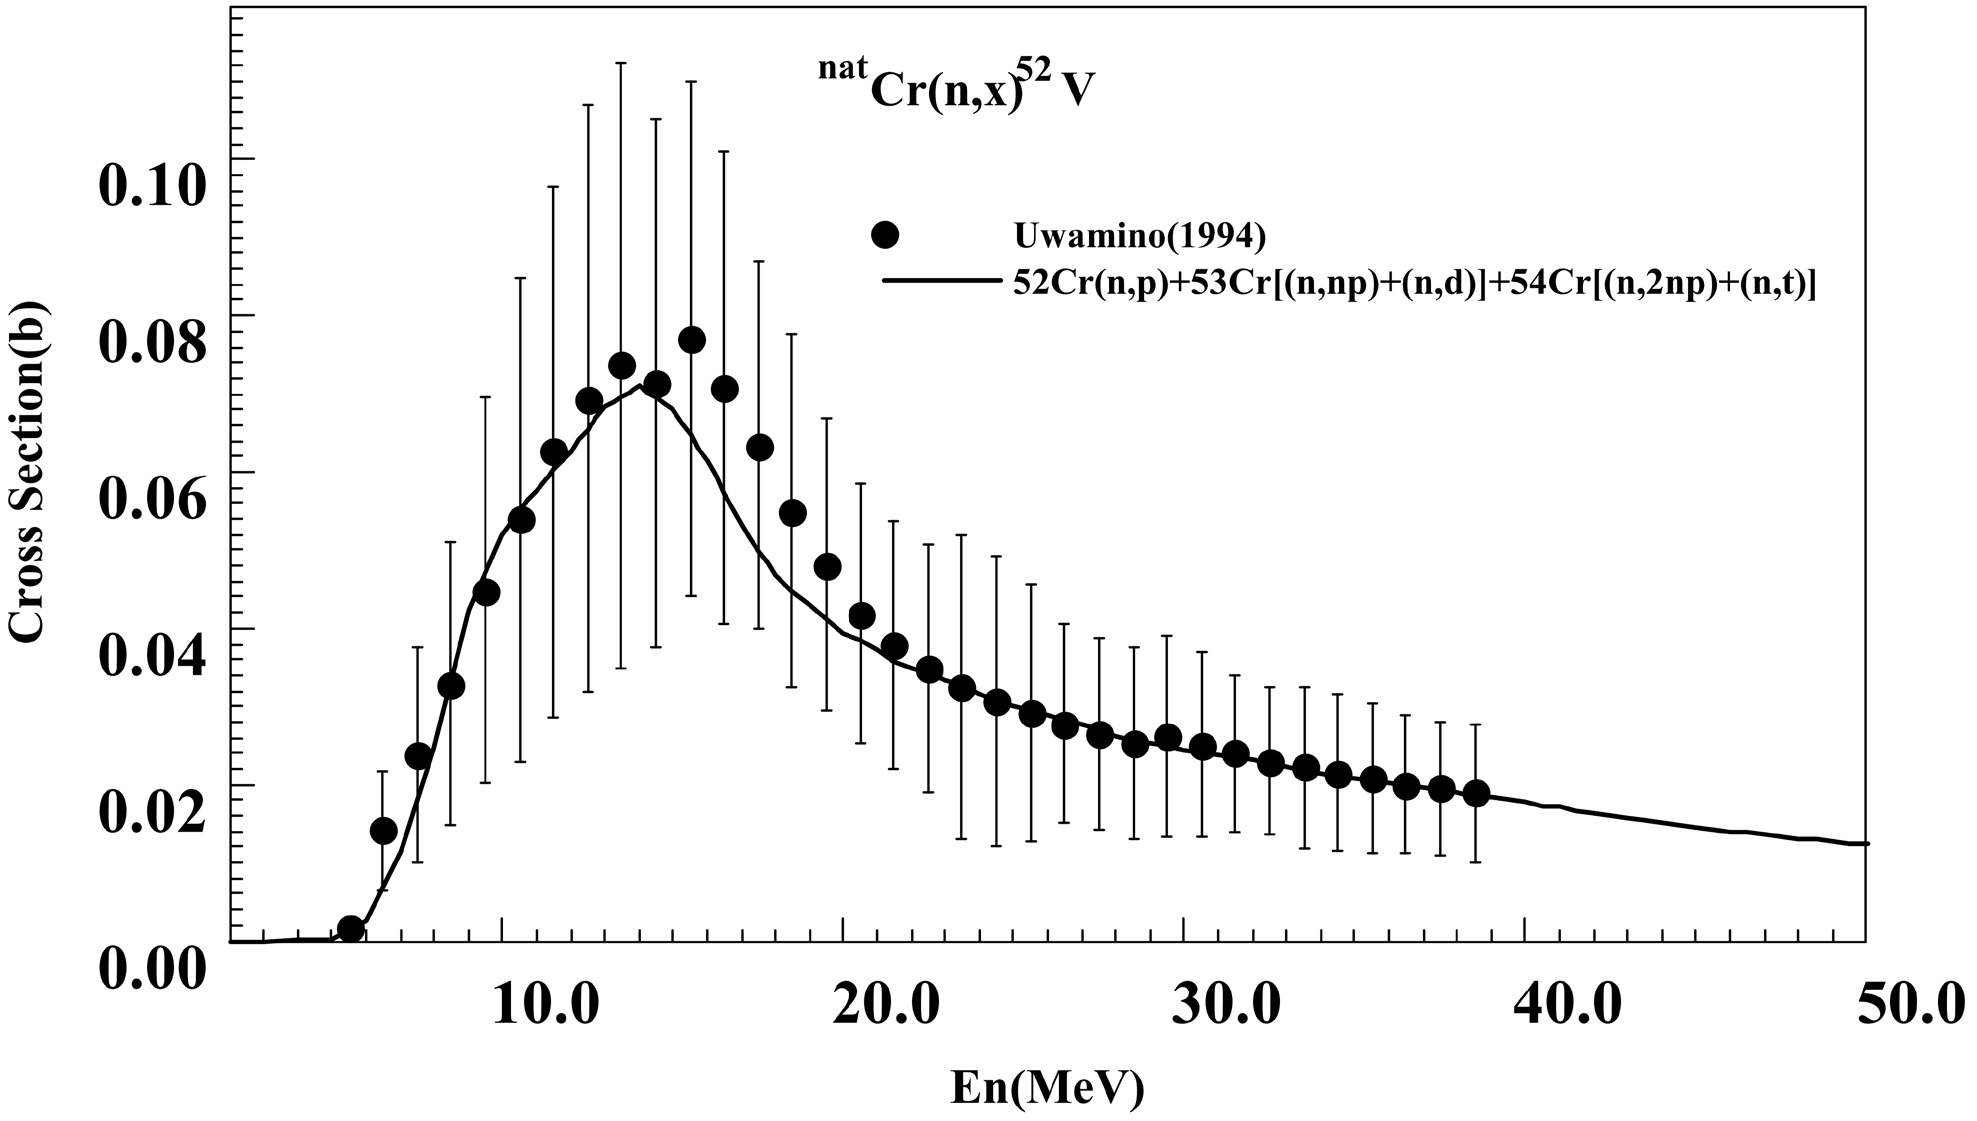
Figure 25. Comparison of
$^{nat} {\rm{Cr}}(n,x)^{52} {\rm{V}}$ cross sections between evaluated data (red curve) and experimental data (symbols). -
The comparison between the evaluated results and experimental data for the (n, α) reaction cross sections of
$^{50,53,54,nat}{\rm{Cr}}$ is shown in Fig. 20. The theoretical results for each isotope agree well with the experimental values, and their weighted sum is consistent with the experimental data for natural Cr. For the (n, α) reactions on$^{50,52,53}{\rm{Cr}}$ , only the experimental data reported by T. Khromyleva et al. (2018) (EXFOR Entry: 41653) are available, covering energy ranges of 4.7–7.2 MeV, 6.8–7.2 MeV, and 4.5–7.15 MeV, respectively; the evaluated results match these data well. The remaining data points in Fig. 20(a) are from measurements of the$^{50}{\rm{Cr}}(n,x)^{4}He$ cross sections. Given that the threshold for the$(n, n\alpha)$ reaction is 21.0 MeV, it can be considered that below 15 MeV cross sections originate entirely from the$^{50}{\rm{Cr}}(n,\alpha)$ reaction. The results in this work are in good agreement with the experimental data from I. Matsuyama et al. (1994) (EXFOR Entry:22358).
Figure 20. (color online) Comparison of
$^{50,53,54,nat} {\rm{Cr}}(n, \alpha)$ cross sections between evaluated data (red curve) and experimental data (symbols).For the
$(n,2n)$ reaction cross sections, the comparison results with experimental data, for$^{50,52,nat}{\rm{Cr}}$ are shown in Fig. 21. The theoretical results agree well with the existing experimental data except for the$^{50}{\rm{Cr}}(n,2n)$ reaction, where the evaluation results are higher than experimental data above 25 MeV. Discrepancies exist among the current evaluated data, and more experimental measurements are anticipated. For$^{52}{\rm{Cr}}(n,2n)$ cross sections, our results are consistent with the recommended experimental data. The$(n, \alpha)$ and$(n,2n)$ theoretical results for$^{50,52,53,54}{\rm{Cr}}$ , summed by isotopic abundances, agree well with natural chromium experimental data, as shown in Fig. 20(d) and Fig. 21(c). The evaluated results can reflect the systematic differences among isotopes and are consistent with the experimental data.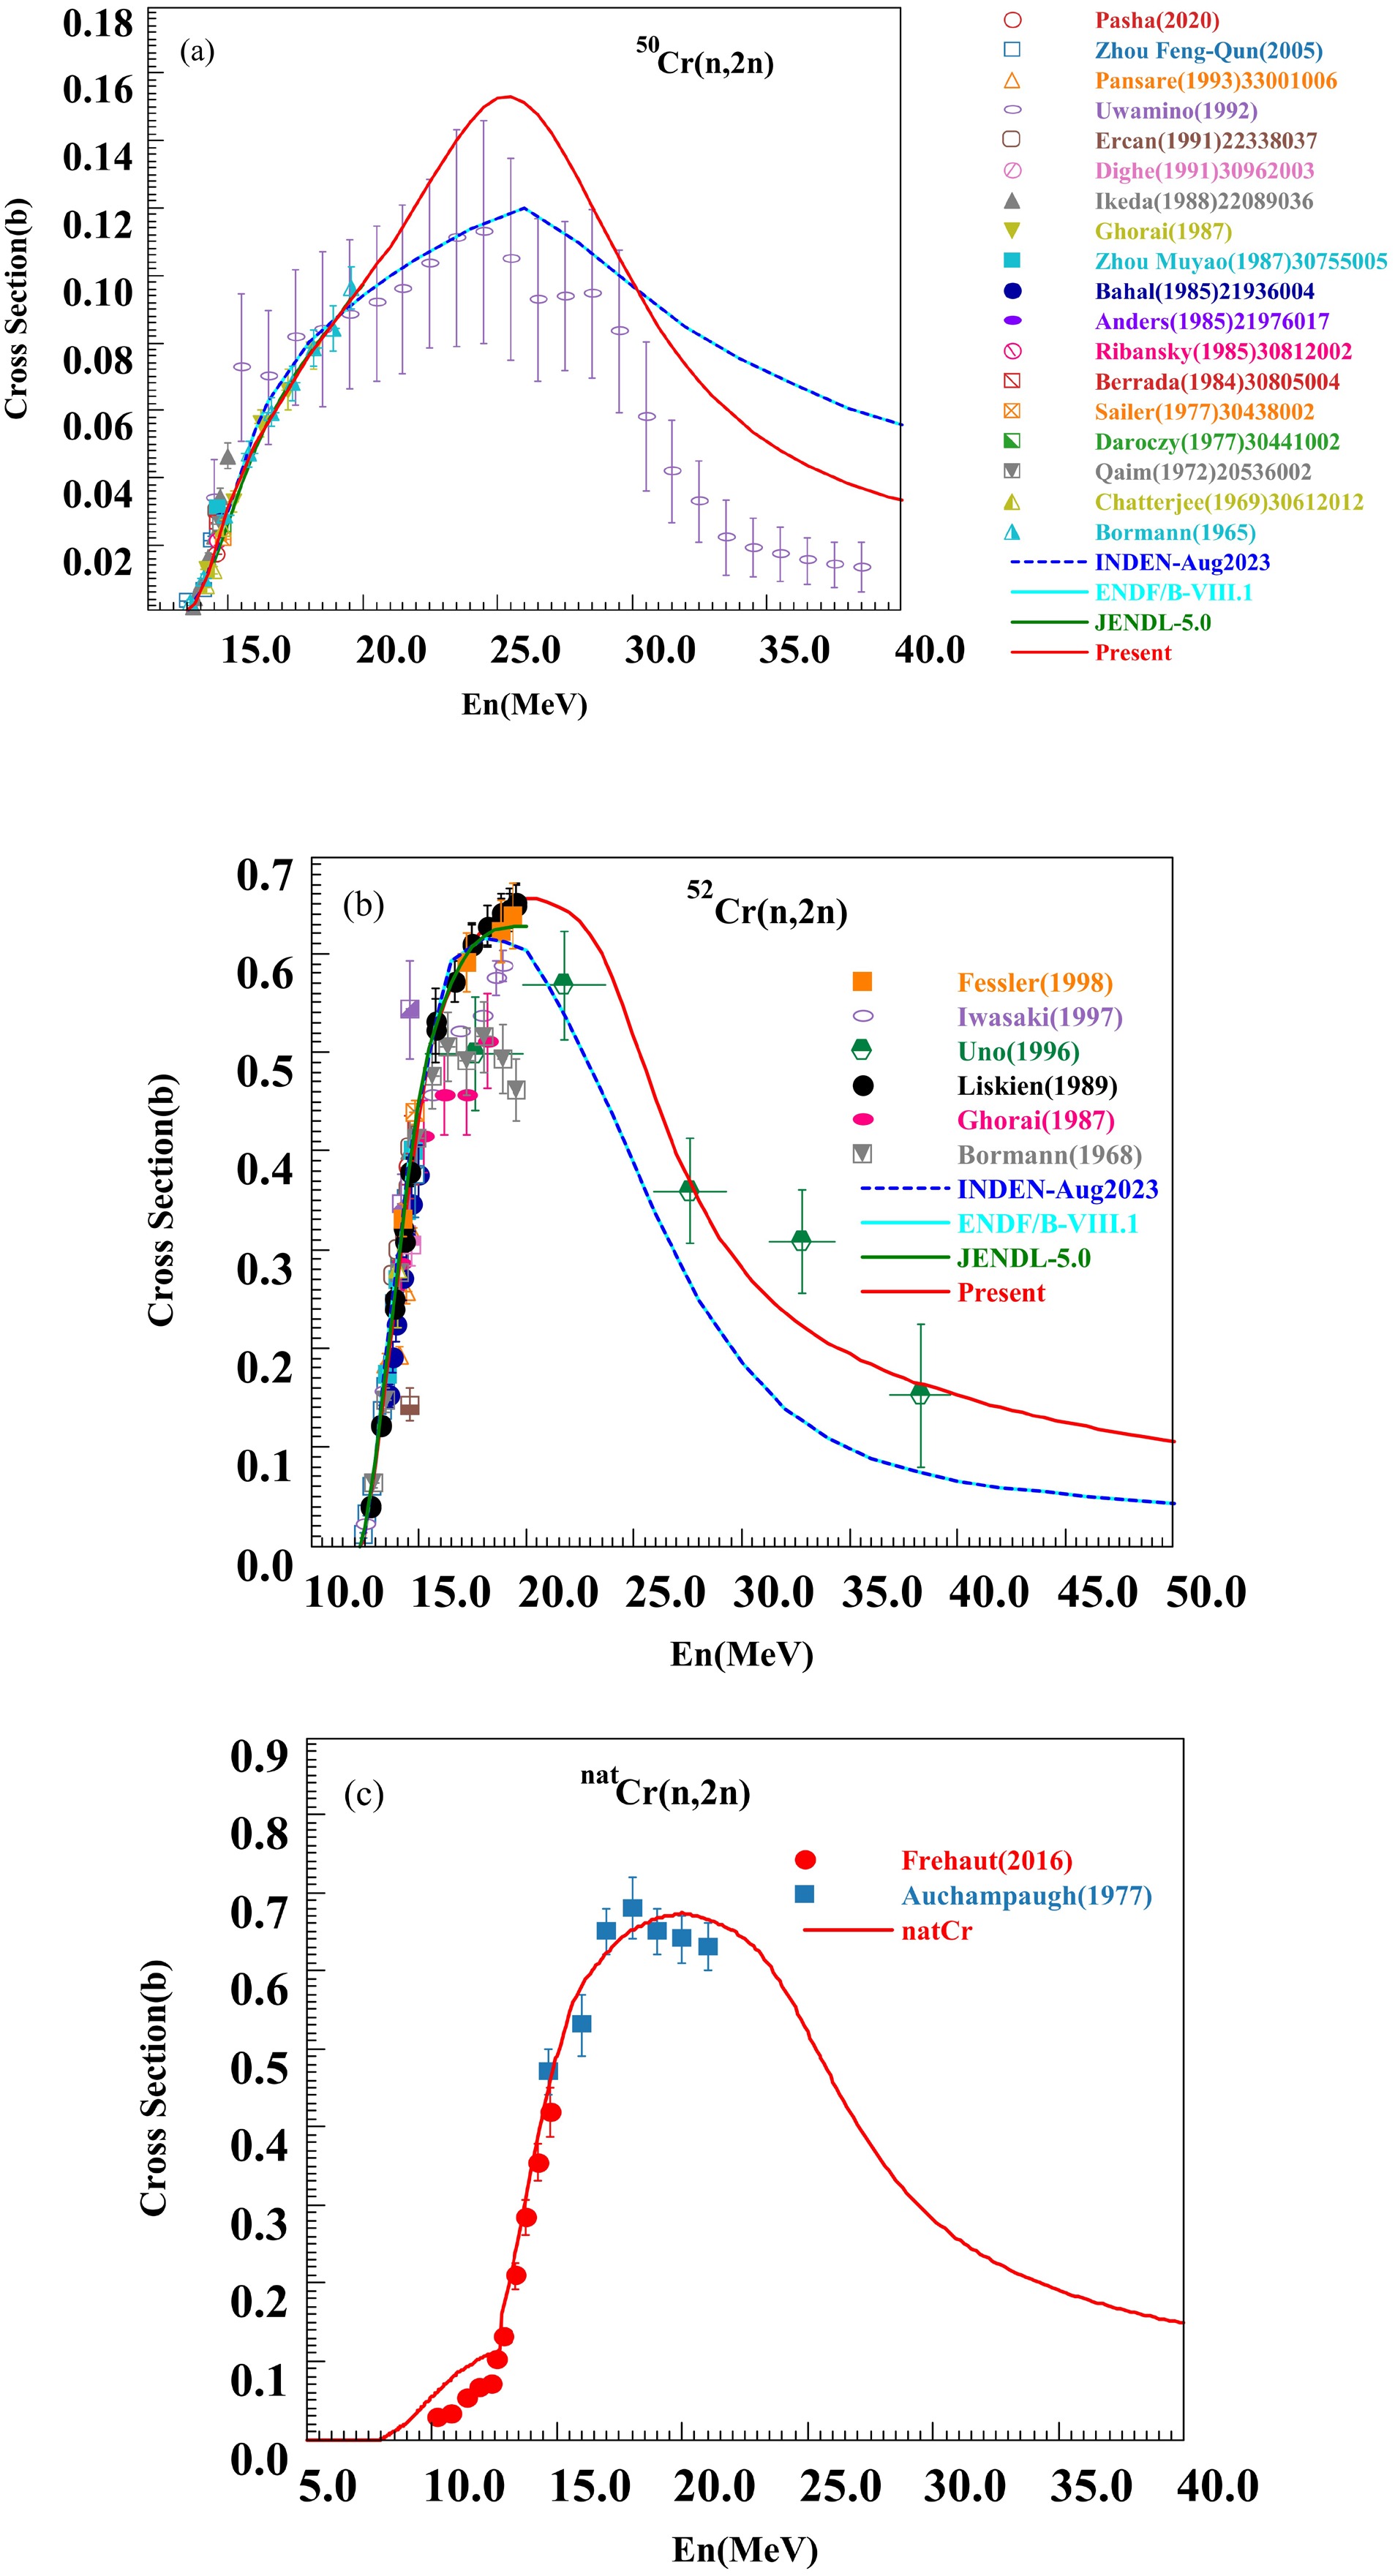
Figure 21. (color online) Comparison of
$^{50,52,nat} {\rm{Cr}}(n,2n)$ cross sections between evaluated data (red curve) and experimental data (symbols). -
The theoretical result for
$^{50}{\rm{Cr}}(n,d)$ reaction cross sections agrees well with the experimental data from S. M. Grimes et al. (EXFOR Entry: 10827) in 1979, as shown in Fig. 22. The upper three sets of experimental data in Fig. 23 are$^{50}{\rm{Cr}}(n,t)$ reaction cross sections, while the last set from V. Semkova et al.(2007) (EXFOR Entry: 22877) is the$^{50}{\rm{Cr}}(n,x)^{48}{\rm{V}}$ reaction cross sections. Below 20 MeV, the$(n,2np)$ reaction channel remains closed, and the cross sections contribution mainly come from the$(n,t)$ reaction. The theoretical results agree well with the experimental data. Experimental data for the$^{52,53,54}{\rm{Cr}}(n,t)$ reaction cross sections are lacking.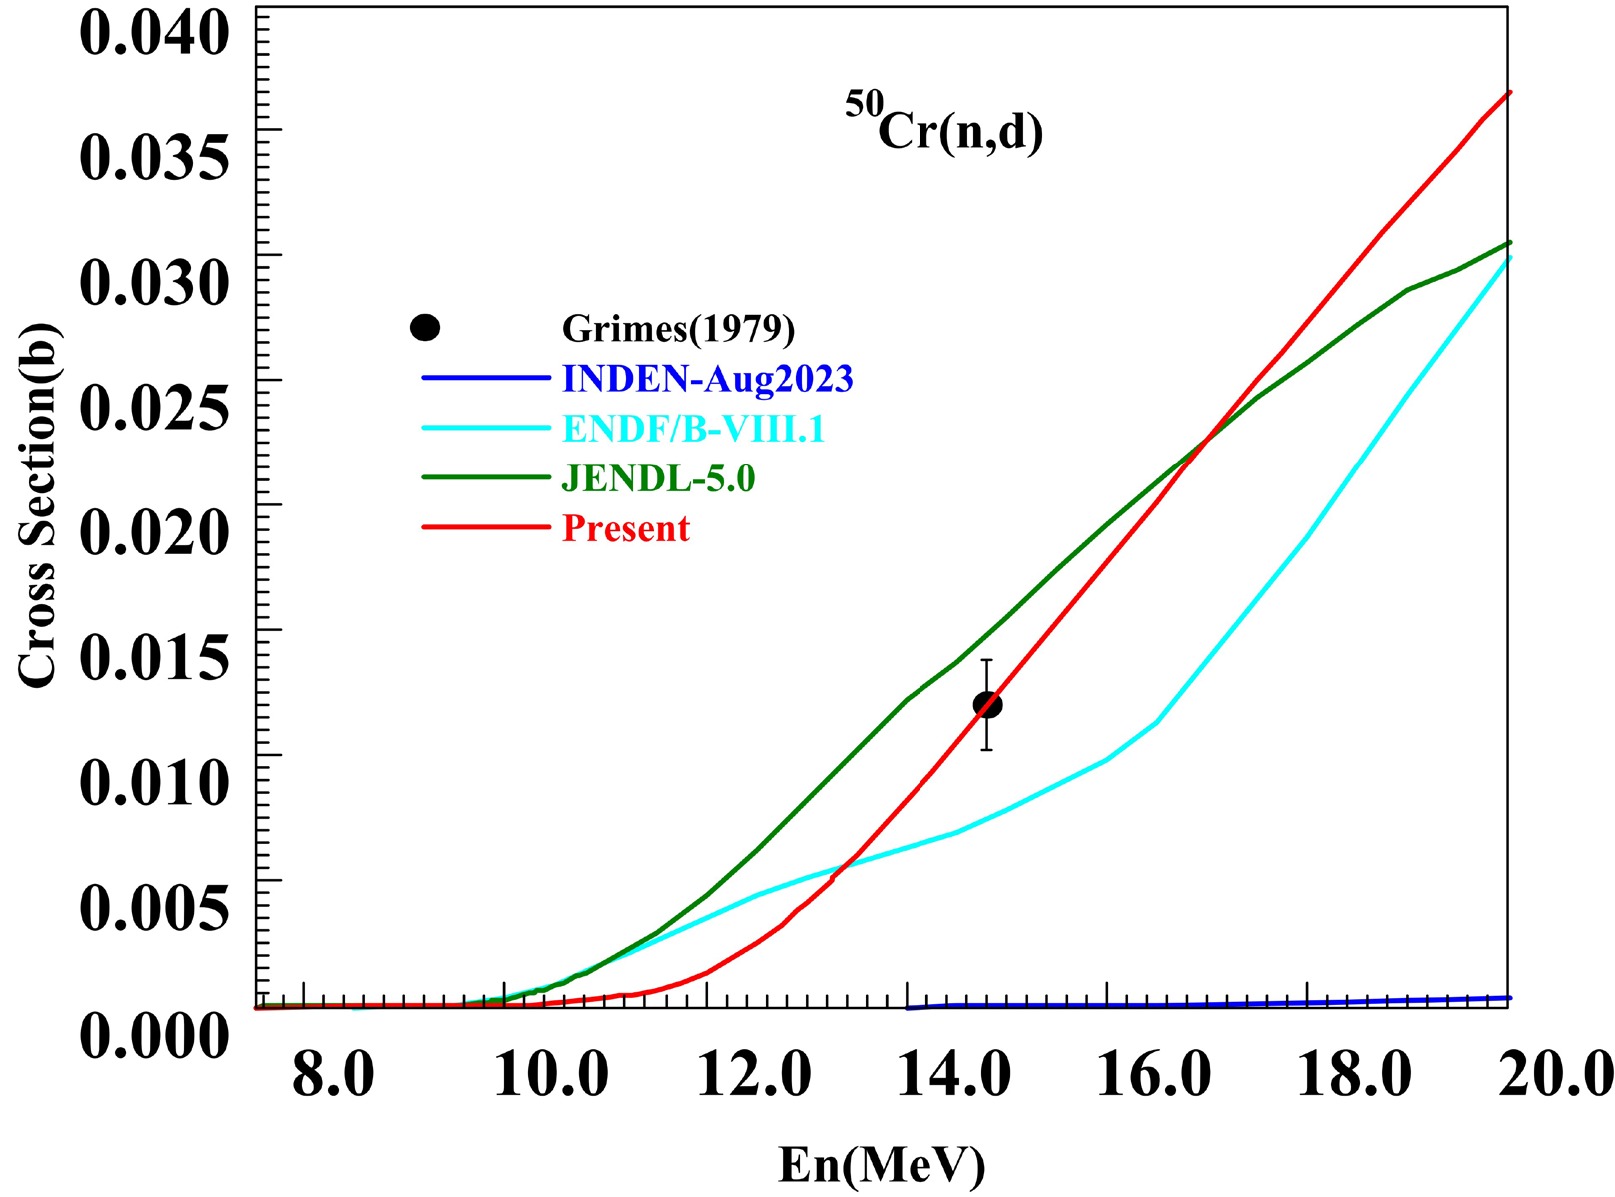
Figure 22. (color online) Comparison of
$^{50} {\rm{Cr}}(n, d)$ cross sections between evaluated data (red curve) and experimental data (symbols).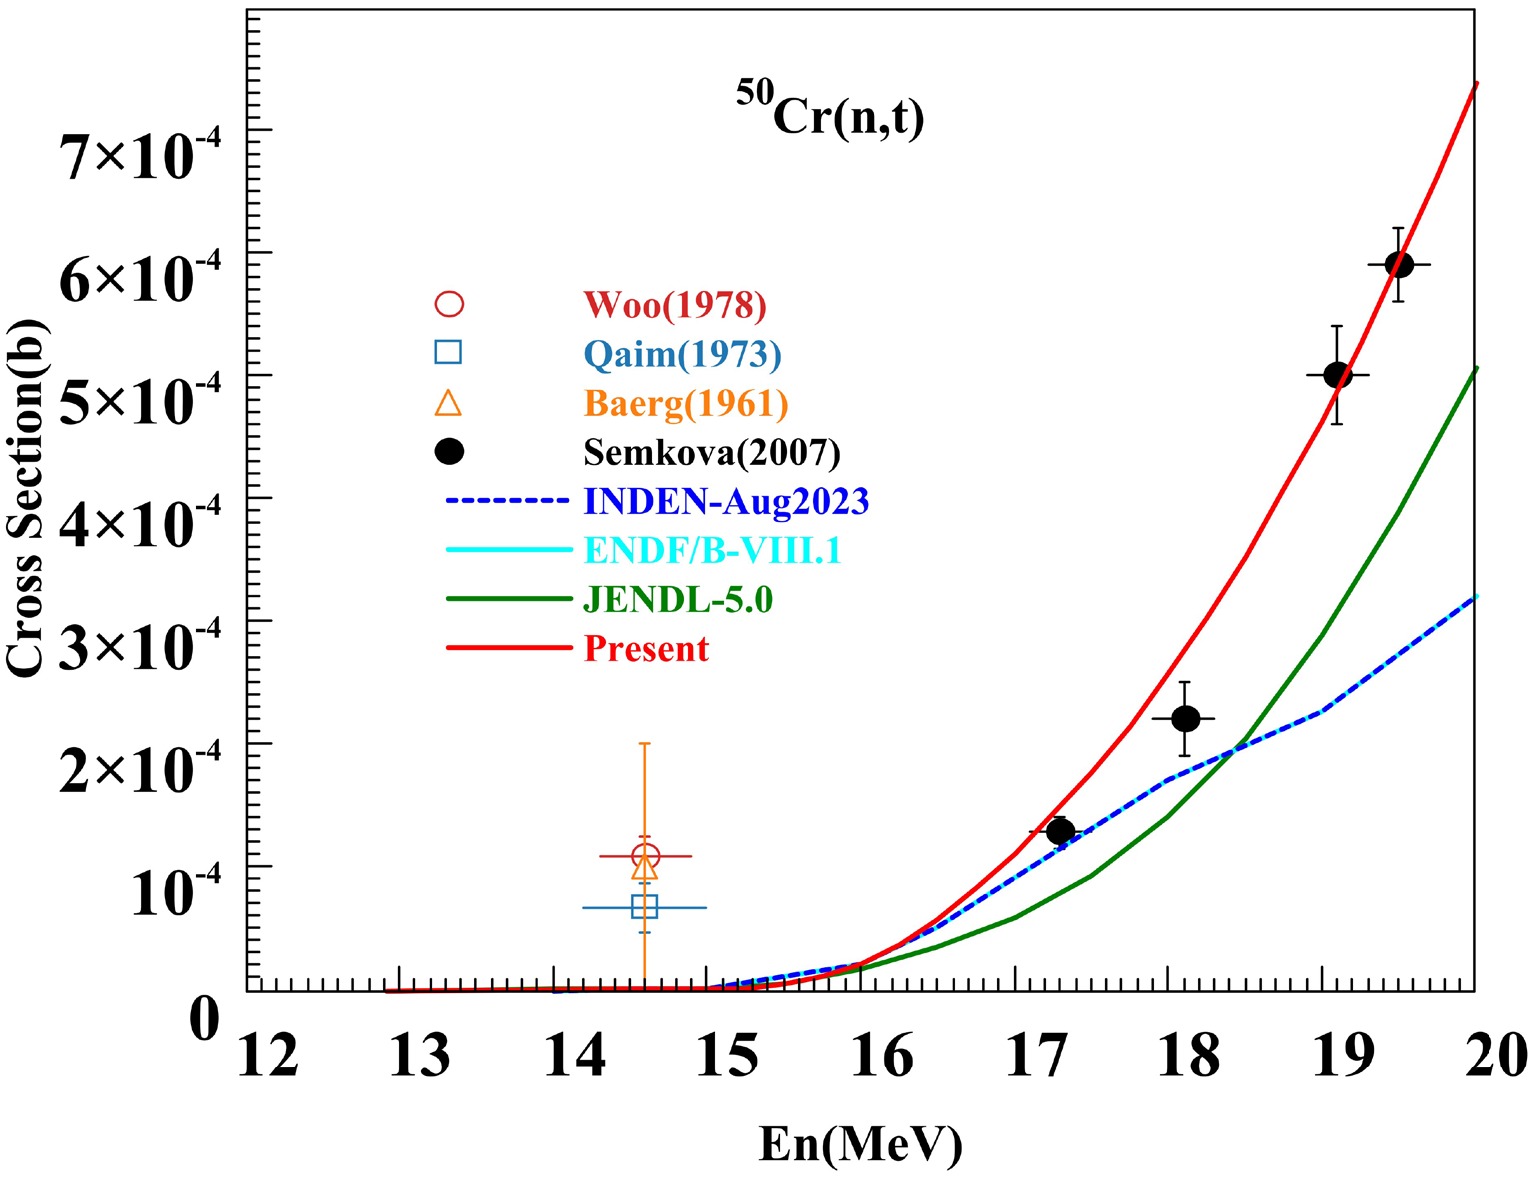
Figure 23. (color online) Comparison of
$^{50} {\rm{Cr}}(n, t)$ cross sections between evaluated data (red curve) and experimental data (symbols). -
The experimental data retrieved from the EXFOR library for
$^{50}{\rm{Cr}}(n, x)^{49}{\rm{V}}$ ,$^{53}{\rm{Cr}}(n, x)^{52}{\rm{V}}$ and$^{54}{\rm{Cr}}(n, x)^{53}{\rm{V}}$ reaction cross sections include contributions from both$(n, d)$ and$(n, np)$ reactions. Therefore, the theoretical results for$^{50,53,54}{\rm{Cr}}(n, d)$ and$^{50,53,54}{\rm{Cr}}(n, np)$ reaction cross sections are summed and compared with the experimental data. The results are in excellent agreement with the$(n, x)^{49}{\rm{V}}$ ,$(n, x)^{52}{\rm{V}}$ and$(n, x)^{53}{\rm{V}}$ data reported by Fessler et al. (EXFOR Entry: 22465, 22406), with discrepancies arising solely above 19 MeV where the evaluated results are slightly higher than the experimental measurements as shown in Fig. 24. After summing by isotopic abundances, the theoretical results for$^{52}{\rm{Cr}}(n, p)^{52}{\rm{V}}$ ,$^{53}{\rm{Cr}}(n, np)^{52}{\rm{V}}$ +$^{53}{\rm{Cr}}(n, d)^{52}{\rm{V}}$ , and$^{54}{\rm{Cr}}(n, 2np)^{52}{\rm{V}}$ +$^{54}{\rm{Cr}}(n, t)^{52}{\rm{V}}$ reaction cross sections agree well with the experimental data for$^{nat}{\rm{Cr}}(n, x)^{52}{\rm{V}}$ reaction, as shown in Fig. 25.At the same time, Fig. 26 shows the production cross sections of six types of fundamental particles (n, p, d, t,
$^{3}He$ , and α) on$^{52}{\rm{Cr}}$ below 200 MeV. Due to the lack of experimental data, the evaluation data relied on theoretical model calculations to give physically reasonable results.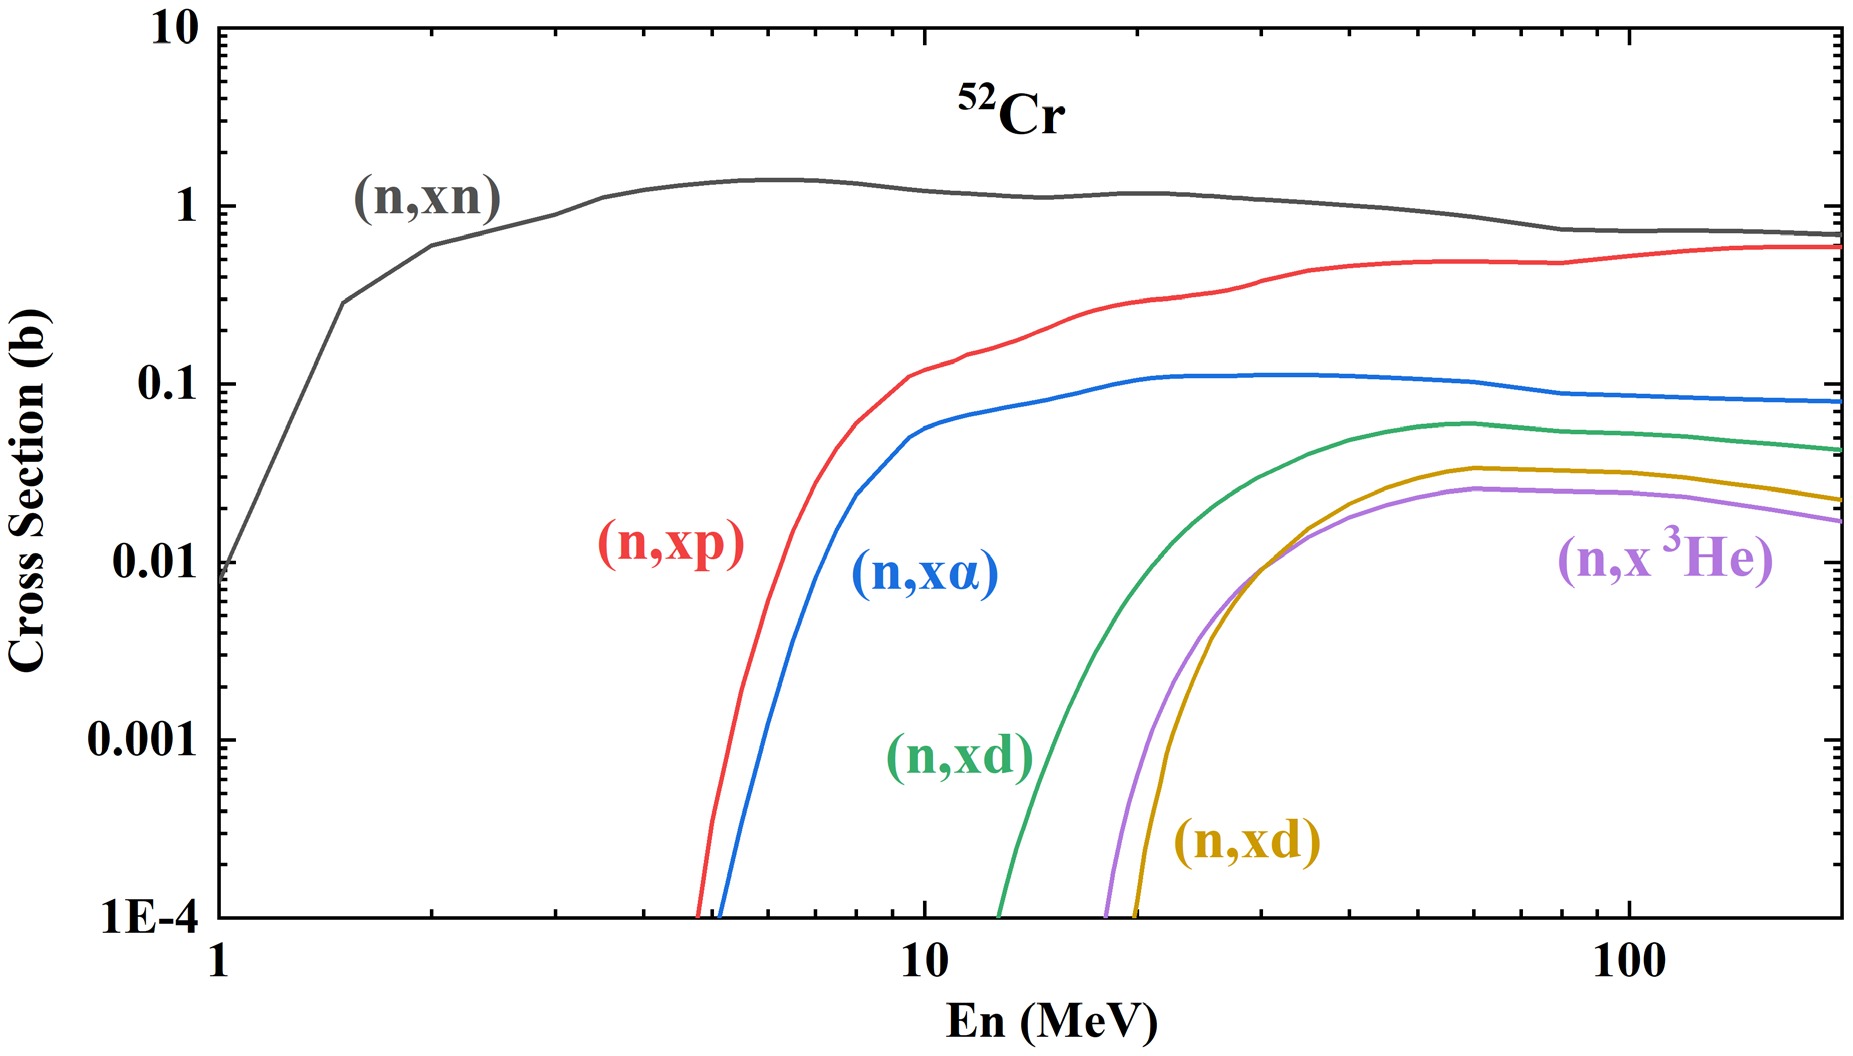
Figure 26. (color online) The production cross sections of six fundamental particles (n, p, d, t,
$^{3}He$ , and α) below 200 MeV. -
Due to the lack of experimental data on the double differential cross sections for neutron emission from
$^{50,52,53,54}{\rm{Cr}}(n, xn')$ reactions, the evaluated results of the double differential cross sections for neutron emission are compared and analyzed with the experimental data for natural chromium. S. Matsuyama et al. (1993) (EXFOR Entry: 22352) have published data on the double differential cross sections for neutron emission at an incident neutron energy of 14.1 MeV, with emission angles ranging from 20.0° to 150.0°. The consistency between the evaluated results for$^{50,52,54}{\rm{Cr}}$ and the experimental data is depicted in Fig. 27. Evaluated results show good agreement with experimental data, reproducing both the elastic peak and intermediate-energy structures. For$^{50}{\rm{Cr}}$ , the theoretical results fall below experimental data in the low-energy region. We attribute this discrepancy to the$^{50}{\rm{Cr}}(n,2n)$ reaction threshold of 13.263 MeV: while evaluated results neglect contributions from secondary particle processes, experimental measurements may include such effects. As can be observed in Fig. 22(a), the$^{50}{\rm{Cr}}(n,2n)$ cross section at 14.1 MeV is significantly small.
Figure 27. (color online) Comparisons of
$^{50,52,54} {\rm{Cr}}(n,xn)$ double-differential cross sections at different angles for an incident energy of 14.1 MeV between the evaluated data (solid curves) and experimental data reported by S.Matsuyama (1993) (symbols). In each panel, the topmost curve for 20.0 degree remains the true reported values in the literature, and the other results from 30.0 to 150.0 degree are multiplied by factors of 0.1, 0.01, and so on, respectively.D. Schmidt et al. (1997) (EXFOR Entry: 22411) provided experimental data on the double differential cross sections for neutron emission from
$^{nat}{\rm{Cr}}$ at incident neutron energies ranging from 7.95 to 14.10 MeV and emission angles between 25.0° and 160.0°.The results are in good agreement with the experimental data across all angular positions within the full energy range. Given the substantial volume of experimental measurement data, we herein take 9 MeV, 10.79 MeV and 11.44 MeV as representative cases to illustrate the evaluated double differential cross sections for neutron emission from
$^{52}{\rm{Cr}}$ ,$^{50}{\rm{Cr}}$ , and$^{54}{\rm{Cr}}$ in Fig. 28 to 30.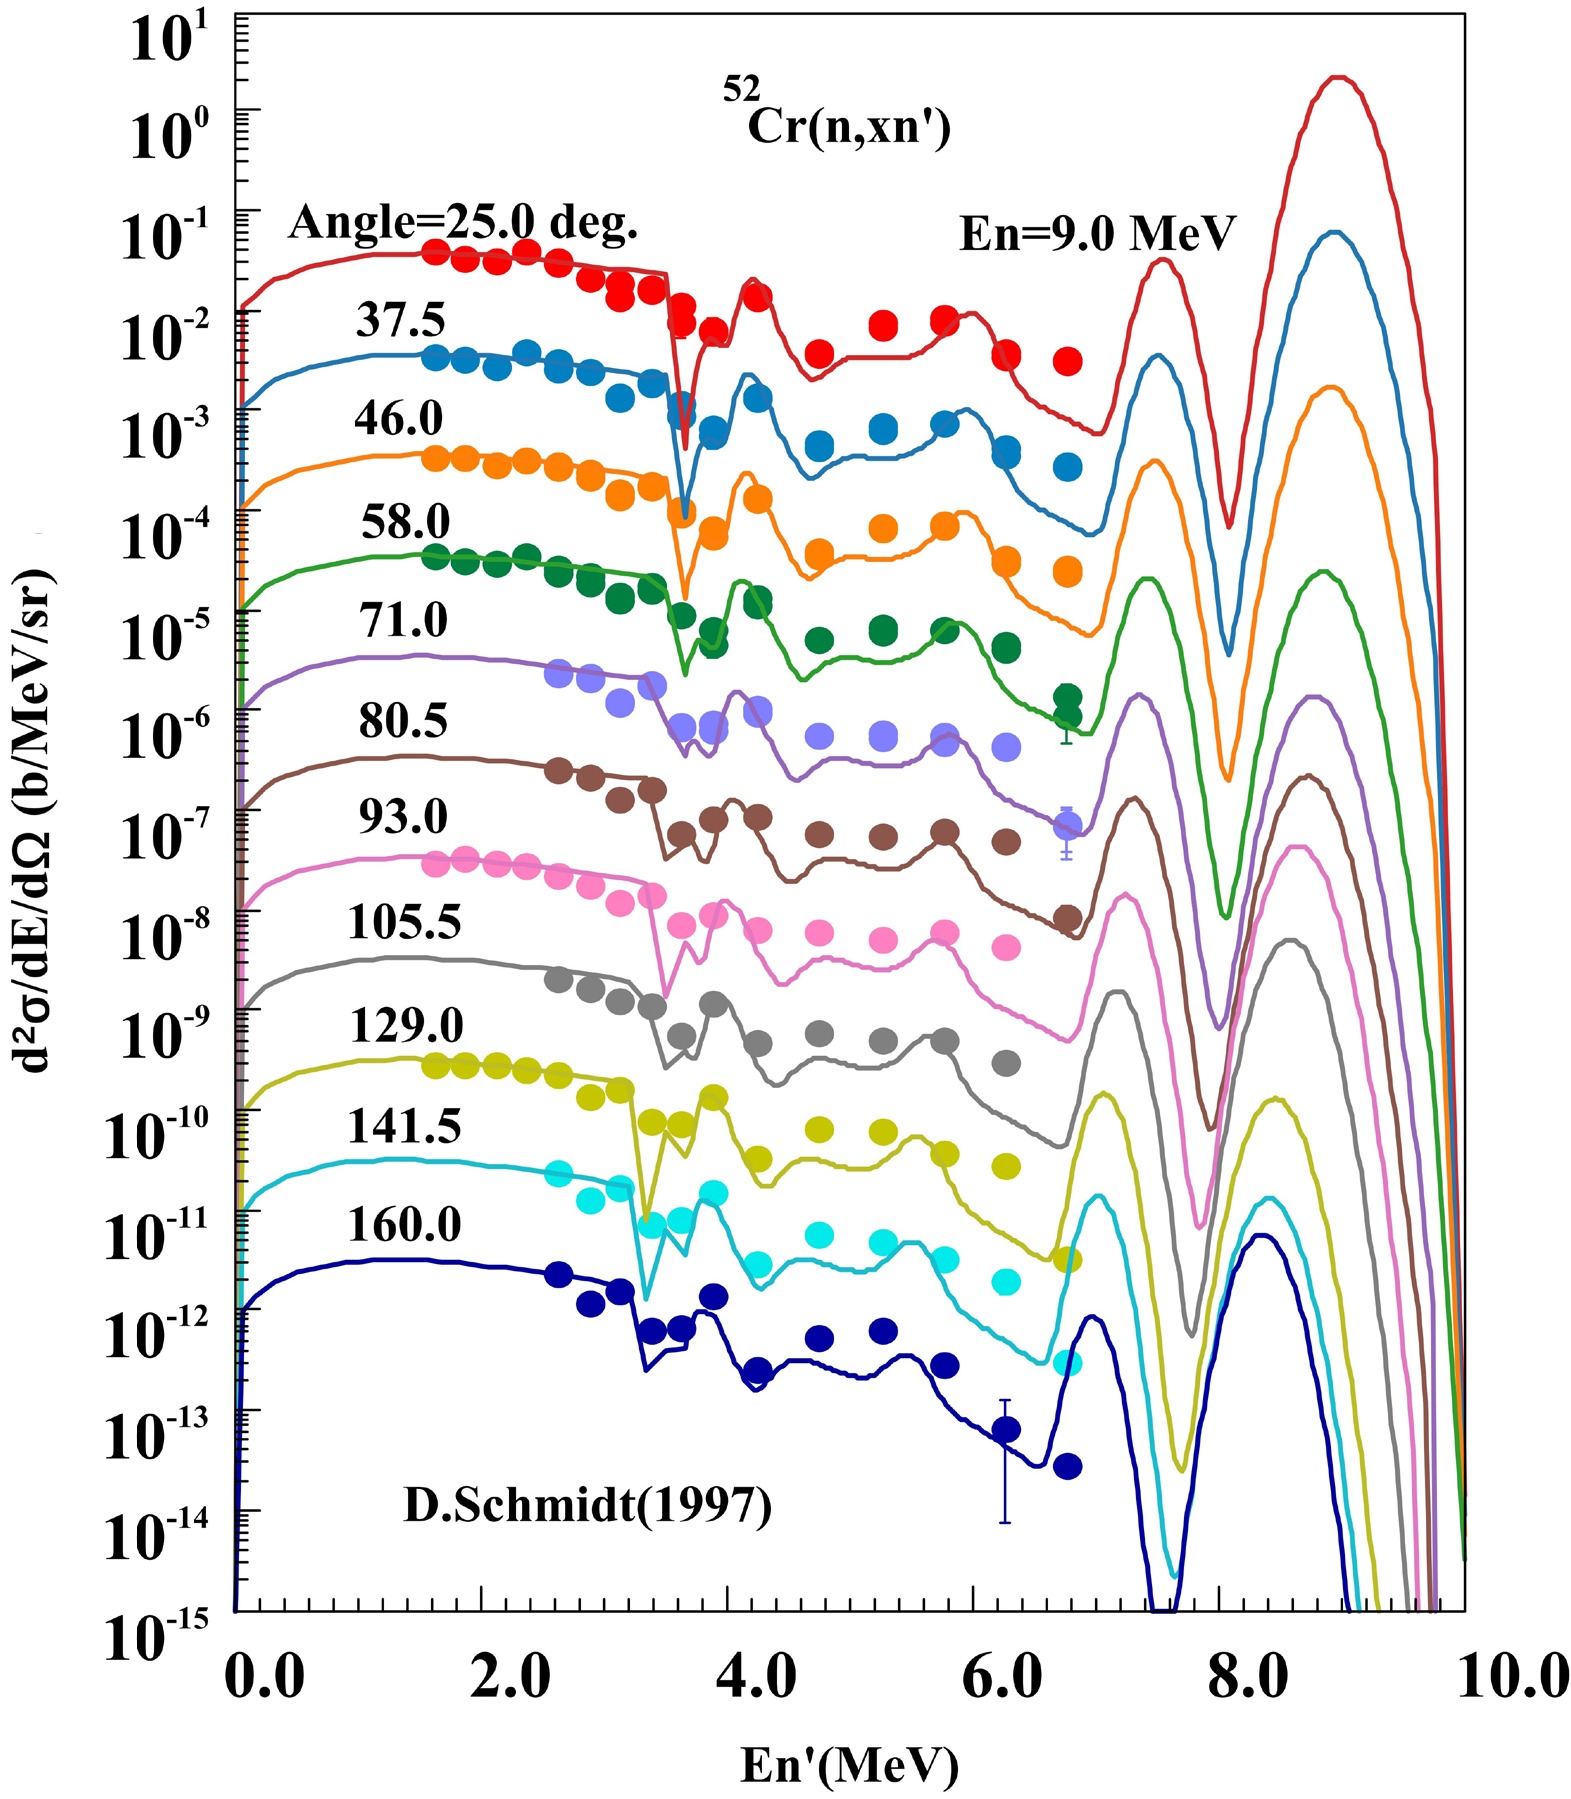
Figure 28. (color online) Comparisons of
$^{52} {\rm{Cr}}(n,xn)$ double-differential cross sections at different angles for an incident energy of 9.0 MeV between the evaluated data (solid curves) and experimental data (symbols). The topmost curve for 25.0 degree remains the true reported values in the literature, and the other results from 37.5 to 160.0 degree are multiplied by factors of 0.1, 0.01, and so on, respectively.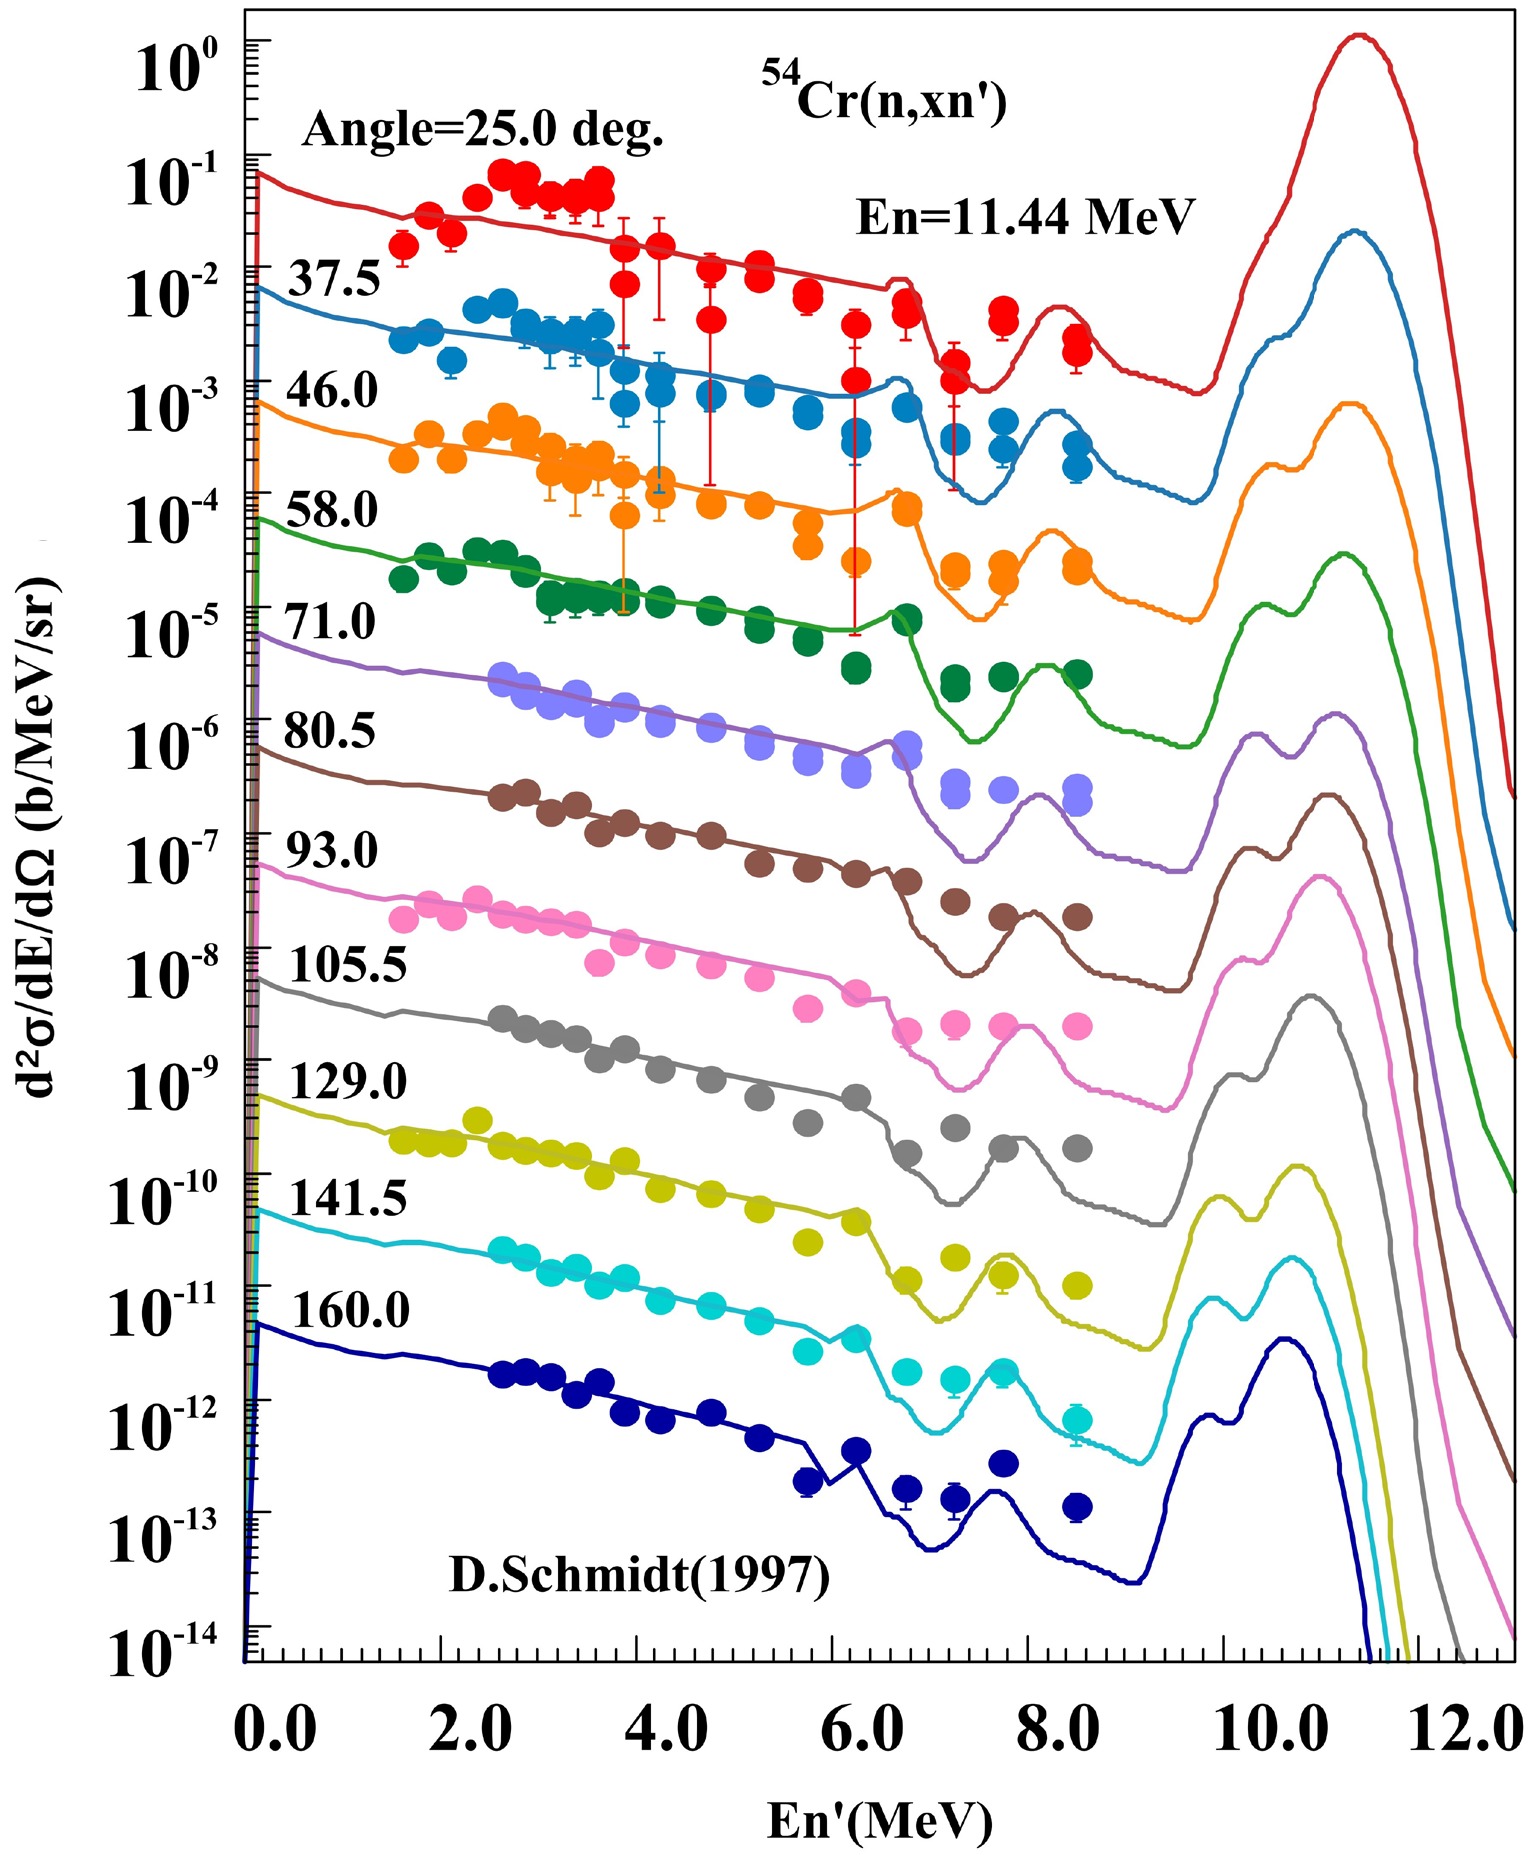
Figure 30. (color online) Comparisons of
$^{54} {\rm{Cr}}(n,xn)$ double-differential cross sections at different angles for an incident energy of 11.44 MeV between the evaluated data (solid curves) and experimental data (symbols). The topmost curve for 25.0 degree remains the true reported values in the literature, and the other results from 37.5 to 160.0 degree are multiplied by factors of 0.1, 0.01, and so on, respectively.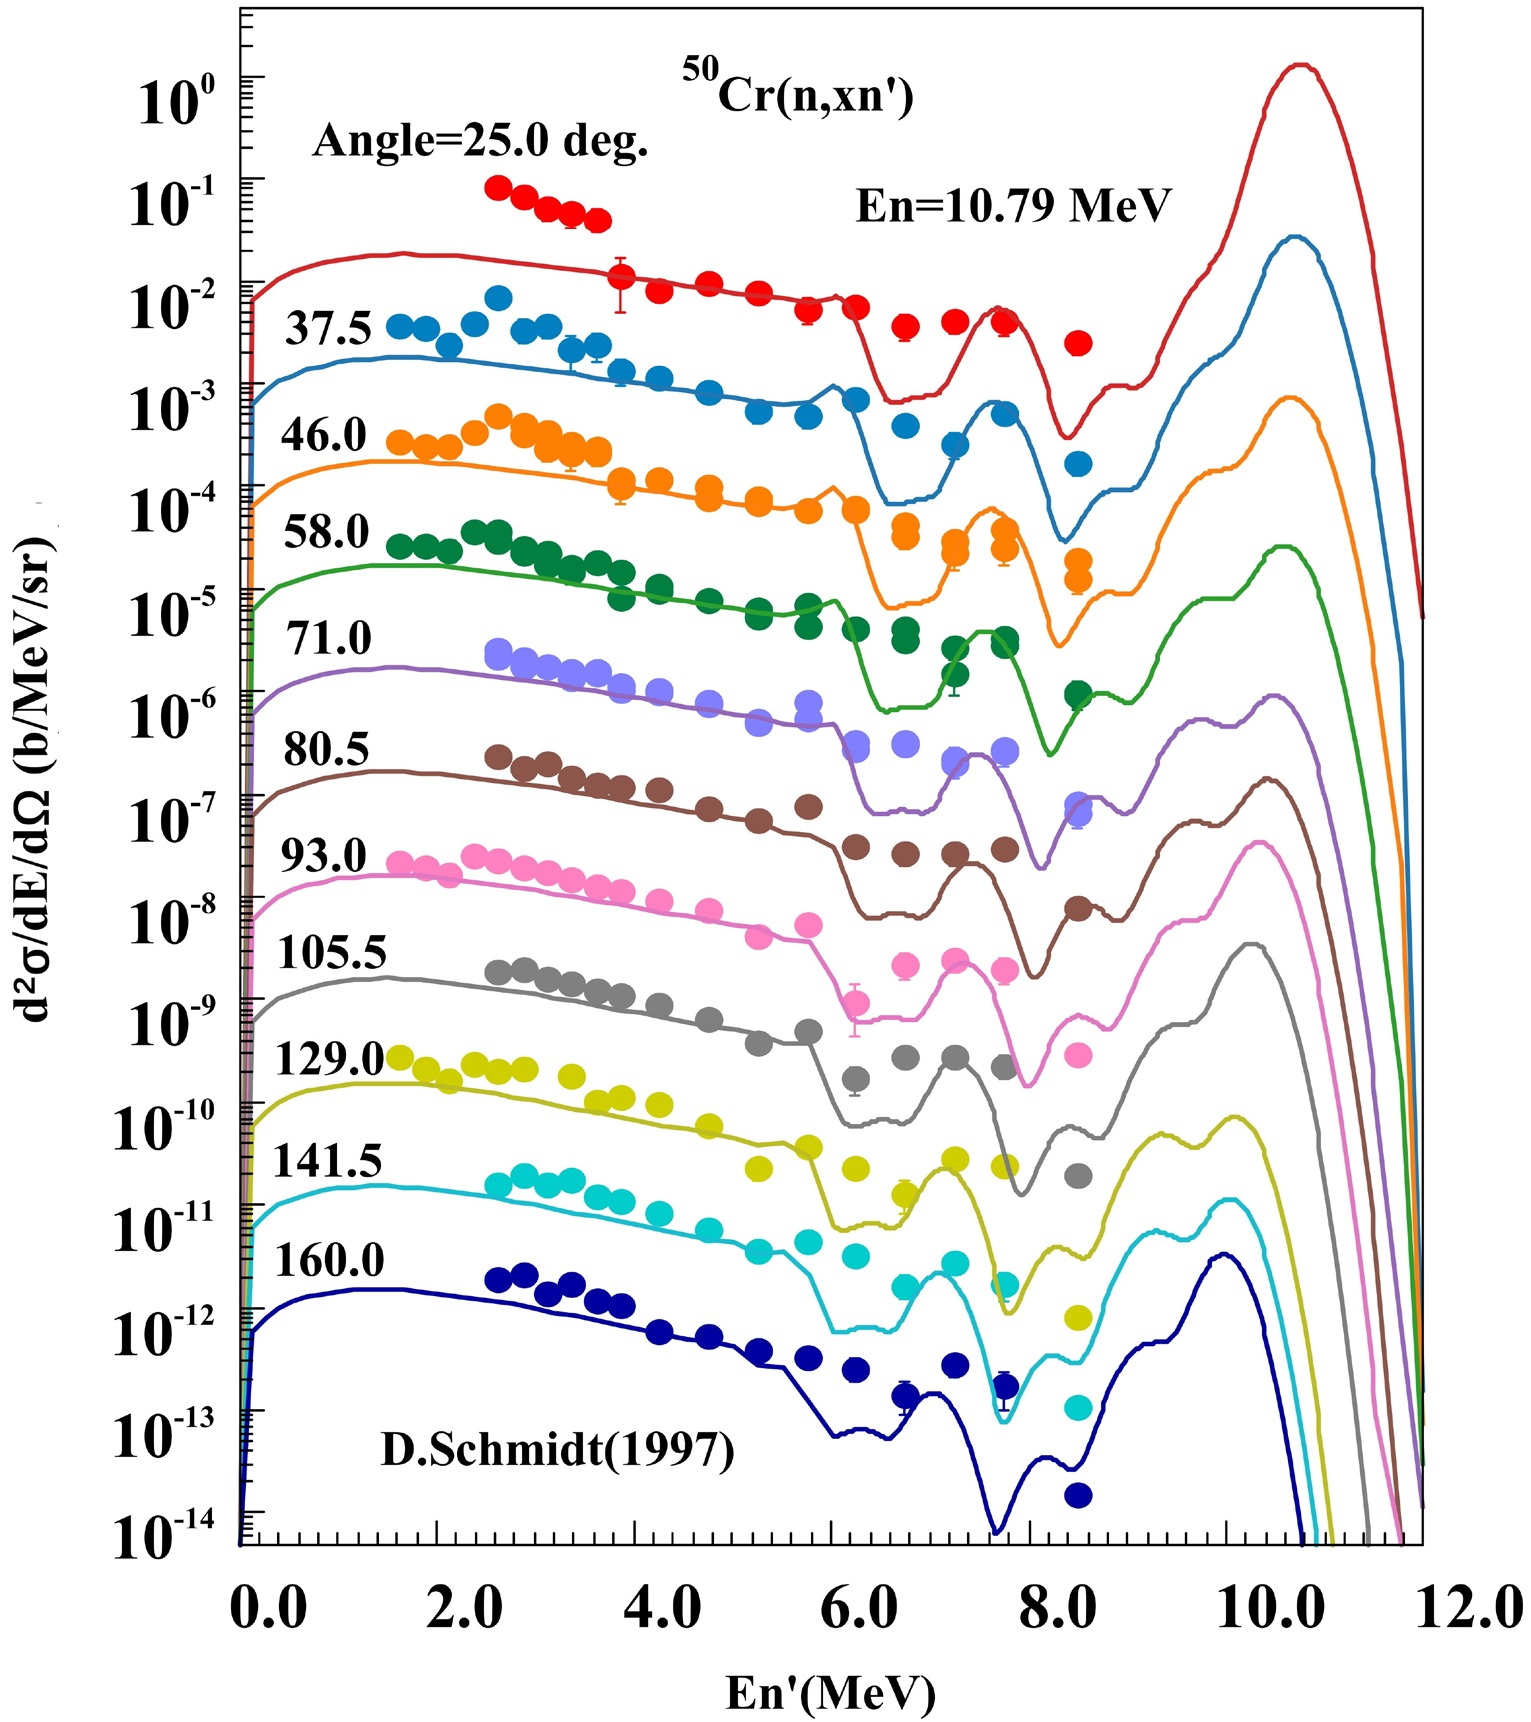
Figure 29. (color online) Comparisons of
$^{50} {\rm{Cr}}(n,xn)$ double-differential cross sections at different angles for an incident energy of 10.79 MeV between the evaluated data (solid curves) and experimental data (symbols).The topmost curve for 25.0 degree remains the true reported values in the literature, and the other results from 37.5 to 160.0 degree are multiplied by factors of 0.1, 0.01, and so on, respectively.A. Takahashi et al.(1983) (EXFOR Entry: 21875) have measured the double differential cross sections for neutron emission at incident neutron energies ranging from 13.35 to 14.83 MeV, with emission angles between 18.0° and 159.0°. The comparison between the theoretical results for
$^{50,54}{\rm{Cr}}$ and the experimental data is shown in Fig. 31. The results basically give a satisfactory description of the experimental data in the whole emission energy range.
Figure 31. (color online) Comparisons of
$^{50,54} {\rm{Cr}}(n,xn)$ double-differential cross sections at different angles for different incident energy from 14.83 MeV to 13.35 MeV between the evaluated data (solid curves) and experimental data reported by A.Takahashi (1983) (symbols). In each panel, the topmost curve for 14.83 MeV and 18.0 degree remains the true reported values in the literature, and the other results from top to bottom are multiplied by factors of 0.1, 0.01, and so on, respectively.The results and CENDL-3.2 evaluated data for
$^{50,52,53,54}{\rm{Cr}}$ , summed by isotopic abundances, are compared with natural chromium experimental data from A. Takahashi et al.(1983). The corresponding results are presented in Fig. 32. The present results can describe the structure of the discrete level contribution part more reasonably.
Figure 32. (color online) Comparison of isotopically abundance-weighted
$(n, xn)$ double-differential cross sections for$^{50,52,53,54} {\rm{Cr}}$ at different angles for an incident energy of 14.1 MeV between evaluated data (solid curves) and experimental data reported by S.Matsuyama (1993) (symbols). The topmost curve for 20.0 degree remains the true reported values in the literature, and the other results from 30.0 to 150.0 degree are multiplied by factors of 0.1, 0.01, and so on, respectively. -
The double differential cross sections for the proton and alpha particle emissions are compared with the existing experimental data from
$^{50,52}{\rm{Cr}}$ in Fig. 33 to 34. The results basically agree well with the experimental data.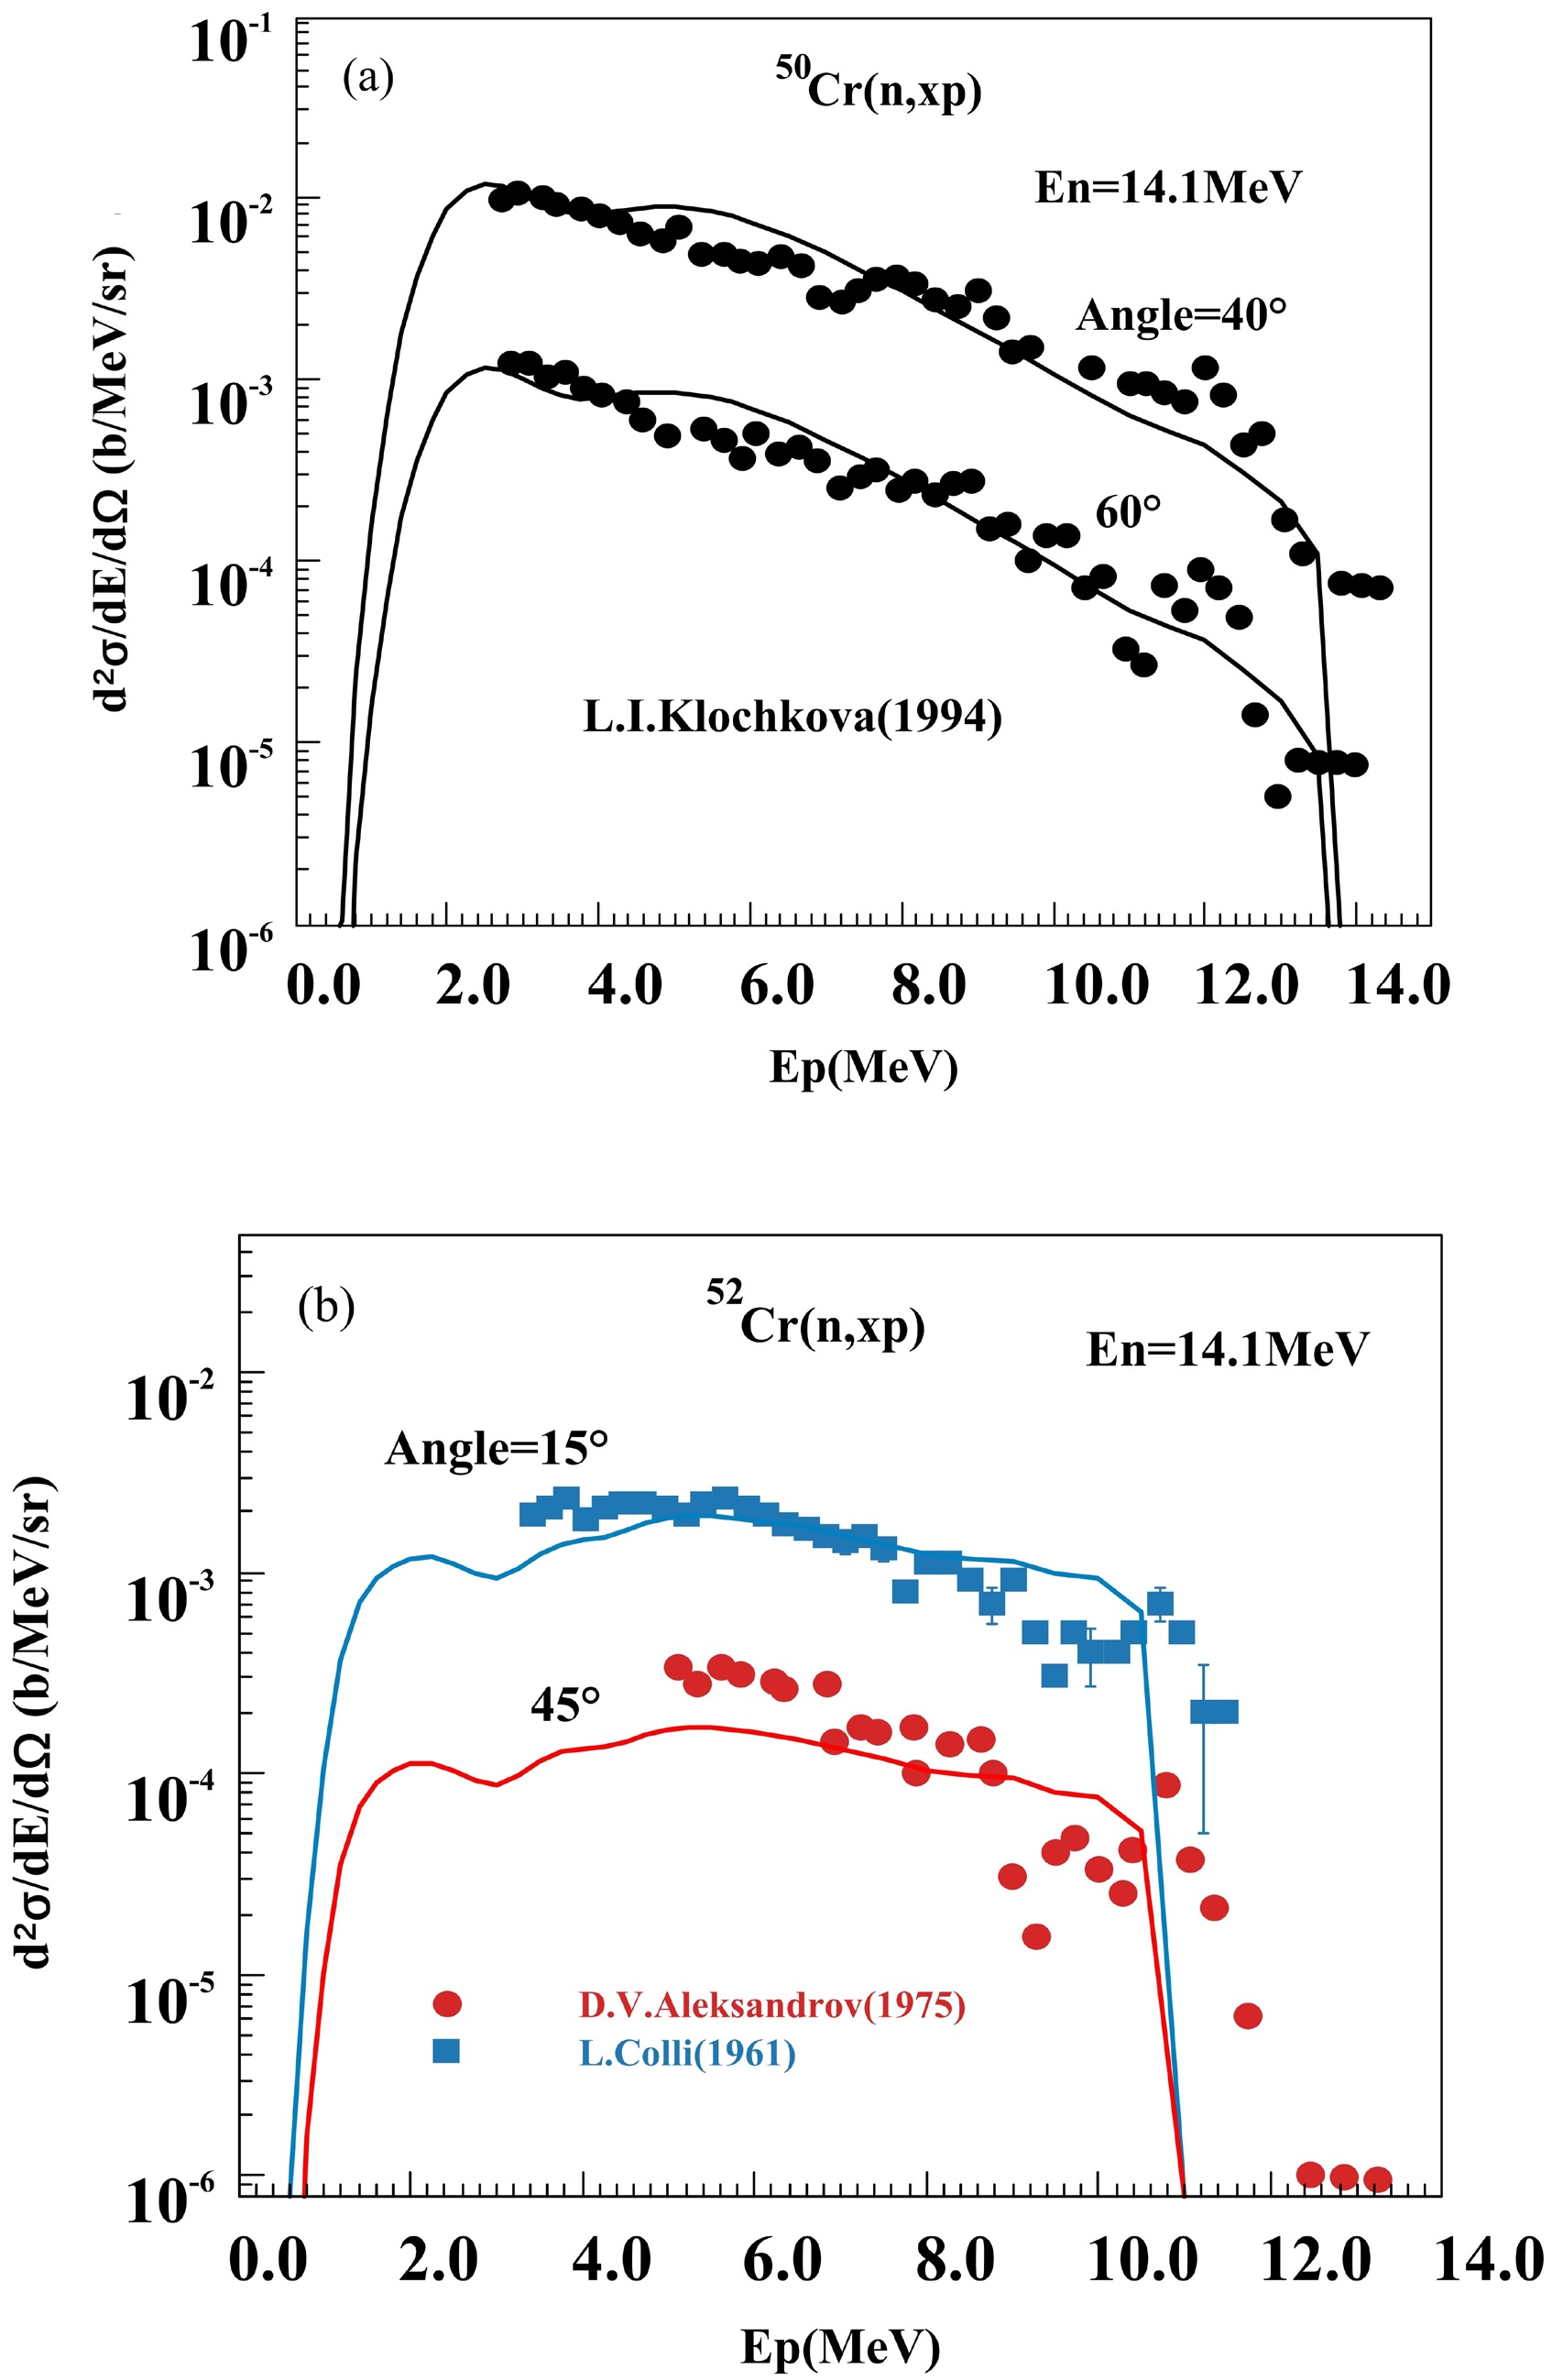
Figure 33. (color online) Comparisons of
$^{50,52} {\rm{Cr}}(n,xp)$ double-differential cross sections at different angles for an incident energy of 14.1 MeV between the evaluated data (solid curves) and experimental data (symbols). In each panel, the top curve remains the true reported values in the literature, and the other results are multiplied by a factor of 0.1.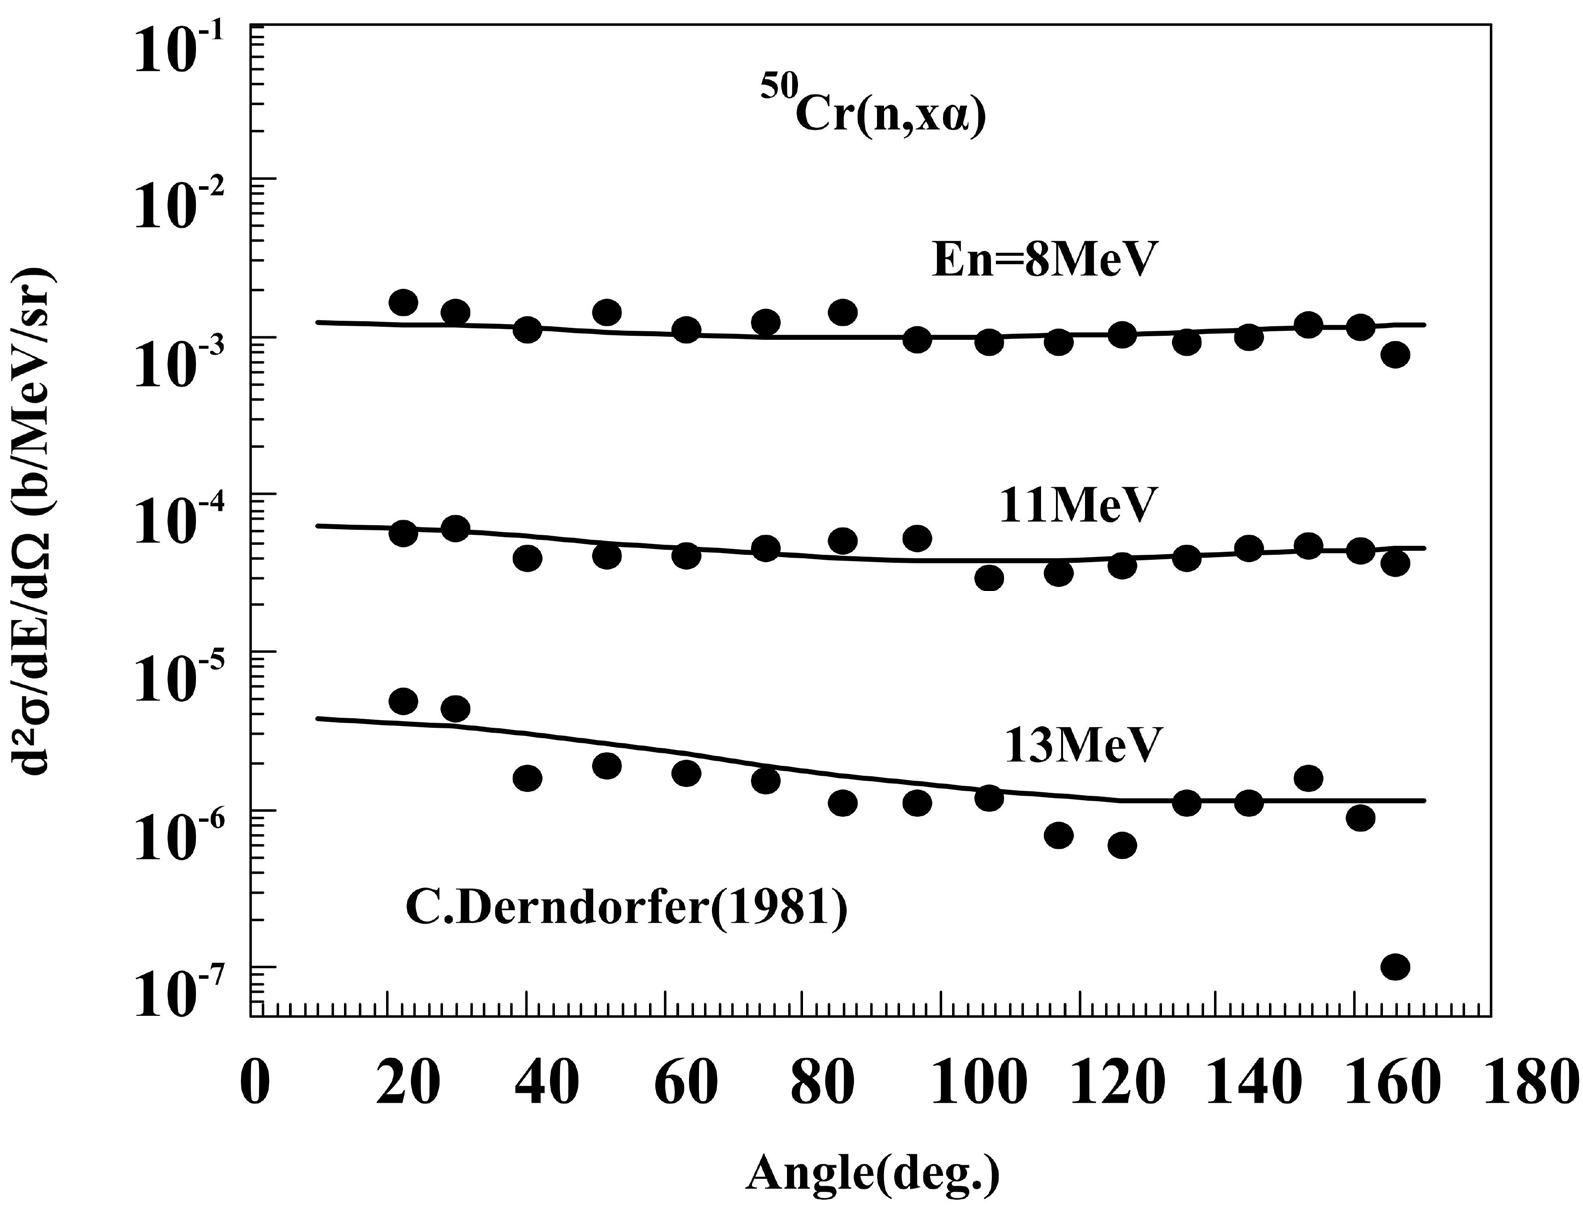
Figure 34. Comparisons of double differential cross sections for alpha particle emission at incident energy of 8.0, 11.0 and 13.0 MeV between the evaluated data (solid curves) and experimental data reported by C.Derndorfer (1981) (symbols). In each panel, the topmost curve for 8.0 MeV remains the true reported values in the literature, and the other results from 11.0 MeV to 13.0 MeV are multiplied by factors of 0.1, 0.01 respectively.
-
No energy spectra experimental data are available for
$^{53,54}{\rm{Cr}}$ , while charged particle spectra experimental data exist for$^{50,52}{\rm{Cr}}$ . Additionally, neutron emission energy spectra data have been measured for$^{52}{\rm{Cr}}$ and natural chromium. From Fig. 35, the results basically give a satisfactory description of the experimental data for$^{50}{\rm{Cr}}$ in the whole emission charged particle energy range. S. M. Grimes et al. (1979) (EXFOR Entry: 10827) have measured the energy spectra experimental data of proton, deuteron, and alpha particle emissions for$^{50}{\rm{Cr}}$ and$^{52}{\rm{Cr}}$ . One can find that generally, the present results are reasonably consistent with those data.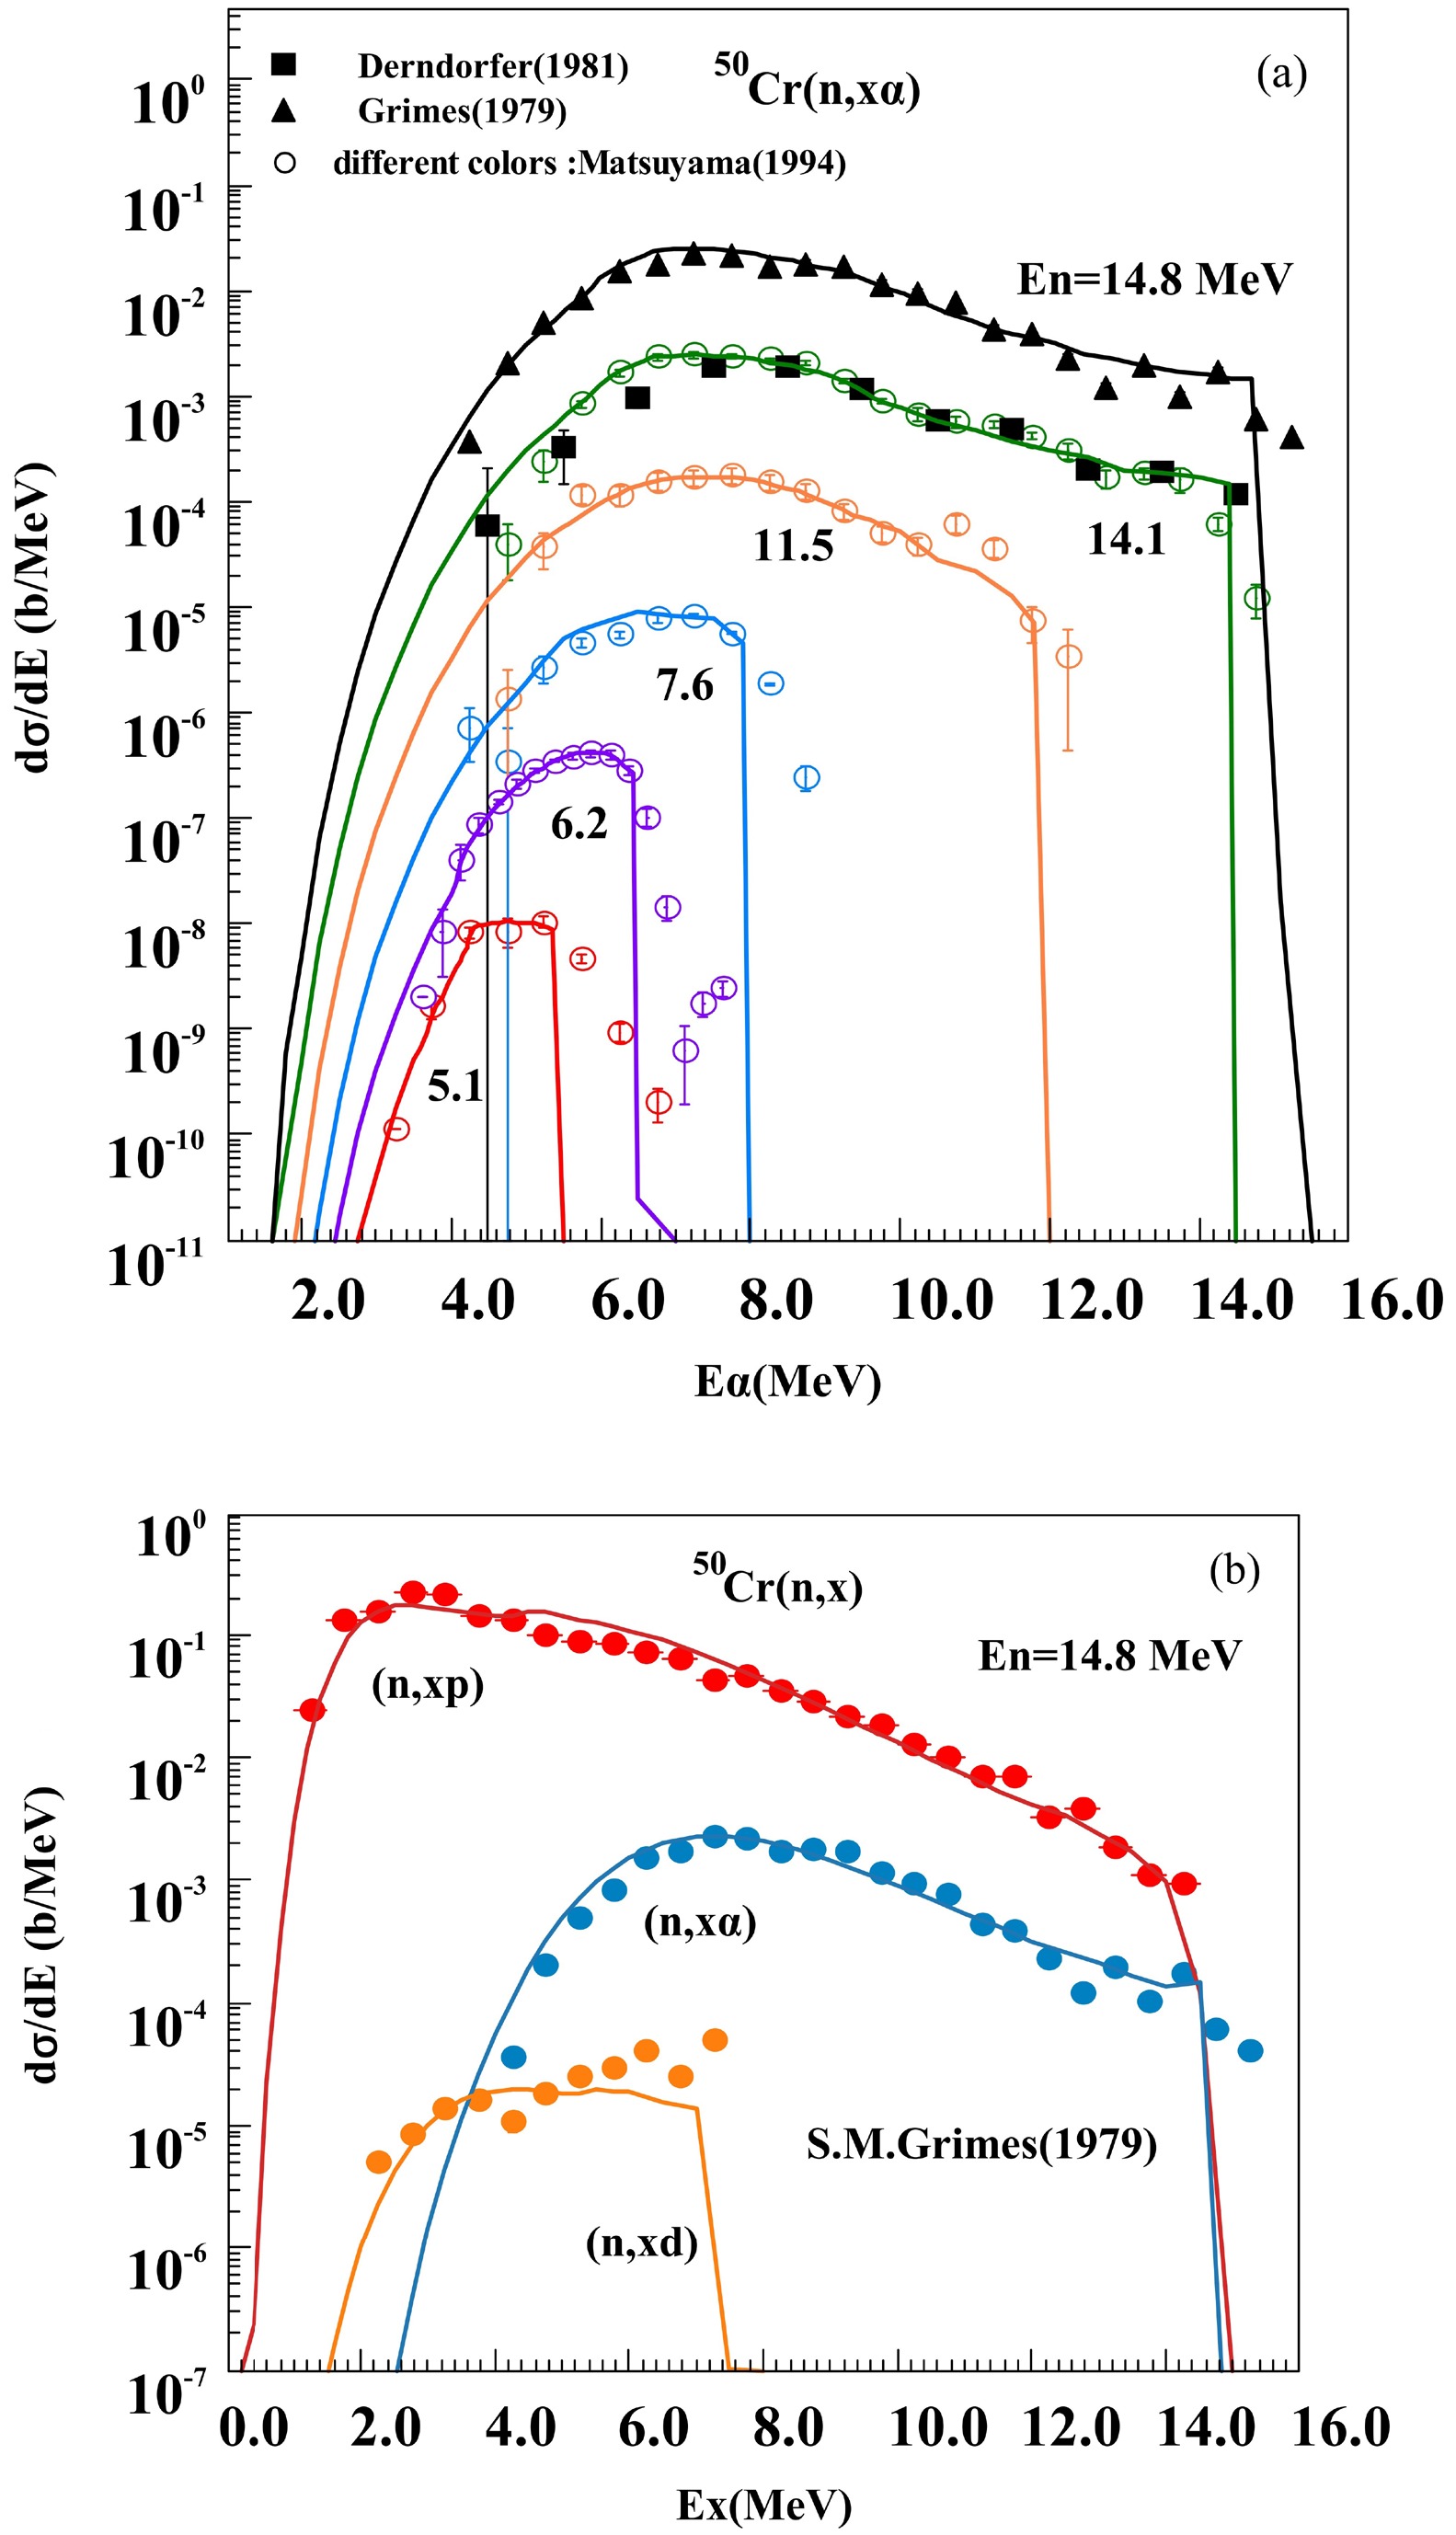
Figure 35. (color online) Comparisons of the charged-particle emission energy spectra for
$^{50} {\rm{Cr}}$ between the evaluated data (solid curves) and the experimental data reported by D.Schmidt (1997) (symbols). In each panel, the topmost curve for 14.1 MeV remains the true reported values in the literature, and the other results from 12.7 MeV to 7.95 MeV are multiplied by factors of 0.1, 0.01, and so on, respectively. -
The neutron emission energy spectra experimental data measured by D. Schmidt et al. (1997) (EXFOR Entry: 22411) of natural chromium is compared with theoretical results for
$^{50,54}{\rm{Cr}}$ as shown in Fig. 36. The results basically give a satisfactory description of the experimental data in the whole emission neutron energy range.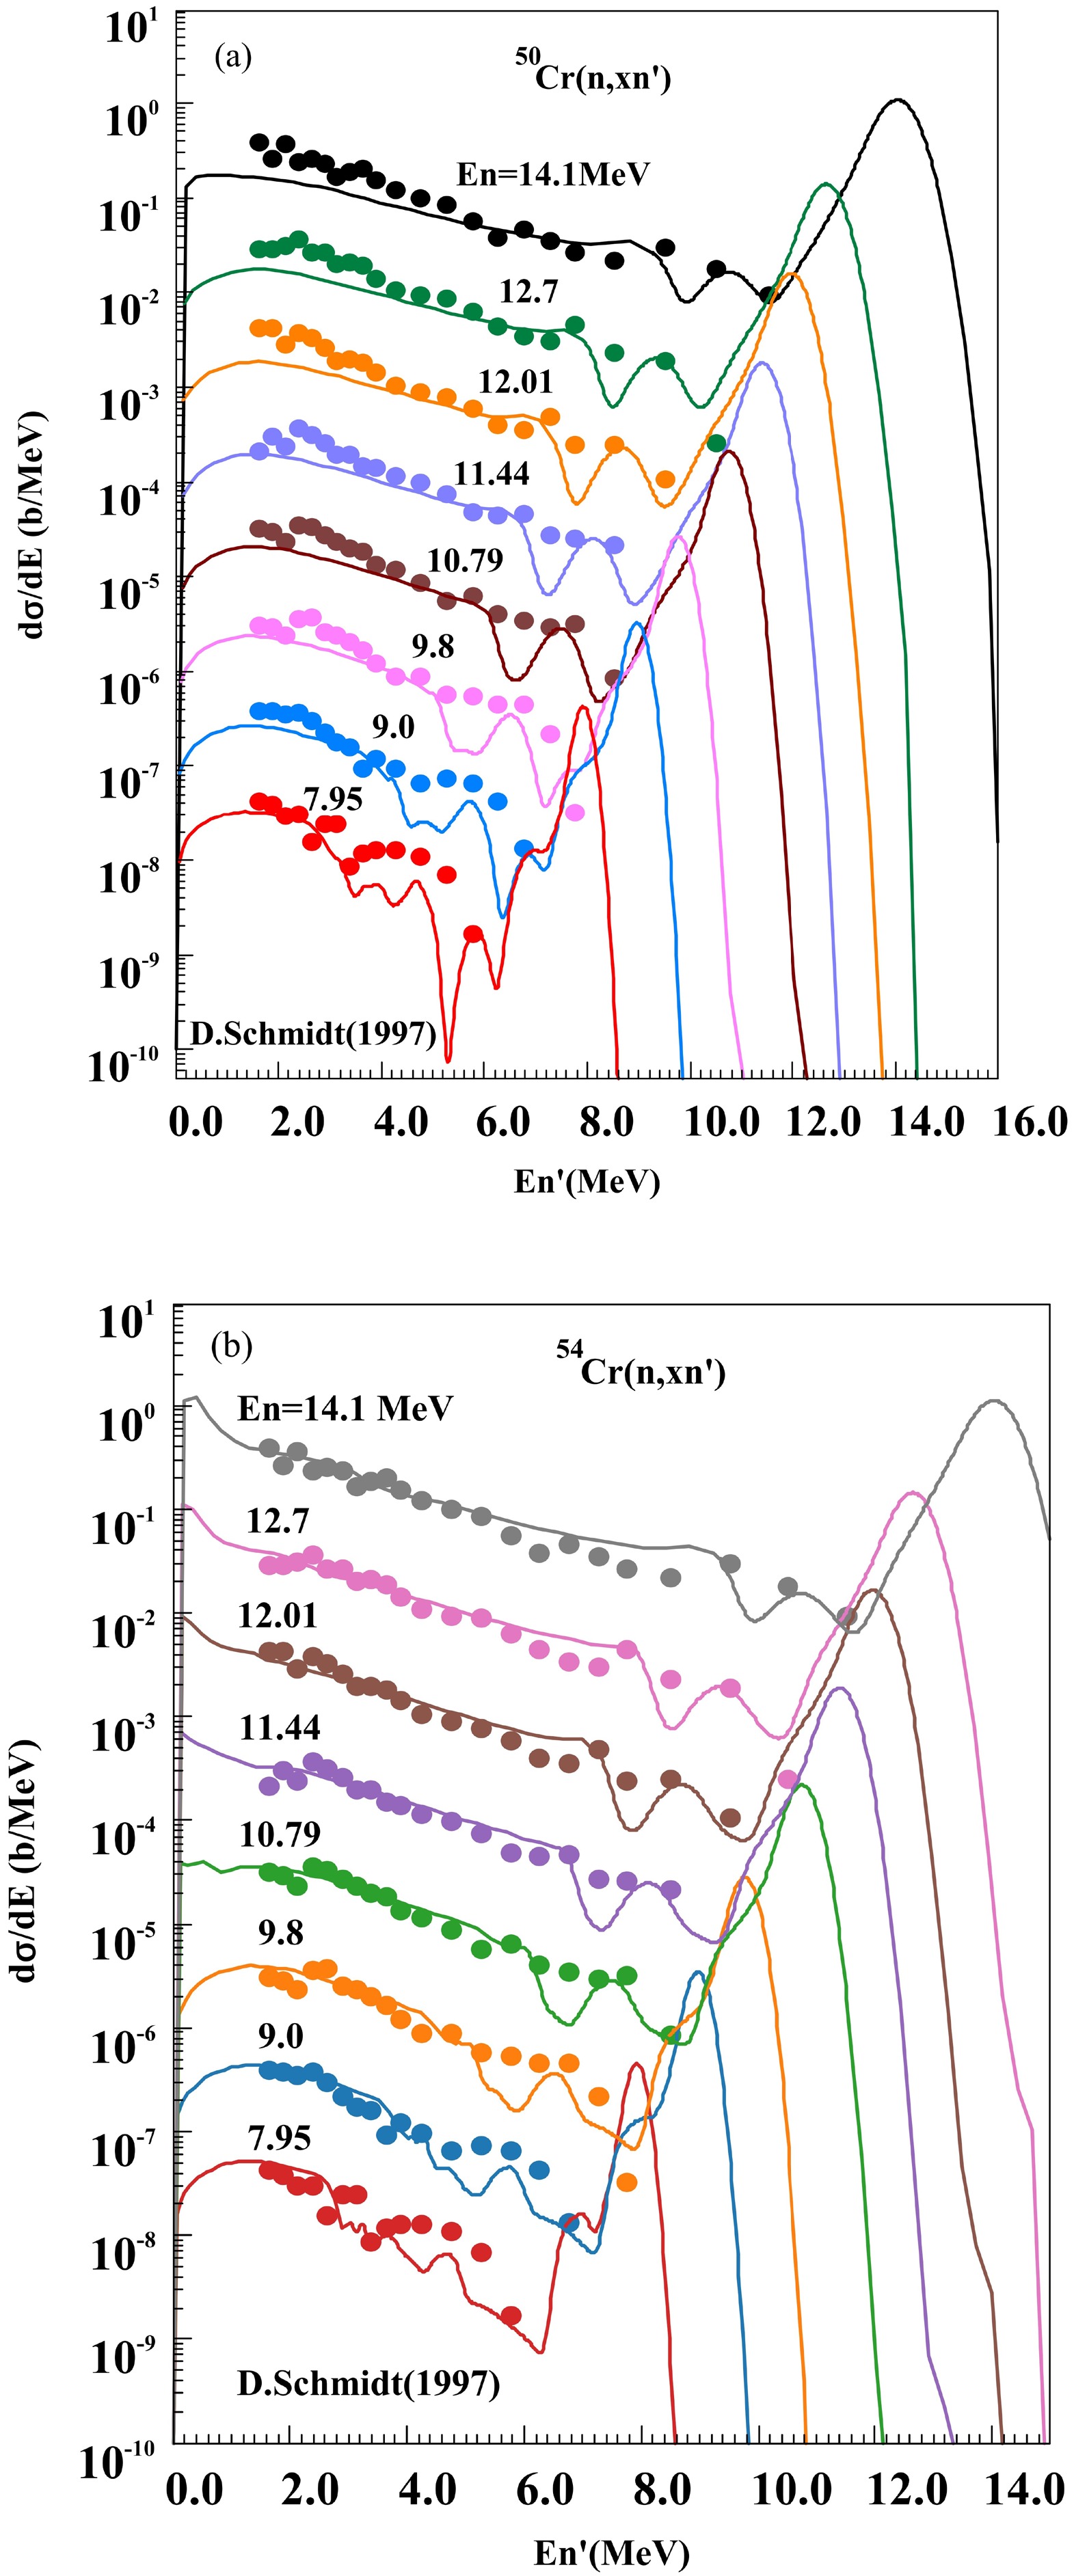
Figure 36. (color online) Comparison of the neutron emission energy spectra for
$^{50,54} {\rm{Cr}}$ between the evaluated data (solid curves) and the experimental data reported by D.Schmidt (1997) (symbols). In each panel, the topmost curve for 14.1 MeV remains the true reported values in the literature, and the other results from 12.7 MeV to 7.95 MeV are multiplied by factors of 0.1, 0.01, and so on, respectively. -
Based on criticality benchmarks selected from the ICSBEP2006[27], 62 cases with sensitivity of
$k_{{\rm{eff}}}$ to$^{52}{\rm{Cr}}$ data exceeding 1% are identified. In these cases,$^{52}{\rm{Cr}}$ primarily functions as a structural material. The selected experiments and their benchmark parameters are summarized in Appendix D.The calculations are performed using the particle transport code MCNP, executed in parallel on the high-performance computing cluster of the China Nuclear Data Center (CNDC). All ACE-formatted files processed through NJOY2016[28]. Calculations based on the newly evaluated
$^{52}{\rm{Cr}}$ nuclear data are benchmarked against experimental reference values and compared with results obtained using CENDL-3.2, ENDF/B-VIII.1, JENDL-5.0, and JEFF-4.0. The computed-to-experimental ($C/E$ ) ratios for$k_{{\rm{eff}}}$ are presented in the Fig. 37 below.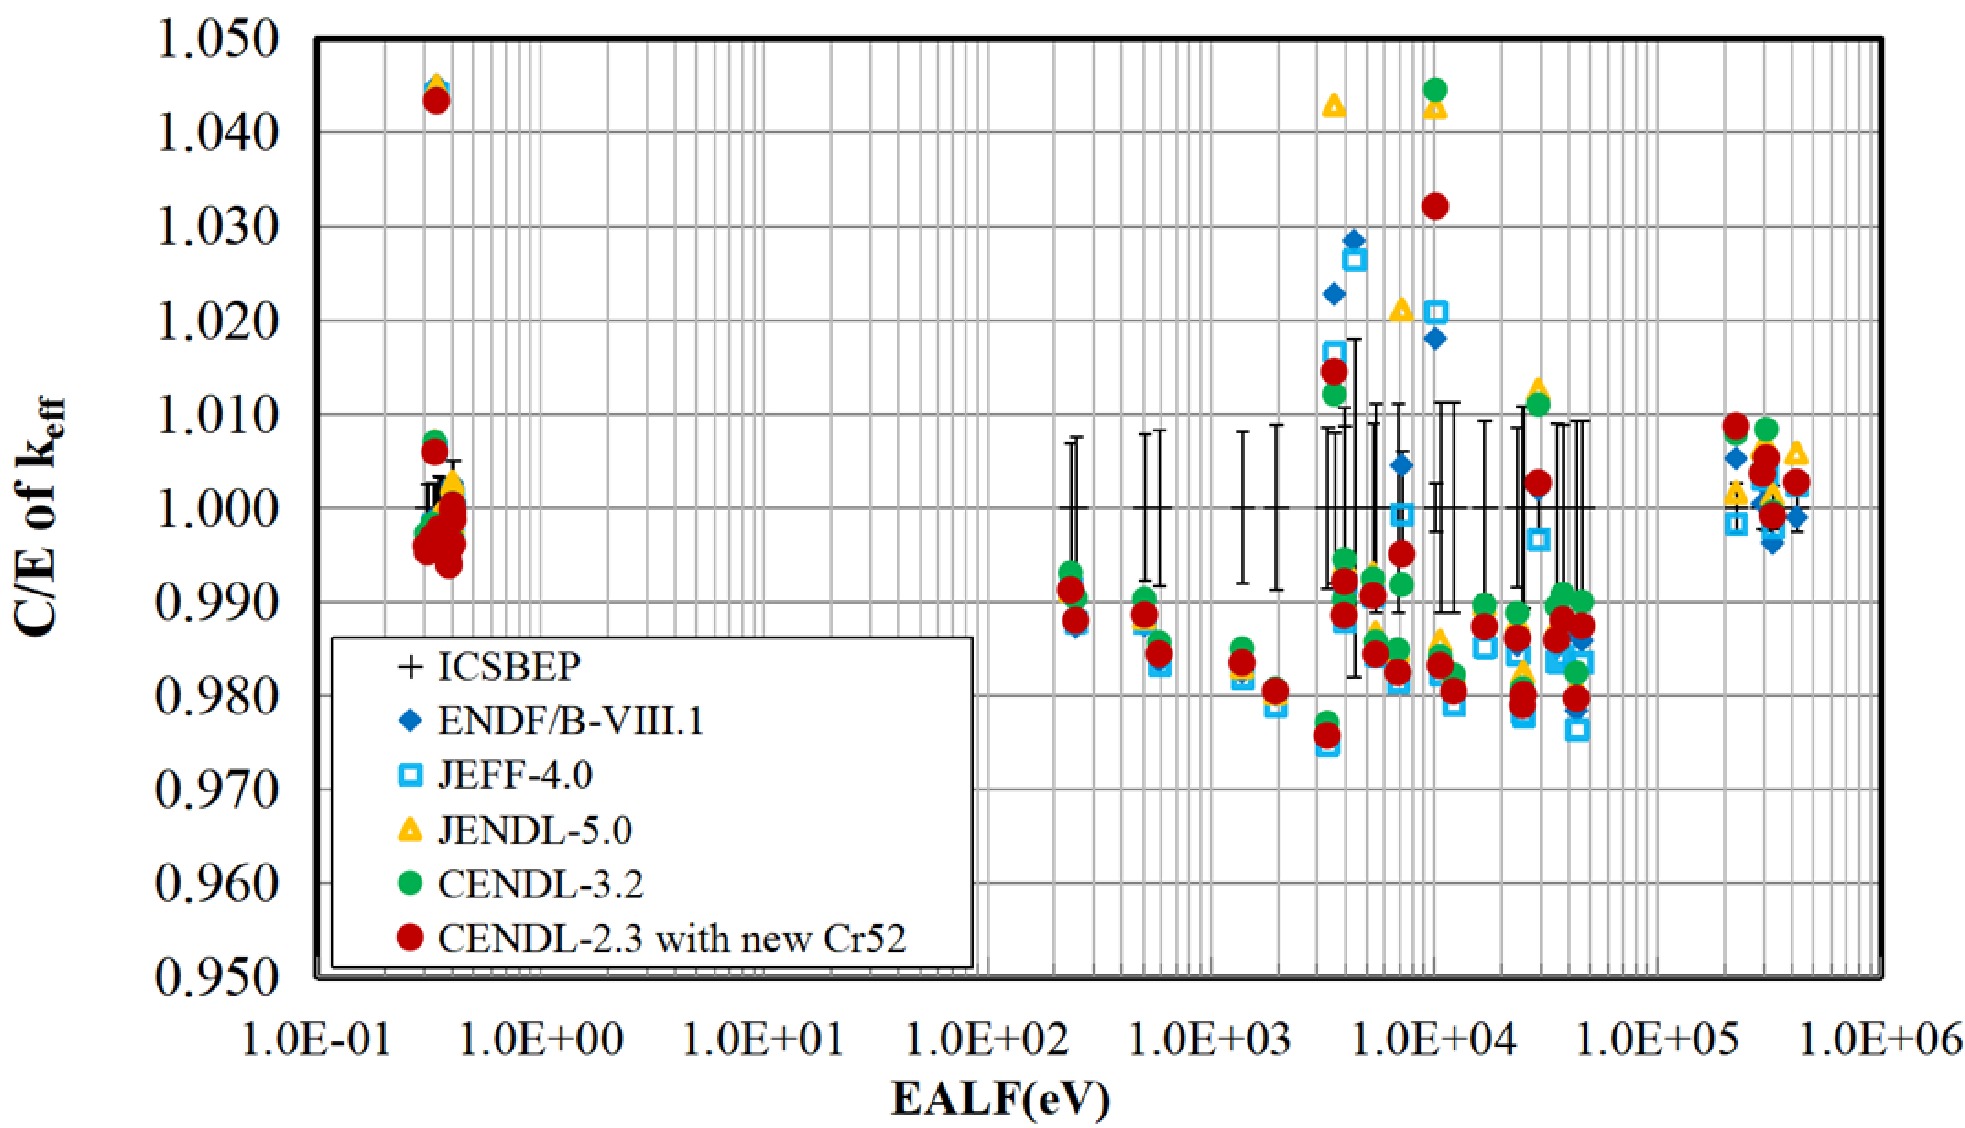
Figure 37. (color online) The computed-to-experimental (C/E) ratios for Criticality Benchmark Validation of
$^{52} {\rm{Cr}}$ Compared to CENDL-3.2,
$k_{{\rm{eff}}}$ calculations for the intermediate-spectrum shielding facility using the newly evaluated$^{52}{\rm{Cr}}$ nuclear data exhibit an overall reduction of$\sim$ 100 pcm. For the PMI002_01 experiment specifically, the calculated$k_{{\rm{eff}}}$ shows a$\sim$ 1000 pcm decrease relative to CENDL-3.2, demonstrating closer agreement with the benchmark value. -
The OKTAVIAN benchmark facility[29] is selected for shielding benchmark validation. Constructed at Osaka University, this facility comprises a high-current deuteron beam accelerator capable of generating pulsed D-T neutrons (103 neutrons/1.5 ns) or continuous D-T neutrons (
$3 \times 10^{12}$ neutrons/s). Extensive fusion neutronics experiments have been conducted to investigate fundamental D-T fusion neutron transport characteristics. During 1984–1989, the Murata Laboratory at Osaka University employed the OKTAVIAN facility to measure neutron and gamma leakage spectra from spherical shell samples using the time-of-flight (TOF) technique, including a chromium sample sphere with a diameter of 40 cm.Chromium in structural materials is modeled at natural isotopic abundance. Evaluated nuclear data libraries employed include CENDL-3.2, ENDF/B-VIII.1, JENDL-5.0, and JEFF-4.0. The results of the OKTAVIAN benchmark experiment are shown in the Fig. 38 and 39. For the OKTAVIAN benchmark experiment, the calculated neutron leakage spectrum based on the newly evaluated
$^{52}{\rm{Cr}}$ nuclear data is on par with CENDL-3.2 and demonstrates satisfactory agreement with experimental measurements. The photon spectrum calculations for$^{52}{\rm{Cr}}$ remain comparable to CENDL-3.2, though discrepancies are observed in the 1–2 MeV energy region, which require further investigation.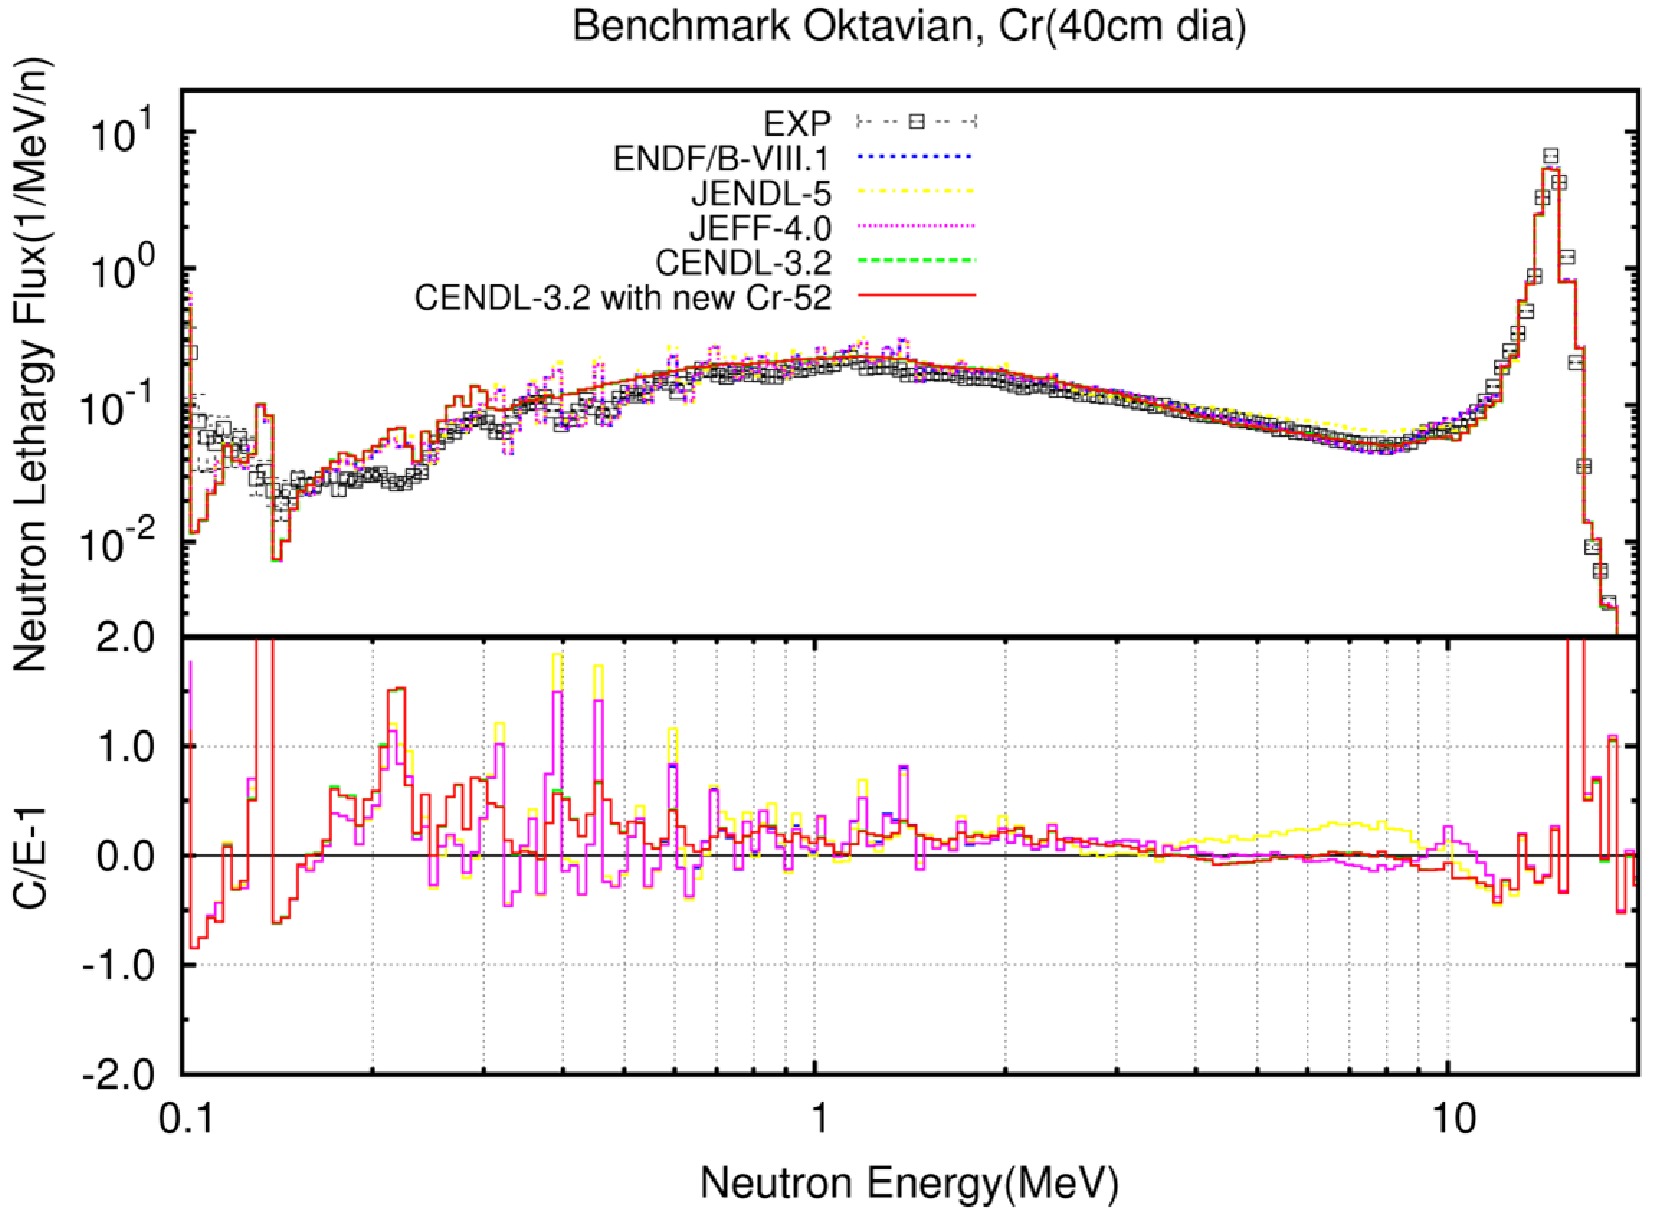
Figure 38. (color online) Oktavian benchmark experiment validation results of
$^{52} {\rm{Cr}}$ (leaked neutron spectrum)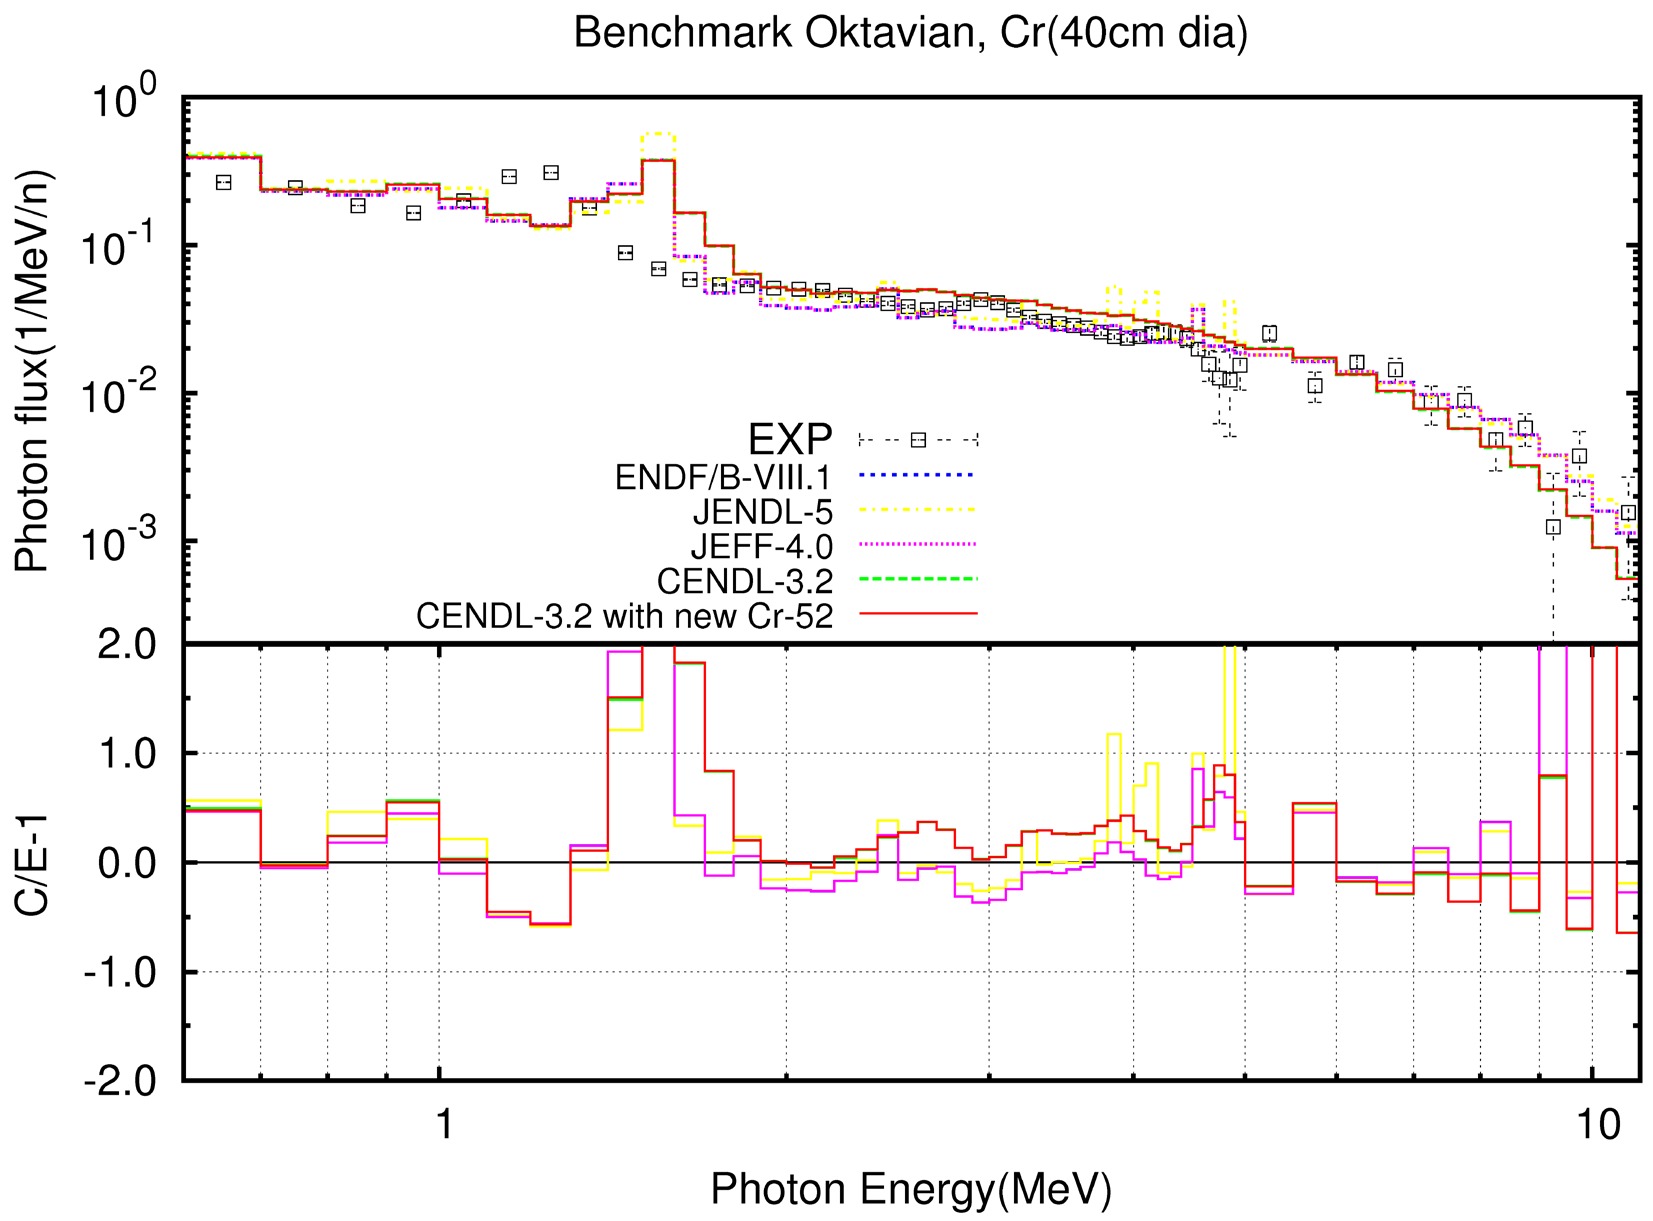
Figure 39. (color online) Oktavian benchmark experiment validation results of
$^{52} {\rm{Cr}}$ (leakage photon spectrum) -
In this work, we present a new evaluation and validation of neutron reaction data for
$^{50,52,53,54}{\rm{Cr}}$ isotopes at incident energies below 200 MeV, aiming to resolve discrepancies in reaction channels of existing libraries.This study conducts a comprehensive assessment based on 571 sets of experimental data related to cross sections, angular distributions, energy spectra, and double differential cross sections. The experimental data evaluations are specially performed to improve the quality of the cross sections like
$(n,p)$ ,$(n,2n)$ et al, and the discrepancies are analyzed. At the same time, combining with the theoretical calculations via Chinese UNF and MEND, a complete set of neutron data for neutron energy below 200 MeV for chromium isotopes ($^{50,52,53,54}{\rm{Cr}}$ ) are systematically obtained in this work. All the new results are compared with INDEN-Aug2023, ENDF/B-VIII.1, and JENDL-5. Better agreement with experimental data is observed in total, and the self-consistency of the evaluated results is also validated by reproducing the experimental element yields routed from various channels eg. the experimental$^{49}{\rm{V}}$ production via$^{50}{\rm{Cr}}(n,d)$ and$^{50}{\rm{Cr}}(n,np)$ .All the data validated by involving 62 benchmark facilities from ICSBEP 2014, and the significant improvement is observed, especially for the PMI002_01 with Chromium isotopes as the major component, the calculated
$k_{{\rm{eff}}}$ decreased by approximately 1000 pcm compared to CENDL-3.2, achieving better agreement with the benchmark value. Furthermore, the predicted neutron leakage spectrum in the OKTAVIAN shielding benchmark aligns well with experimental measurements.Overall, the current evaluated data for
$^{50}{\rm{Cr}}$ ,$^{52}{\rm{Cr}}$ ,$^{53}{\rm{Cr}}$ , and$^{54}{\rm{Cr}}$ exhibit high quality to support the future nuclear applications. In the energy region above 20 MeV, hundreds of nuclear reaction channels become accessible, resulting in strong competition among various pathways. This makes direct measurement of individual reaction cross sections extremely difficult. Therefore, for energies above 20 MeV, experimental measurements of energy spectra or double-differential cross sections of emitted particles—such as neutrons, protons, deuterons, tritons, helium-3, and alpha particles—are essential. These data will provide critical constraints for validating and refining theoretical models. -
The authors would like to thank Prof. Roberto Capote (IAEA) for the valuable information on Cr isotopes from the INDEN project and the insightful discussions.
-
Abbreviation Full Name Abbreviation Full Name ACTIV Activation JENDL Japanese Evaluated Nuclear Data Library ADS Accelerator-Driven Systems JEFF Joint Evaluated Fission and Fusion File ATF Accident-Tolerant Fuel LONGC Long counter ASSOP Associated particle MOMIX Mixed monitor BF3 Boron Trifluoride detector MAGSP Magnetic spectrometer BNL Brookhaven National Laboratory ORNL Oak Ridge National Laboratory BROND Russian Nuclear Data Library PHOTO Photo-neutron COINC Coincidence PROPC Proportional counter CHSEP Chemical separation of products PHD Pulse-height discrimination CENDL Chinese Evaluated Nuclear Data Library PSD Pulse-shape discrimination CSICR Cesium-Iodide crystal SIBAR Silicon surface barrier detector EC-JRC European Commission Joint Research Centre SOLST Solid-state detector EVAP Evaporation neutrons SILI Silicon detector EDE Particle identification by 'E/Delta E' measurement SCIN Scintillation detector ENDF/B Evaluated Nuclear Data File/B STANK Standard tank (or neutron standard setup) FISCH Fission chamber STTA Stacked target irradiation GELI Germanium Lithium-drifted detector SLODT Slowing-down time GE-IN Germanium intrinsic detector TOF Time-of-flight GSPEC Gamma ray spectrometry TENDL TALYS-Based Evaluated Nuclear Data Library HPGE High-Purity Germanium detector TRN Transmission IOCH Ionization chamber TELES Counter telescope Table A1. List of abbreviations and acronyms.
-
Param. Reaction Type $ n,\gamma $ $ n, n' $ $ n, p $ $ n,\alpha $ $ n,^{3}{\rm{He}} $ $ n, d $ $ n, t $ $ n,2n $ $ n,n\alpha $ $ n,2p $ $ n,3n $ a 6.232 5.736 5.934 7.321 6.140 6.527 3.813 6.152 6.046 6.635 5.676 Δ −2.5 0.041 −3.0 −0.23 0.2 −1.8 −0.06 −0.10 0.130 1.330 2.60 Table B1. Level density and pair correction parameters of
$ ^{50}{\rm{Cr}} $ Param. Reaction Type $ n,\gamma $ $ n, n' $ $ n, p $ $ n,\alpha $ $ n,^{3}{\rm{He}} $ $ n, d $ $ n, t $ $ n,2n $ $ n,n\alpha $ $ n,2p $ $ n,3n $ a 6.080 5.416 5.7 6.235 5.868 6.255 7.034 6.232 6.140 6.524 5.736 Δ −3.20 0.100 −1.90 0.05 0.130 −0.8 −0.460 −2.80 2.890 1.530 2.560 Table B2. Level density and pair correction parameters of
$ ^{52}{\rm{Cr}} $ Param. Reaction Type $ n,\gamma $ $ n, n' $ $ n, p $ $ n,\alpha $ $ n,^{3}{\rm{He}} $ $ n, d $ $ n, t $ $ n,2n $ $ n,n\alpha $ $ n,2p $ $ n,3n $ a 6.376 6.080 6.663 3.668 6.524 6.926 4.255 5.416 6.635 6.537 6.232 Δ −2.5 0.075 0.070 0.000 0.073 −0.260 0.320 0.400 0.001 0.680 0.006 Table B3. Level density and pair correction parameters of
$ ^{53}{\rm{Cr}} $ Param. Reaction Type $ n,\gamma $ $ n, n' $ $ n, p $ $ n,\alpha $ $ n,^{3}{\rm{He}} $ $ n, d $ $ n, t $ $ n,2n $ $ n,n\alpha $ $ n,2p $ $ n,3n $ a 7.357 6.076 5.800 6.004 6.537 7.243 6.526 6.080 5.868 7.596 5.416 Δ −2.50 0.100 −3.00 0.023 0.120 −0.650 −0.260 −0.590 2.730 1.330 2.400 Table B4. Level density and pair correction parameters of
$ ^{54}{\rm{Cr}} $ -
Reaction Year First Author Institute Source Method Detector En (MeV) Points $ (n,tot) $ 1972 A.I. Dyumin Fiz.-Tekhnicheskiy Inst. Ioffe, Russia − COINC SCIN 14.2 1 $ (n,el) $ 1977 I.A. Korzh Inst. Yadernyh Doslidzhen, N.A. N.Ukraini, Kyiv, Ukraine TOF SCIN 1.5-3 4 $ (n,inl) $ 1962 D.M. Van Patter Bartol Research Foundation, Swarthmore, PA, USA P-7 Li Ring Geometry NAICR 0.98-3.31 10 $ (n,n^{\prime}) $ 1978 P.T. Karatzas University of Massachusetts at Lowell, MA, United States of America P-T TOF GELI, LONGC 0.84-3.97 73 1975 I.A. Korzh Inst. Yadernyh Doslidzhen, N.A. N.Ukraini, Kyiv, Ukraine P-T TOF SCIN 1.5-3.0 5 1973 M.B. Fedorov Inst. Yadernyh Doslidzhen, N.A. N.Ukraini, Kyiv, Ukraine D-D TOF SOLST 2.9 1 ( $ n,n^{\prime}\gamma $ )1975 G. Tessler Bettis Atomic Power Lab., Westinghouse, Pittsburgh, PA, USA − TOF GELI, TELES 3.43-5.97 10 (n,γ) 1975 F. Voss Karlsruhe Institute of Technology (KIT), Germany EVAP TOF GELI, SCIN 0.799-14.0 1778 2002 Yijun Xia Sichuan Univ., Chengdu, China, People's Rep. P-T; P-7 Li − HPGE 0.05-1.05 6 $ (n,p) $ 1994 L.I. Klochkova Leningradskiy Tekhnologicheskiy Inst. Im. Lensoveta, Russia D-T EDE TELES, PROPC, SCIN 14.1 1 $ (n,d) $ 1979 S.M. Grimes Lawrence Livermore National Laboratory, Livermore, CA, USA D-T − MAGSP, SIBAR 14.8 1 $ (n,t) $ 2007 V. Semkova EC Joint Research Centre, Geel D-T ACTIV, GSPEC HPGE, LONGC 17.3-20.6 5 $ (n,\alpha) $ 2018 T. Khromyleva Fiziko-Energeticheskii Inst., Obninsk, Russia D-D PHD IOCH, FISCH 4.7-7.2 14 $ (n,^{4}He) $ 1994 I. Matsuyama Tohoku Univ., Sendai, Japan D-T, D-D, D-14 N, D-15 N − IOCH, TELES, SCIN 5.1-14.1 5 $ (n,2n) $ 2020 I. Pasha Bangalore University, Bengaluru, India D-T ACTIV, STTA HPGE 14.5 1 2005 Zhou Feng-Qun Lanzhou Univ., Lanzhou, China, People's Rep. D-T ACTIV HPGE 13.5-14.6 4 1987 S.K. Ghorai Auburn University, Auburn, AL, USA D-T ACTIV, MOMIX, ASSOP GELI 14.2-18.2 5 1965 M.Bormann Hamburg, Universitaet, Germany D-T ACTIV − 13.6-19.6 9 $ (n,3n) $ 1992 Y.Uwamino Univ. of Tokyo, Tokyo, Japan P-9 Be ACTIV GE-IN 26.5-38.5 13 $ (n,x)^{49} $ V1999 A.Fessler Forschungszentrum Juelich, Germany D-D, D-T ACTIV, GSPEC, STTA, CHSEP HPGE,SILI 14.3-19.4 4 1982 S.M.Qaim Forschungszentrum Juelich, Germany D-T ACTIV GELI 14.7 1 Table C1. Recommended cross section experimental data of
$^{50}{\rm{Cr}} $ Reaction Year First Author Institute Source Method Detector En (MeV) Points $ (n,tot) $ 2000 R.F.Carlton Middle Tennessee State University, Murfreesboro, TN, USA − TOF,TRN SCIN 0.00502-31.2 13620 1972 A.I.Dyumin Fiz.-Tekhnicheskiy Inst.Ioffe, St.Petersburg+Gatchina, Russia D-T COINC SCIN 14.2 1 1971 D.G.Foster Jr Pacific Northwest Laboratories, Richland, WA,USA D-LI TOF SCIN 2.34-14.9 240 1967 C.Thibault CEA/Saclay, France D-D − − 2.7 1 $ (n,el) $ 1974 W.E.Kinney Inst. Yadernyh Doslidzhen, N.A.N.Ukraini, Kyiv, Ukraine D-D TOF SCIN 6.44-8.56 3 1977 I.A.Korzh Oak Ridge National Laboratory, Oak Ridge, TN, USA P-T TOF SCIN 1.5-3.0 4 $ (n,inl) $ 2025 Tan Boyu China Nuclear Data Center, China Institute of Atomic Energy D-D Prompt γ-ray measurement method HPGE 5.62-7.95 3 2007 L.C.Mihailescu EC Joint Research Centre (EC-JRC), Geel PHOTO TOF HPGE, FISCH 1.46-18.5 974 1988 A.A.Lychagin Fiziko-Energeticheskii Inst., Obninsk, Russia D-T TOF, COINC SCIN 14.1 1 1962 D.M.Van Patter Bartol Research Foundation, Swarthmore, PA, USA P-7 Li Ring Geometry NAICR 0.98-3.31 10 $ (n,n') $ 2007 L.C.Mihailescu EC Joint Research Centre (EC-JRC), Geel PHOTO TOF HPGE, FISCH 1.46-4.55 1088 1998 D.Schmidt Physikalisch-Technische Bundesanstalt, Braunschweig, Germany D-D TOF, PSD SCIN 7.95-14.8 10 1990 N.Olsson Studsvik Science Research Laboratory, Nykoeping, Sweden D-T TOF SCIN 21.6 1 $ (n,n'\gamma) $ 2025 Tan Boyu China Nuclear Data Center, China Institute of Atomic Energy D-D Prompt γ−ray measurement method HPGE 5.62-7.95 15 2007 L.C.Mihailescu EC Joint Research Centre (EC-JRC), Geel PHOTO TOF HPGE, FISCH 1.46-18.5 4029 $ (n,\gamma) $ 1974 N.Frenes Inst. fuer Isotopenforschung und Kernphysik, Vienna, Austria D-T PHD GELI 14.1 1 $ (n,p) $ 2007 W.Mannhart Physikalisch-Technische Bundesanstalt, Braunschweig, Germany D-D TOF, ACTIV, STTA SCIN, HPGE, FISCH 7.86-14.5 15 1998 A.Fessler EC Joint Research Centre (EC-JRC), Geel D-T, D-D ACTIV, TOF, GSPEC HPGE, BF3, SCIN 9.31-21.1 22 1991 A.Ercan Cekmece Nucl. Res. Centre, Istanbul, Turkey D-T − HPGE, BF3 14.6 1 $ (n,d) $ 1979 S.M.Grimes Lawrence Livermore National Laboratory, Livermore, CA, USA D-T − MAGSP, SIBAR 14.8 1 $ (n,\alpha) $ 2018 T.Khromyleva Fiziko-Energeticheskii Inst., Obninsk, Russia D-D PHD IOCH, FISCH 4.7-7.2 14 $ (n,2n) $ 2020 I.Pasha Bangalore University, Bengaluru, India D-T ACTIV HPGE 14.5 1 2007 W.Mannhart Physikalisch-Technische Bundesanstalt, Braunschweig, Germany D-D TOF, ACTIV, STTA SCIN, HPGE, FISCH 12.4-14.5 8 2005 Zhou Feng-Qun Lanzhou Univ., Lanzhou, China, People's Rep D-T ACTIV HPGE 13.5-14.6 4 1998 A.Fessler EC Joint Research Centre (EC-JRC), Geel D-T, D-D ACTIV, TOF, GSPEC HPGE, BF3, SCIN 14.3-19.4 4 1996 Y.Uno Univ. of Tokyo, Tokyo, Japan P-7 Li ACTIV GE-IN 17.6-38.3 5 1989 H.Liskien EC Joint Research Centre (EC-JRC), Geel D-T ACTIV GE-IN, NAICR 12.7-19.5 24 Table C2. Recommended cross section experimental data of
$ ^{52}{\rm{Cr}} $ Reaction Year First Author Institute Source Method Detector En (MeV) Points $ (n,tot) $ 1972 A.I.Dyumin Fiz.-Tekhnicheskiy Inst. Ioffe, St. Petersburg+Gatchina, Russia D-T COINC SCIN 14.2 1 1971 D.G.Foster Jr Pacific Northwest Laboratories, Richland, WA, United States of America D-LI TOF SCIN 2.26–14.8 248 $ (n,inl) $ 1962 D.M.Van Patter Bartol Research Foundation, Swarthmore, PA, USA P-7 Li Ring Geometry NAICR 0.98–3.31 10 $ (n,n') $ 1989 Ya.M.Kramarovskiy Khlopin Radievij Inst., St. Petersburg, Russia P-T − GELI, FISCH 0.63–1.98 40 1978 P.T.Karatzas University of Massachusetts at Lowell, MA, United States of America P-T TOF GELI, LONGC 0.98–3.31 36 1962 D.M.Van Patter Bartol Research Foundation, Swarthmore, PA, United States of America P-7 Li Ring Geometry NAICR 1.10–2.04 25 $ (n,n'\gamma $ )1975 G.Tessler Bettis Atomic Power Lab., Westinghouse, Pittsburgh, PA, USA − TOF GELI, TELES 3.43–5.97 20 $ (n,\gamma) $ 1964 Fiz.Inst. Lebedev (FIAN), Moskva, Russia Fiz.Inst. Lebedev (FIAN), Moskva, Russia − SLODT SCIN, PROPC $ 2.9\times10^{-5} $ −$ 5.7\times10^{-2} $ 35 $ (n,p) $ 2012 B.Lalremruata Mizoram University, Aizawl, India D-T ACTIV HPGE 14.8 1 1998 A.Fessler EC Joint Research Centre, Geel D-T, D-D ACTIV, TOF, GSPEC HPGE, BF3, SCIN 11.6–21.1 19 1998 Y.Kasugai Nagoya Univ., Nagoya, Japan D-T ACTIV HPGE 13.4–14.9 6 1981 D.L.Smith Argonne National Laboratory, Argonne, IL, United States of America D-D ACTIV GELI 4.82–9.34 23 $ (n,\alpha) $ 2018 T.Khromyleva Fiziko-Energeticheskii Inst., Obninsk, Russia D-D PHD IOCH, FISCH 4.7–7.2 14 $ (n,x)^{52}V $ 2002 H.Sakane Nagoya Univ., Nagoya, Japan D-T ACTIV, STTA HPGE 13.4–14.9 6 1998 A.Fessler EC Joint Research Centre (EC-JRC), Geel D-T, D-D ACTIV, TOF, GSPEC HPGE, BF3, SCIN 16.0–20.2 5 Table C3. Recommended cross section experimental data of
$ ^{53}{\rm{Cr}} $ Reaction Year First Author Institute Source Method Detector En (MeV) Points $ (n,tot) $ 1972 A.I.Dyumin Fiz.-Tekhnicheskiy Inst. Ioffe, St. Petersburg+Gatchina, Russia D-T COINC SCIN 14.2 1 $ (n,el) $ 1977 I.A.Korzh Inst. Yadernyh Doslidzhen, N.A.N. Ukraini, Kyiv, Ukraine − TOF SCIN 1.5–3 4 $ (n,inl) $ 1962 D.M.Van Patter Bartol Research Foundation, Swarthmore, PA, USA P-7 Li Ring Geometry NAICR 0.98–3.31 10 $ (n,n') $ 1975 I.A.Korzh Inst. Yadernyh Doslidzhen, N.A.N. Ukraini, Kyiv, Ukraine P-T TOF SCIN 1.5–3.0 5 1973 M.B.Fedorov Inst. Yadernyh Doslidzhen, N.A.N. Ukraini, Kyiv, Ukraine D-D TOF SOLST 2.9 1 $ (n,n'\gamma) $ 1975 G.Tessler Bettis Atomic Power Lab., Westinghouse, Pittsburgh, PA, USA − TOF GELI, TELES 3.43–5.97 9 $ (n,p) $ 1998 Y.Kasugai Nagoya Univ., Nagoya, Japan D-T ACTIV HPGE 13.4–14.9 6 1998 Y.Kasugai Nagoya Univ., Nagoya, Japan D-T ACTIV HPGE 13.4–14.9 6 $ (n,\alpha) $ 1998 Y.Kasugai Nagoya Univ., Nagoya, Japan D-T ACTIV HPGE 13.4–14.9 6 $ (n,x)^{53}V $ 2002 H.Sakane Nagoya Univ., Nagoya, Japan D-T ACTIV, STTA HPGE 13.4–14.9 6 1998 A.Fessler EC Joint Research Centre (EC-JRC), Geel D-T, D-D ACTIV, TOF, GSPEC HPGE, BF3, SCIN 16.0–20.2 5 Table C4. Recommended cross section experimental data of
$ ^{54}{\rm{Cr}} $ Reaction Year First Author Institute Source Method Detector En (MeV) Points $ (n,tot) $ 2001 W.P.Abfalterer Los Alamos National Laboratory, NM, USA EVAP TOF SCIN 5.29–5.59 467 1980 D.C.Larson Oak Ridge National Laboratory, Oak Ridge, TN, USA PHOTO TOF SCIN 2.0–80.6 685 $ (n,el) $ 1998 D.Schmidt Physikalisch-Technische Bundesanstalt, Braunschweig, Germany D-D TOF, PSD SCIN 7.95–14.8 10 1987 N.Olsson Studsvik Science Research Laboratory, Nykoeping, Sweden D-T TOF SCIIN 2.16 1 1974 W.E.Kinney Oak Ridge National Laboratory, Oak Ridge, TN, United States of America D-D TOF SCIN 4.34–8.56 5 $ (n,\alpha) $ 1983 E.Wattecamps EC Joint Research Centre, Geel D-T EDE, BCINT PTOPC, SPLST 14.1 1 1981 A.Paulsen EC Joint Research Centre, Geel D-D EDE, BCINT TELES, PROPC, SOLST 4.89–9.97 11 $ (n,2n) $ 2016 J.Frehaut CEA/DAM Ile-de-France, Bruyeres-le-Chatel, Arpajon, France D-D – STANK 10.2–14.8 11 1977 G.F.Auchampaugh Los Alamos National Laboratory, NM, USA D-T – STANK, SCIN 14.7–21.0 7 $ (n,x)^{52}V $ 1994 Y.Uwamino Univ. of Tokyo, Tokyo, Japan P-9Be ACTIV GE-IN 5.5–38.5 34 Table C5. Recommended cross section experimental data of
$ ^{nat}{\rm{Cr}} $ Reaction Year First Author Institute Source Method Detector En (MeV) Points $ ^{50,54}{\rm{Cr}}(n,{\rm{el}}) $ ;
$ ^{50,54}{\rm{Cr}}(n,n') $ 1975 I.A.Korzh Inst. Yadernyh Doslidzhen, N.A.N. Ukraini, Kyiv, Ukraine P-T TOF SCIN 1.5–3.0 36 1973 M.B.Fedorov Inst. Yadernyh Doslidzhen, N.A.N. Ukraini, Kyiv, Ukraine D-D TOF SOLST 2.9 7 $ ^{52}{\rm{Cr}}(n,{\rm{el}}) $ ;
$ ^{52}{\rm{Cr}}(n,n') $ 1982 I.A.Korzh Inst. Yadernyh Doslidzhen, N.A.N. Ukraini, Kyiv, Ukraine D-D TOF SCIN 5.0–6.0 29 1974 W.E.Kinney Oak Ridge National Laboratory, Oak Ridge, TN, USA D-D TOF SCIN 6.44–8.56 54 $ ^{nat}{\rm{Cr}}(n,{\rm{el}}) $ 1998 D.Schmidt Physikalisch-Technische Bundesanstalt, Braunschweig, Germany D-D TOF, PSD SCIN 7.95–14.8 376 1997 A.B.Smith Argonne National Laboratory, Argonne, IL, United States of America D-D TOF SCIN 4.5–9.99 480 Table C6. Recommended angular distribution experimental data of
$ ^{50,52,54,nat}{\rm{Cr}} $ Reaction Year First Author Institute Source Method Detector En (MeV) Points $ ^{nat}{\rm{Cr}}(n,xn) $ 1997 D.Schmidt Physikalisch-Technische Bundesanstalt, Braunschweig, Germany D-D TOF, PSD SCIN 7.95–14.1 4061 1993 S.Matsuyama Tohoku Univ., Sendai, Japan D-T TOF SCIN 14.1 668 1987 A.Takahashi Osaka Univ., Osaka, Japan D-T TOF SCIN 14.1 1094 1983 A.Takahashi Osaka Univ., Osaka, Japan D-T TOF SCIN 13.4–14.8 677 $ ^{50}{\rm{Cr}}(n,x)^{1}{\rm{H}} $ 1994 L.I.Klochkova Leningradskiy Tekhnologicheskiy Inst. Im. Lensoveta, Russia D-T EDE TELES, PROPC, SCIN 14.1 86 $ ^{50}{\rm{Cr}}(n,x)^{4}{\rm{He}} $ 1981 C.Derndorfer Inst. fuer Isotopenforschung und Kernphysik, Vienna, Austria D-T EDE TELES, PROPC, CSICR 14.1 48 $ ^{52}{\rm{Cr}}(n,x)^{1}{\rm{H}} $ 1975 D.V.Aleksandrov Leningradskiy Tekhnologicheskiy Inst. Im. Lensoveta, Russia – Counter telescope method TELES 14.1 29 1961 L.Colli Centro Informazioni Studi ed Esperienze (CISE), Milan, Italy D-T COINC TELES, PROPC, SCIN, COIN, CSICR 14.1 35 Table C7. Recommended double-differential cross sections experimental data of
$ ^{50,52,nat}{\rm{Cr}} $ Reaction Year First Author Institute Source Method Detector En(MeV) Points $ ^{50}{\rm{Cr}}(n,x)^{1}{\rm{H}} $ 1994 L.I.Klochkova Leningradskiy Tekhnologicheskiy Inst. Im. Lensoveta, Russia D-T EDE TELES, PROPC, SCIN 14.1 46 $ ^{50,52}{\rm{Cr}}(n,x)^{1}{\rm{H}} $ ;
$ ^{50,52}{\rm{Cr}}(n,x)^{2}{\rm{H}} $ ;
$ ^{50,52}{\rm{Cr}}(n,x)^{4}{\rm{He}} $ 1979 S.M.Grimes Lawrence Livermore National Laboratory, Livermore, CA, USA D-T – MAGSP, SIBAR 14.8 27 $ ^{50}{\rm{Cr}}(n,x)^{4}{\rm{He}} $ 1994 I.Matsuyama Tohoku Univ., Sendai, Japan D-T, D-D, D-14 N, D-15 N – IOCH, TELES, SCIN 5.1–14.1 72 1981 C.Derndorfer Inst. fuer Isotopenforschung und Kernphysik, Vienna, Austria D-T EDE TELES, PROPC, CSICR 14.1 11 $ {\rm{nat}}{\rm{Cr}}(n,xn) $ 1997 D.Schmidt Physikalisch-Technische Bundesanstalt, Braunschweig, Germany D-D TOT, PSD SCIN 7.95–14.1 149 1993 S.Matsuyama Tohoku Univ., Sendai, Japan D-T TOF SCIN 14.1 74 1987 A.Takahashi Osaka Univ., Osaka, Japan D-T TOF SCIN 14.1 72 Table C8. Recommended energy spectra experimental data of
$ ^{50,52,nat}{\rm{Cr}} $ -
No. Identification Benchmark $ k_{eff} $ Uncertainty (1 sigma) EALF (eV) 1 HEU-COMP-FAST-003-001 1.000 0.0085 23700.000 2 HEU-COMP-FAST-003-002 1.000 0.0088 37900.000 3 HEU-COMP-FAST-003-021 1.000 0.0092 43700.000 4 HEU-COMP-FAST-003-022 1.000 0.0090 35600.000 5 HEU-COMP-FAST-003-023 1.000 0.0093 46100.000 6 HEU-COMP-INTER-005-002 1.050 0.0080 3590.000 7 HEU-COMP-INTER-005-003 1.030 0.0060 7210.000 8 HEU-COMP-INTER-005-004 1.064 0.0180 4400.000 9 HEU-COMP-MIXED-002-003 1.000 0.0093 16900.000 10 HEU-COMP-MIXED-002-004 1.000 0.0087 3990.000 11 HEU-COMP-MIXED-002-005 1.000 0.0089 5360.000 12 HEU-COMP-MIXED-002-007 1.000 0.0086 3340.000 13 HEU-COMP-MIXED-002-008 1.000 0.0068 237.000 14 HEU-COMP-MIXED-002-009 1.000 0.0076 250.000 15 HEU-COMP-MIXED-002-010 1.000 0.0081 1390.000 16 HEU-COMP-MIXED-002-011 1.000 0.0088 1960.000 17 HEU-COMP-MIXED-002-012 1.000 0.0078 508.000 18 HEU-COMP-MIXED-002-013 1.000 0.0083 590.000 19 HEU-COMP-MIXED-002-014 1.000 0.0112 10700.000 20 HEU-COMP-MIXED-002-015 1.000 0.0111 6920.000 21 HEU-COMP-MIXED-002-016 1.000 0.0108 25000.000 22 HEU-COMP-MIXED-002-017 1.000 0.0112 12300.000 23 HEU-COMP-MIXED-002-018 1.000 0.0111 5510.000 24 HEU-COMP-MIXED-002-019 1.000 0.0107 3970.000 25 HEU-COMP-MIXED-002-020 1.000 0.0108 25200.000 26 HEU-MET-FAST-061-001 0.9998 0.0025 309000.000 27 HEU-MET-FAST-075-001 0.9985 0.0027 226000.000 28 HEU-MET-INTER-001-001 0.9966 0.0026 29400.000 29 HEU-SOL-THERM-038-001 1.000 0.0025 0.390 30 HEU-SOL-THERM-038-002 1.000 0.0025 0.310 31 HEU-SOL-THERM-038-003 1.000 0.0025 0.361 32 HEU-SOL-THERM-038-004 1.000 0.0025 0.389 33 HEU-SOL-THERM-038-005 1.000 0.0025 0.391 34 HEU-SOL-THERM-038-006 1.000 0.0025 0.313 35 HEU-SOL-THERM-038-007 1.000 0.0032 0.359 36 HEU-SOL-THERM-038-008 1.000 0.0026 0.355 37 HEU-SOL-THERM-038-009 1.000 0.0033 0.351 38 HEU-SOL-THERM-038-010 1.000 0.0026 0.370 39 HEU-SOL-THERM-038-011 1.000 0.0025 0.389 40 HEU-SOL-THERM-038-012 1.000 0.0025 0.388 41 HEU-SOL-THERM-038-013 1.000 0.0050 0.404 42 HEU-SOL-THERM-038-014 1.000 0.0050 0.406 43 HEU-SOL-THERM-038-015 1.000 0.0050 0.408 44 HEU-SOL-THERM-038-016 1.000 0.0050 0.409 45 HEU-SOL-THERM-038-017 1.000 0.0026 0.392 46 HEU-SOL-THERM-038-018 1.000 0.0032 0.385 47 HEU-SOL-THERM-038-019 1.000 0.0032 0.385 48 HEU-SOL-THERM-038-020 1.000 0.0032 0.385 49 HEU-SOL-THERM-038-021 1.000 0.0025 0.338 50 HEU-SOL-THERM-038-022 1.000 0.0027 0.330 51 HEU-SOL-THERM-038-023 1.000 0.0027 0.330 52 HEU-SOL-THERM-038-024 1.000 0.0026 0.407 53 HEU-SOL-THERM-038-025 1.000 0.0032 0.386 54 HEU-SOL-THERM-038-026 1.000 0.0032 0.385 55 HEU-SOL-THERM-038-027 1.000 0.0032 0.398 56 HEU-SOL-THERM-038-028 1.000 0.0025 0.371 57 HEU-SOL-THERM-038-029 1.000 0.0025 0.344 58 HEU-SOL-THERM-038-030 1.000 0.0027 0.338 59 MIX-MET-FAST-011-001 0.9897 0.0023 297000.000 60 MIX-MET-FAST-011-002 0.9998 0.0023 330000.000 61 PU-MET-FAST-033-001 0.9967 0.0026 422000.000 62 PU-MET-INTER-002-001 0.9869 0.0026 10200.000 Table D1. List of Criticality Benchmark Experiments for Macroscopic Examination of
$ ^{52}{\rm{Cr}} $
New Evaluation and Validation Towards Neutron Reaction Data on Chromium Isotopes at Incident Energies Below 200 MeV
- Received Date: 2026-01-15
- Available Online: 2026-06-01
Abstract: Chromium (Cr) serves as an indispensable structural material in accelerator-driven systems (ADS) and Generation IV reactors, where the precision of its neutron reaction data is important for ensuring reactor safety and operational reliability. However, significant discrepancies persist in both experimental data and evaluations for key reaction channels, such as $(n, p)$ and $(n, 2n)$, across the chromium isotopes $^{50,52,53,54}{\rm{Cr}}$. This study presents a novel evaluation and validation of neutron reaction data for these isotopes at incident energies below 200 MeV, incorporating 571 experimental datasets from EXFOR covering cross sections, angular distributions, energy spectra, and double - differential cross sections. The newly evaluated data provide more reliable key cross sections: the $^{52}{\rm{Cr}}(n,2n)$ cross section resolves discrepancies and supports H.,Liskien et al.'s data; the $^{52}{\rm{Cr}}(n, p)$ cross section aligns well with natural chromium data across all energies, and is validated by competition analysis. The results accurately replicate double differential cross sections and energy spectra, with neutron emission spectra matching experimental peaks and charged - particle spectra agreeing with measurements for $^{50,52}{\rm{Cr}}$. Moreover, the abundance - weighted sum of $(n, p)$ and $(n, 2n)$ cross sections for chromium isotopes agrees well with natural chromium data, confirming systematic consistency. All evaluations are validated using 62 ICSBEP 2014 benchmark facilities with $k_{{\rm{eff}}}$ sensitivity to chromium neutron data > 1%. For the PMI002_01 experiment, calculated $k_{{\rm{eff}}}$ decreased by $\sim 1000$ pcm relative to CENDL - 3.2, improving agreement with the benchmark; in the OKTAVIAN shielding benchmark, the neutron leakage spectrum also produces experiments well.


 DownLoad: