


 Abstract
 HTML
HTML Reference
 Related
 PDF
PDF


-
Photonuclear data, which describe the response of atomic nuclei to incident photons, are essential for fundamental nuclear physics and have broad applications across various fields [1]. The (γ, n) cross sections are a branch of photonuclear data and can be used to calculate the γ-ray strength function (γSF) [2, 3], with which γ-ray cascades in nuclear reactions can be described [4, 5]. At photon energies between 10 and 20 MeV, nuclear reactions are generally dominated by the Giant Dipole Resonance (GDR), which is interpreted as a collective oscillation of protons against neutrons [6]. The (γ, n) cross sections measured in the GDR region provide access to key nuclear properties [7, 8] and are crucial for improving models of nuclear structure and reaction mechanisms, such as Hauser-Feshbach (HF) statistical calculations [9, 10].
It is known that weak slow process (s-process) associated with helium burning in massive stars (with masses exceeding about eight solar masses), dominates the synthesis of nuclei in the mass range 60 < A < 90. The overall abundance distribution in this region is particularly sensitive to the cross sections of the Ni–Cu–Zn isotopes, which lie at the onset of the s-process path. The photoneutron cross section of the stable isotope
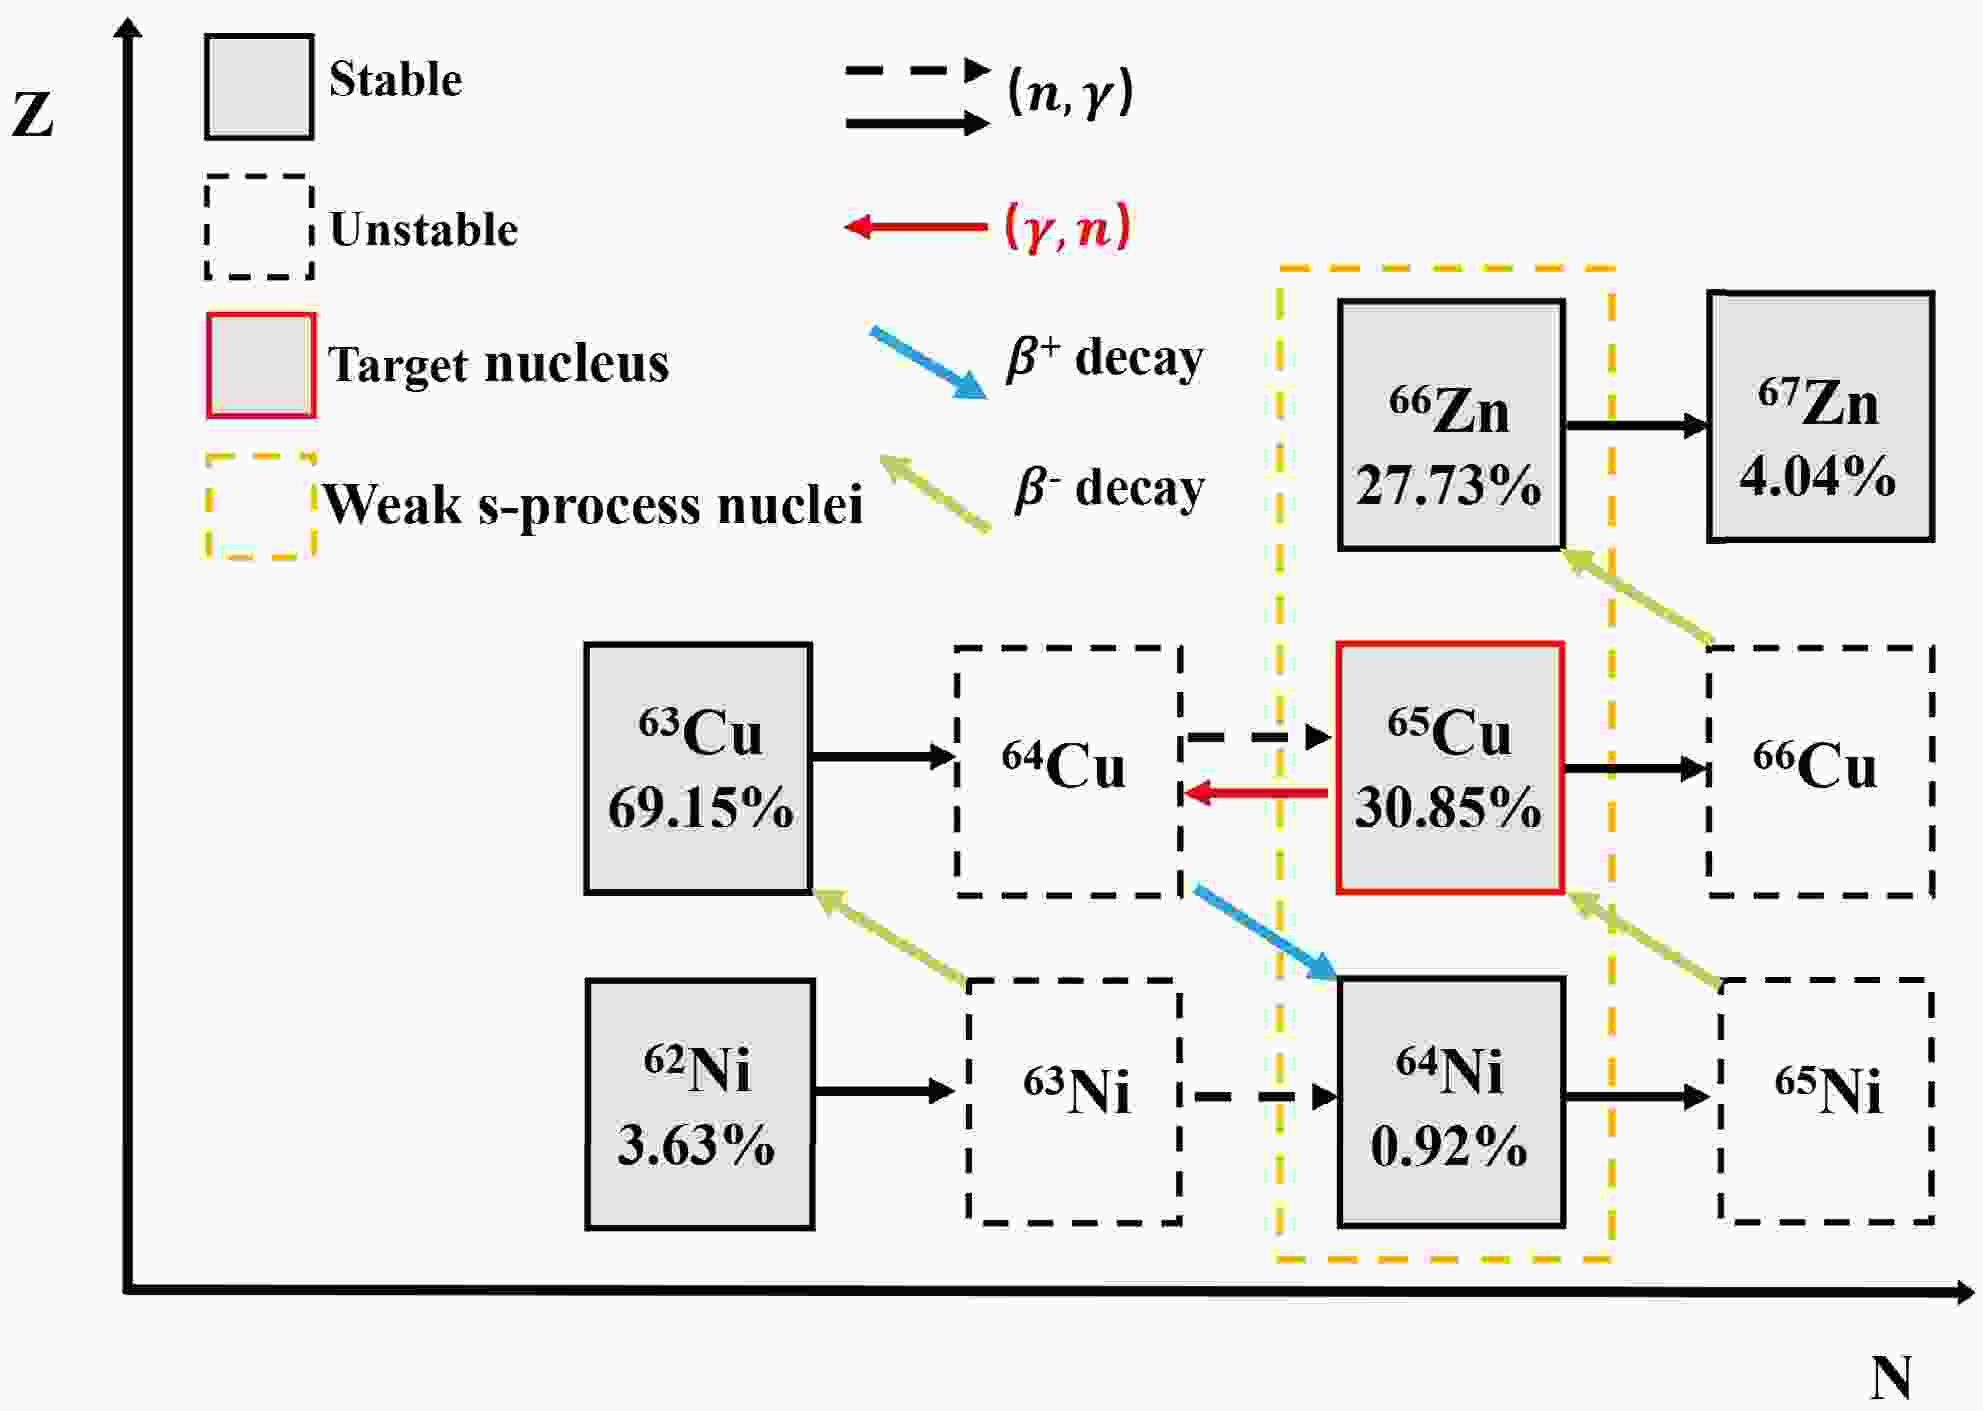
$ ^{65} {\rm{Cu}}$ and the neutron-capture cross section of the unstable isotope$ ^{64} {\rm{Cu}}$ (with a half-life of$ 12.7 $ h) may affect the abundances of$ ^{64} {\rm{Ni}}$ and$ ^{66} {\rm{Zn}}$ , which are neighboring stable nuclides around$ ^{65} {\rm{Cu}}$ in the mass region involved in the weak s-process [11]. Fig. 1 illustrates the primary reaction pathways involving$ ^{64} {\rm{Cu}}$ and$ ^{65} {\rm{Cu}}$ . Therefore, precise experimental constraints on these key reactions become essential for improving the reliability of nucleosynthesis models in weak s-process mass region. In addition, the$ ^{65} {\rm{Cu}}$ (γ, n)$ ^{64} {\rm{Cu}}$ reaction represents a candidate route for production of medically interesting isotope$ ^{64} {\rm{Cu}}$ .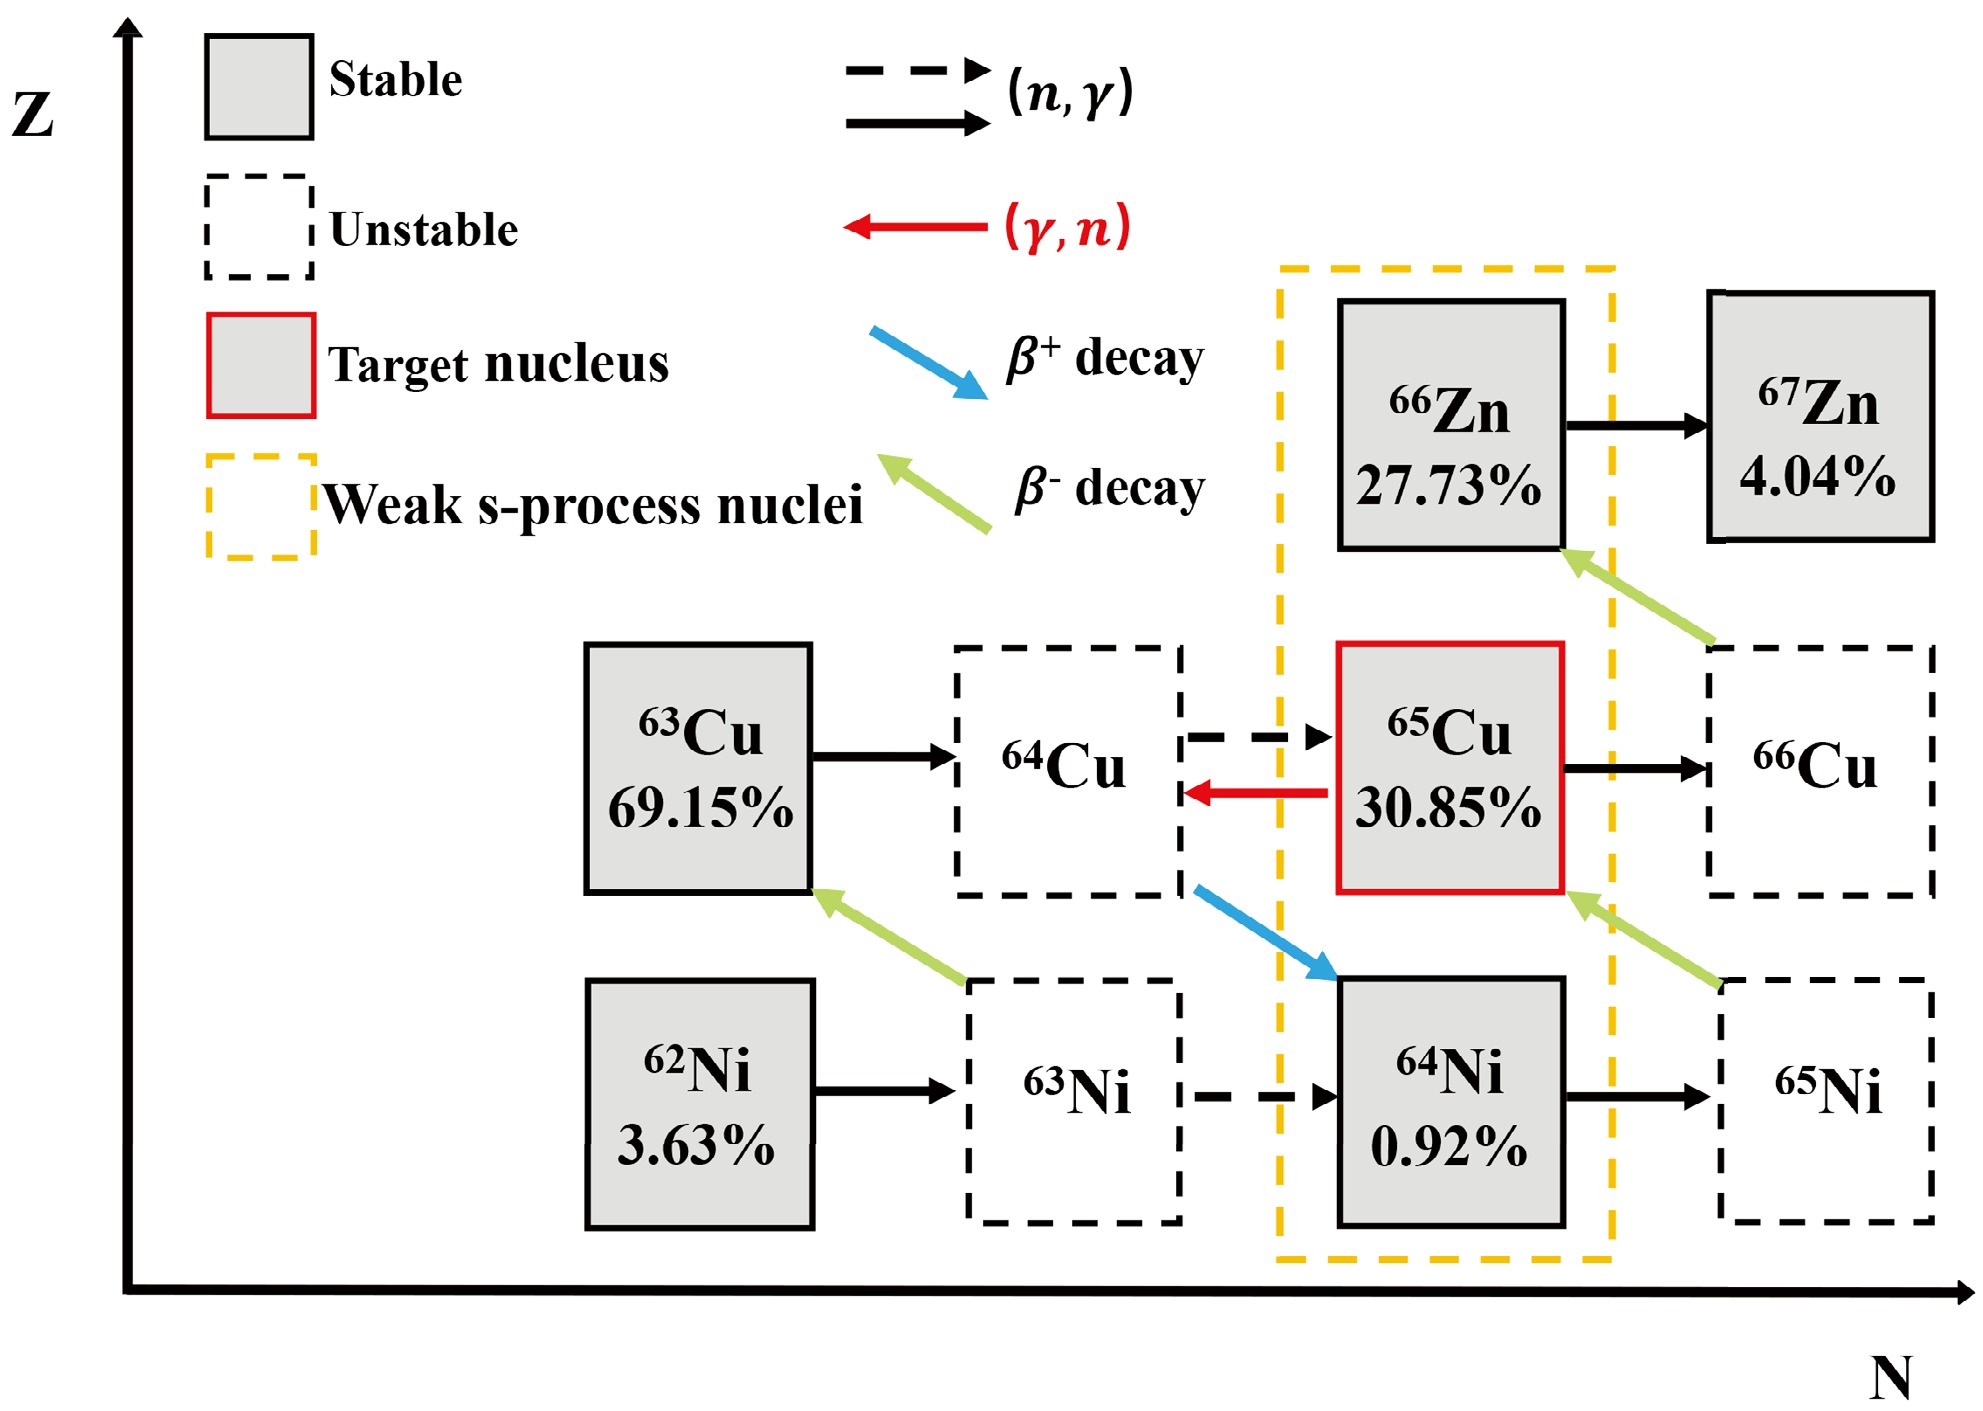
Figure 1. (Color online) Partial reaction path in the vicinity of
$ ^{65} {\rm{Cu}}$ . Stable isotopes are shown in gray, while unstable ones are in white. Red and black arrows represent photoneutron reactions and inversely neutron capture reactions, respectively, while green and blue arrows indicate$ \beta^- $ and$ \beta^+ $ decays, respectively.Experimental and theoretical investigations of photonuclear reactions on
$ ^{65} {\rm{Cu}}$ have been extensively reported [12−16], which provide a few sets of photonuclear reaction data. However, visible discrepancies still exist among available measurements due to the usage of both different γ-ray sources (such as bremsstrahlung radiations and quasi-monoenergetic γ-ray beams) and experimental techniques (such as direct measurements [17] and subtraction methods [15]). These inconsistencies are reflected in both the profile of energy differential cross section (distribution width and peak position) and the value of its peaked cross section. Therefore, a new direct measurement employing quasi-monoenergetic γ-ray beams together with an isotopically enriched target is urgently needed to improve the reliability of the$ ^{65} {\rm{Cu}}$ (γ, n)$ ^{64} {\rm{Cu}}$ data, which may in turn enable a reliable calculation of the inverse$ ^{64} {\rm{Cu}}$ (n, γ)$ ^{65} {\rm{Cu}}$ cross sections.In this study, we report a detailed experimental investigation on photoneutron reaction of isotopic
$ ^{65} {\rm{Cu}}$ using a quasi-monoenergetic and energy-tunable γ-ray beams. The measured$ ^{65} {\rm{Cu}}$ (γ, n)$ ^{64} {\rm{Cu}}$ data are presented and the comparison between experimental and evaluated data are discussed. In Sec. II, the experimental procedure is described. The analysis and discussion of the extracted photoneutron cross sections are presented in Sec. III. The radiative neutron capture cross sections and the corresponding astrophysical reaction rates for the unstable isotope$ ^{64} {\rm{Cu}}$ are calculated and compared with evaluated data in Sec. IV. Finally, conclusions are drawn in Sec. V. -
Shanghai Laser Electron Gamma Source (SLEGS, https://cstr.cn/31124.02.SSRF.BL03SSID) is a beamline designed to produce energy-tunable MeV γ-ray beams through backward or slanting laser-Compton scattering (LCS) between CO2 laser photons (with wavelength λ =
$ 10.64 $ µm) and$ 3.5 $ GeV electrons from Shanghai Synchrotron Radiation Facility (SSRF) [18, 19]. The SLEGS γ-ray energy can be adjusted from$ 21.7 $ to$ 0.66 $ MeV by varying the laser incident angle at$ 180^\circ $ and within the range of$ 160^\circ $ -$ 20^\circ $ . After the successful commissioning in 2021 [20], the final configuration of the SLEGS beamline was opened to user in 2023 with the installation of the Three-hole (T) collimator [21, 22], which controls the energy resolution and flux of γ-ray beams. The energy profile and flux were systematically investigated to characterize γ-ray beams produced at SLEGS [23−28]. Now the SLEGS γ-ray beams have a medium energy resolution, primarily due to the large angular dispersion of laser beams focused with the short focal length inside the interaction chamber [26, 29]. The energy resolution is achieved by using the T collimator with a 2 mm aperture. Fig. 2(a) shows the SLEGS beamline configuration and the following detector setup at end of the beamline. Fig. 2(b) shows the schematic interaction geometry of the SSRF electron beam and the CO2 laser pulse in the laboratory frame. Fig. 2(c) shows the SLEGS γ-ray profile diagnosed after they pass through the T collimator. In the experiment, the copper attenuator was positioned sufficiently away from the detector system, with its front end located 290 cm from the FED detector and its rear end 130 cm from the BGO detector, so that no obvious background contribution from the attenuator to the FED was observed.
Figure 2. (Color online) (a) Schematic diagram of
$ ^{65} {\rm{Cu}}$ (γ, n) cross section measurement setup. (b) Interaction geometry of an electron beam and a laser beam in the laboratory frame, from which the LCS γ-ray are emitted within a small cone angle along with the electron moving direction. (c) LCS γ-ray profile diagnosed after they pass through a 10 mm-aperture Coarse collimator and 2 mm-aperture T collimator.In this study, the SLEGS γ-ray beams were produced under the operation of slanting LCS mode. These γ-ray beams exactly cover the energy range from the single-neutron separation energy (
$ S_{\text{n}} = 9.91 $ MeV) up to the double-neutron separation threshold ($ S_{\text{2n}} = 17.82 $ MeV). After collimation, the SLEGS γ-ray beams were irradiated on the$ ^{65} {\rm{Cu}}$ target, which was precisely positioned at the geometric center of the Flat-Efficiency Detector (FED). The photon-induced neutrons were then moderated by polyethylene before being captured by the 3He proportional counters. The penetrated γ-ray beams were attenuated by a copper attenuator and subsequently measured with a BGO detector. Digital signal processing was performed using the Mesytec MDPP-16 [30] in conjunction with an MVME-based data acquisition (DAQ) system [31]. -
During the
$ ^{65} {\rm{Cu}}$ irradiation, the γ-ray spectrum after attenuation was continuously monitored using a BGO detector positioned downstream of the target. A representative spectrum measured at the laser incident angle of$ \theta_L = 90^\circ $ is shown in Fig. 3(a). After obtaining the BGO measured spectrum (black solid line), the SLEGS γ-ray spectrum (red dashed line) incident on the target was then calculated by taking into account the thickness and attenuation coefficients of both the copper attenuator and the target material. The spectral distribution was unfolded using a direct unfolding method based on the detector response matrix simulated with GEANT4 [32]. The blue dashed line in Fig. 3(a) represent the reconstructed spectrum, which is obtained by folding the incident gamma spectrum with the detector response matrix, showing good agreement with the measured BGO response spectrum. The total number of γ-ray contributing to the reaction,$ N_{\gamma} $ , was obtained by integrating the incident gamma spectrum above the$ S_{\text{n}} $ , as shown in red shadow region of Fig. 3(a). The unfolded energy profiles for the γ-ray beams used in the$ ^{65} {\rm{Cu}}$ measurements are shown in Fig. 3(b). The intensity difference between the measured and unfolded spectra is mainly caused by a significant attenuation from both the copper attenuator ($ 160 $ mm thickness) and$ ^{65} {\rm{Cu}}$ target during experiment (5 hours).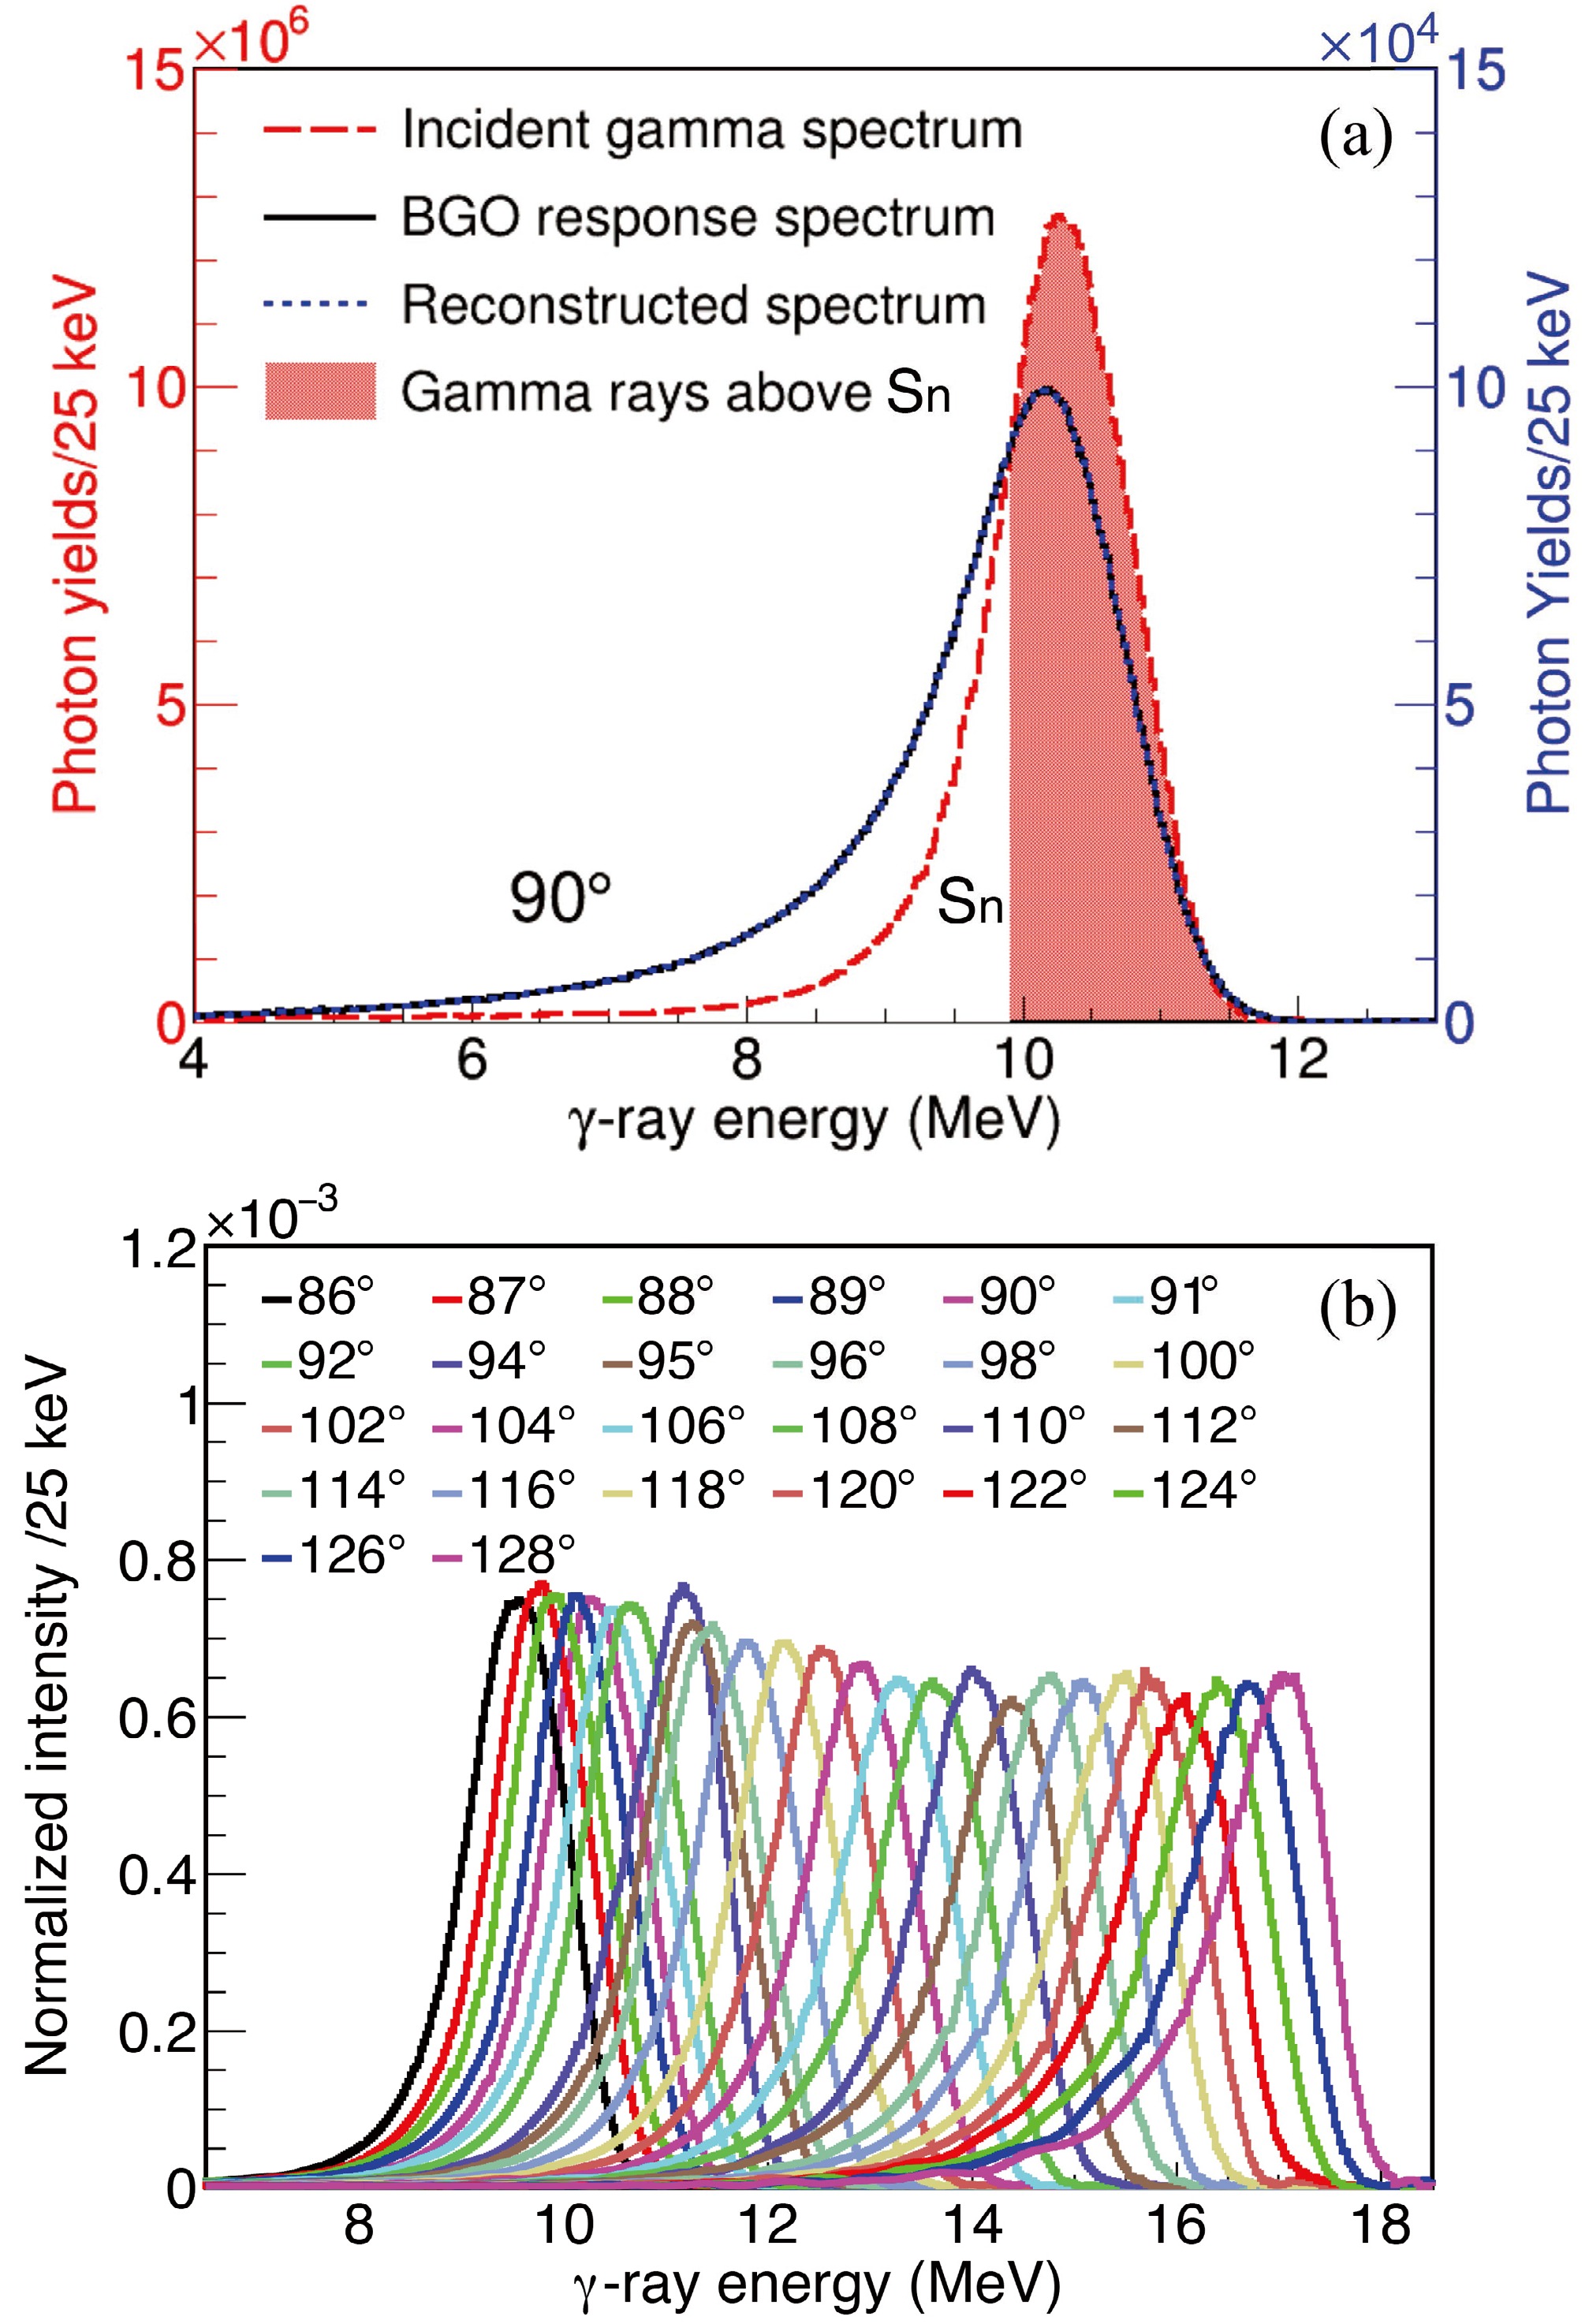
Figure 3. (Color online) (a) Typical γ-ray spectra measured by the BGO detector (see black line), folded-back γ-ray spectra (see blue line), and the corresponding γ-ray spectra incident on the target (see red line) at
$ \theta_L $ =$ 90 ^\circ $ . (b) Spectral distributions of the γ-ray beams unfolded at different$ \theta_L $ . -
The physical form of the
$ ^{65} {\rm{Cu}}$ target is listed in Table 1. The target purity was determined by inductively coupled plasma-mass spectrometer. The thickness uncertainty was estimated to be 0.01 %.Chemical purity Cu $ \sim $ 100.00 (%)Isotopic enrichment of $ ^{65} {\rm{Cu}}$ $ \ge $ 99.70 (%)Weight (mg) Diameter (mm) Thickness (mm) Density (g/cm3) 529.34 10.000 0.88 7.59 Table 1. The
$ ^{65} {\rm{Cu}}$ target used for irradiation. -
Neutron counts (
$ N_{\text{n}} $ ) were determined with the FED. It consists of 26 3He proportional counters embedded in a polyethylene moderator with the dimensions of 450 × 450 × 550 mm. This polyethylene moderator is covered with a 2 mm thick Cd sheet to absorb environmental neutrons, and then further wrapped with a 50 mm thick layer of polyethylene. The proportional counters were arranged in three concentric rings to determine the average neutron energy via the Ring-ratio (RR) method [33]. The inner ring, positioned at 65 mm from the center, contains 6 1-inch counters. The middle ring (110 mm from center) has 8 2-inch counters, and the outer ring (175 mm from center) holds 12 2-inch counters. All the proportional counters were filled with 2 atm of 3He gas. The total FED efficiency in the plateau region is approximately 40%. The FED has been calibrated using$ ^{252} {\rm{Cf}}$ neutron source, and its efficiency uncertainty is determined to be 3.02% [34].The DAQ system of the FED enables recording of the pulse height and timestamp of signals from detectors. For the
$ N_{\text{n}} $ determination, accurate thresholds of the Analog-to-Digital Converter spectra for each 3He proportional counter have been assigned to distinguish the γ background from the neutrons. Then the constant bremsstrahlung-induced background is distinguished from the LCS γ beam-induced neutrons by its time distribution [34]. In this work, the CO2 laser operates at an average power of 5 W, with a pulse period of 1000 µs and a pulse width of 50 µs. The$ N_{\text{n}} $ can be extracted by directly subtracting the time normalized background. This method, as presented in our previous work [35], provides a practical approach to estimating the average neutron energy, which can then be used to determine the FED efficiency for detecting the neutrons emitted from$ ^{65} {\rm{Cu}}$ (γ, n)$ ^{64} {\rm{Cu}}$ reactions. -
The total experimental uncertainties included statistical, methodological and systematic uncertainties. The statistical uncertainty was primarily induced by
$ N_{\text{n}} $ and$ N_\gamma $ , which encompasses the corresponding statistical fluctuations. Since the incident$ N_\gamma $ has a sufficiently high count rate in our study, it contributes negligibly to the statistical uncertainty. The methodological uncertainty consists of two main components: the$ N_{\text{n}} $ extraction algorithm and the unfolding procedure using the simulated BGO response matrix. The systematic uncertainties was primarily due to the external γ-ray induced by the copper attenuator, the target thickness, and the FED detection efficiency. The methodological uncertainty and systematic uncertainties are as summarized in Table 2.Parameter Value (%) Methodological $ N_{\text{n}} $ extraction algorithm2.0 Unfolding method 1.0 Systematic Target thickness $< $ 0.1Copper attenuator 0.5 FED efficiency 3.02 Table 2. Methodological and systematic uncertainties.
-
The experimental photoneutron cross section
$ \sigma_{\mathrm{exp}} $ measured with a quasi-monochromatic γ-ray beams is given by the following expression [36, 37],$ \sigma_{\text{exp}} = \int_{S_{\text{n}}}^{{E_{\text{max}}}} n_{\gamma}(E_{\gamma})\sigma(E_{\gamma}) dE_{\gamma} = \frac{N_{\text{n}}}{N_{\gamma}N_{\text{t}}\xi\epsilon_{\text{n}}g}, $
(1) where
$ n_{\gamma}(E_\gamma) $ represents the normalized energy profile of the incident γ-ray beams. The term$ \sigma(E_\gamma) $ denotes the monochromatic cross section, which is the quantity to be determined.$ N_{\text{n}} $ corresponds to the number of detected neutrons, while$ N_\gamma $ is the number of γ-ray incident on the$ ^{65} {\rm{Cu}}$ target above the$ S_{\text{n}} $ . The average FED efficiency,$ \epsilon_{\text{n}} $ , is derived using the RR technique [35].$ N_{\text{t}} $ represents the number of target nuclei per unit area. The correction factor in term of target self-attenuation is given by$ \xi = (1-e^{-\mu t})/(\mu t) $ , where μ is the attenuation coefficient for incident γ-ray, and t is the target thickness. Finally, g is the fraction of the γ-ray flux above$ S_{\text{n}} $ (see Fig. 3(a)). Its expression is given by$ g = \frac{\int_{S_{\text{n}}}^{E_{\text{max}}}n_\gamma(E_\gamma){\rm{d}} \it{E_\gamma}}{\int_{0}^{E_{\text{max}}}n_\gamma(E_\gamma){\rm{d}} \it{E_\gamma}} . $
(2) Note that the measured quantities described above are commonly referred to as monochromatic approximations. In reality, they correspond to the convolution of the true energy-dependent cross sections with the spectral distribution of the incident photon beam. Specifically, the measured cross section represents the folding of the excitation function with the γ-ray energy spectrum, which is the monochromatic approximation cross section in the experiment.
-
To obtain the energy-dependent photoneutron cross section
$ \sigma(E_{\gamma}) $ , it is essential to extract it from the integral form given in Eq. 1. Each measured cross section, represents a convolution of the true cross section$ \sigma(E_{\gamma}) $ with the normalized incident beam profile$ n_{\gamma}(E_{\gamma}) $ . In this study, we adopt the unfolding algorithm proposed in Ref. [38] to extract$ \sigma(E_{\gamma}) $ from Eq. 1,$ \sigma_{\text{f}} = {\bf{D}}\sigma, $
(3) where the quantity
$ \sigma_{\rm{f}} $ represents a monochromatic approximated cross section array, where each element corresponds to the monochromatic approximated cross section measured at discrete beam energies ($ E_\gamma $ ). The array σ contains the monochromatic cross sections. The matrix D is constructed from normalized spectral distribution of the incident γ-ray beams with energy spanning from$ S_{\text{n}} $ to$ E_{\text{max}} $ at each independent measurement. Eq. 4 is the expanded form of the Eq. 3. The number of rows (N) in D corresponds to the number of discrete beam energies, while the number of columns (M) represents the number of bins within the incident γ-ray spectrum. For the$ ^{65} {\rm{Cu}}$ case, we choose N = 25 and M = 1000.$ \begin{bmatrix} \sigma_{1} \\ \sigma_{2} \\ \vdots \\ \sigma_{N} \\ \end{bmatrix}_{\substack{{\text{f}}}} = \begin{bmatrix} D_{11} & D_{12} &\cdots&\cdots& D_{1M}\\ D_{21} & D_{22} &\cdots&\cdots& D_{2M}\\ \vdots & \vdots &\vdots&\vdots& \vdots\\ D_{N1} & D_{N2} &\cdots&\cdots& D_{NM}\\ \end{bmatrix} \begin{bmatrix} \sigma_{1} \\ \sigma_{2} \\ \vdots \\ \vdots \\ \sigma_{M} \\ \end{bmatrix}. $
(4) An unfolding iteration method is employed to extract the monochromatic cross section σ:
(1) As our starting point, we choose for the zeroth iteration, a constant trial function
$ \sigma^{0} $ . This initial vector is multiplied with D, and we get the zeroth folded vector$ \sigma^{0}_{\text{f}} $ =$ {\bf{D}}\sigma^{0} $ .(2) The next trial input function,
$ \sigma^{1} $ , is established by adding the difference of the experimentally measured spectrum,$ \sigma_{\text{exp}} $ , and the folded spectrum,$ \sigma^{0}_{\text{f}} $ , to$ \sigma^{0} $ ,$ \sigma^{1} = \sigma^{0}+(\sigma_{\text{exp}}-\sigma^{0}_{\text{f}}). $
(5) It is worth noting that the dimension of
$ \sigma^{0} $ (M) is much larger than that of$ \sigma_{\rm{exp}} $ and$ \sigma_{\rm{f}}^0 $ (N). To perform Eq. 5, it is necessary to expand the dimensions of$ \sigma_{\rm{exp}} $ and$ \sigma_{\rm{f}}^0 $ to M by interpolate.(3) The above steps are iterated i times, giving
$ \sigma^{i}_{\text{f}} = D\sigma^{i}, $
(6) and
$ \sigma^{i+1} = \sigma^{i}+(\sigma_{\text{exp}}-\sigma^{i}_{\text{f}}). $
(7) The
$ \chi^2 $ between$ \sigma_{\text{exp}} $ and$ \sigma_{\text{f}}^{i+1} $ is recorded in each iteration. The iterative process is stopped until convergence is achieved. This means that$ \sigma^{i+1}_{\text{f}} \approx \sigma_{\text{exp}} $ within the statistical uncertainties.Fig. 4 presents the monochromatic cross sections
$ \sigma_{\text{exp}} $ and the unfolded energy-dependent cross sections$ \sigma(E_{\gamma}) $ for the$ ^{65} {\rm{Cu}}$ (γ, n)$ ^{64} {\rm{Cu}}$ reaction. The$ \sigma(E_{\gamma}) $ values at each$ E_{\gamma} $ , together with their uncertainties, are summarized in Table 3. These uncertainties account for statistical, systematic and methodological contributions. In our case, the total uncertainty of the unfolded$ \sigma(E_{\gamma}) $ is approximately 4%, except in the low-energy region of$ S_{\text{n}} \lt E_{\gamma} \lt 10.90 $ MeV where$ \sigma(E_{\gamma}) $ drops below 12.10 mb.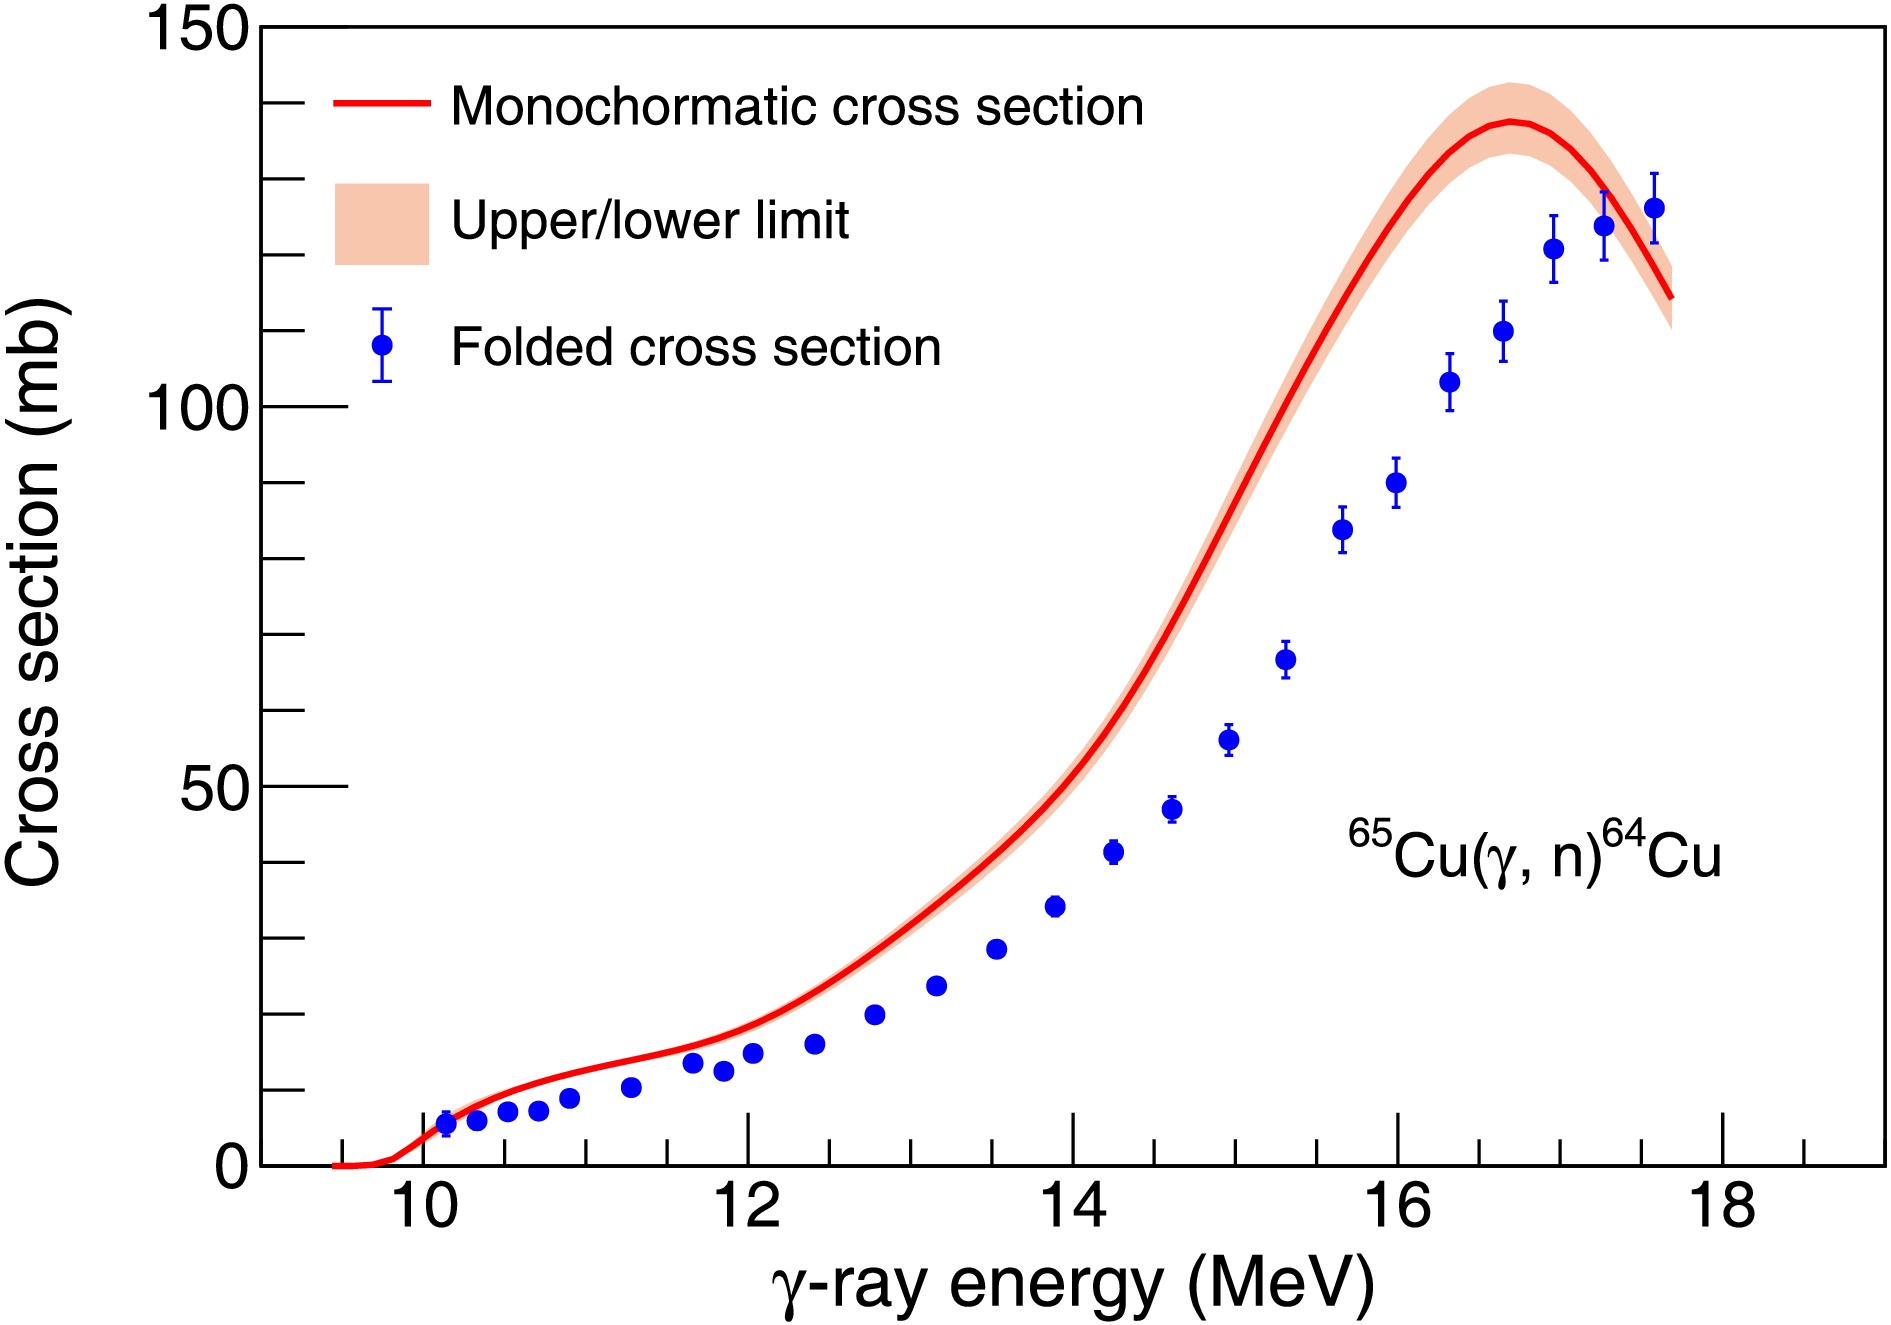
Figure 4. (Color online)
$ ^{65} {\rm{Cu}}$ (γ,n)$ ^{64}{\rm{Cu}} $ cross section as a function of the incident γ-ray energy,$ E_{\gamma} $ . The dots are the folded cross section, and the line with shadow area shows the monochromatic cross section.$E_\gamma$ (MeV)σ (mb) Statistical uncertainty (mb) Methodological uncertainty (mb) Systematic uncertainty (mb) Total uncertainty (mb) 10.14 5.69 1.61 0.10 0.18 1.62 10.33 7.92 1.45 0.15 0.25 1.48 10.52 9.62 0.42 0.17 0.30 0.55 10.71 10.99 0.36 0.20 0.35 0.54 10.90 12.10 0.63 0.22 0.38 0.77 11.28 13.92 0.22 0.24 0.44 0.55 11.66 15.80 0.25 0.27 0.50 0.62 11.85 17.06 0.19 0.28 0.54 0.63 12.03 18.65 0.30 0.30 0.59 0.72 12.41 22.92 0.22 0.37 0.72 0.84 12.78 28.30 0.26 0.45 0.89 1.03 13.16 34.39 0.29 0.55 1.08 1.25 13.53 41.06 0.32 0.65 1.29 1.48 13.89 48.81 0.34 0.79 1.54 1.76 14.25 58.75 0.39 0.94 1.85 2.11 14.61 71.48 0.45 1.14 2.25 2.57 14.96 85.98 0.59 1.40 2.71 3.11 15.31 100.46 0.59 1.64 3.17 3.62 15.66 113.67 0.65 1.88 3.58 4.10 15.99 125.08 0.75 2.06 3.94 4.51 16.32 133.59 1.00 2.22 4.21 4.87 16.65 137.36 0.91 2.25 4.33 4.97 16.96 135.58 0.81 2.34 4.27 4.94 17.27 128.65 0.77 2.20 4.06 4.68 17.58 118.45 0.72 2.00 3.73 4.30 Table 3. The monochromatic cross sections and corresponding uncertainties for the
$ ^{65} {\rm{Cu}}$ (γ, n)$ ^{64} {\rm{Cu}}$ reaction. -
We compare the currently measured data for the
$ ^{65} {\rm{Cu}}$ (γ, n)$ ^{64} {\rm{Cu}}$ reaction with available experimental data from the EXFOR database [12−15] and the TENDL-2023 evaluations. The results are shown in Fig. 5(a). Since earlier measurements employed different types of γ-ray sources together with different experimental techniques, their results are analyzed and discussed separately. To quantitatively analyze these differences, we further calculate the ratios of the data obtained in the current study to the experimental data shown in Fig. 5(b).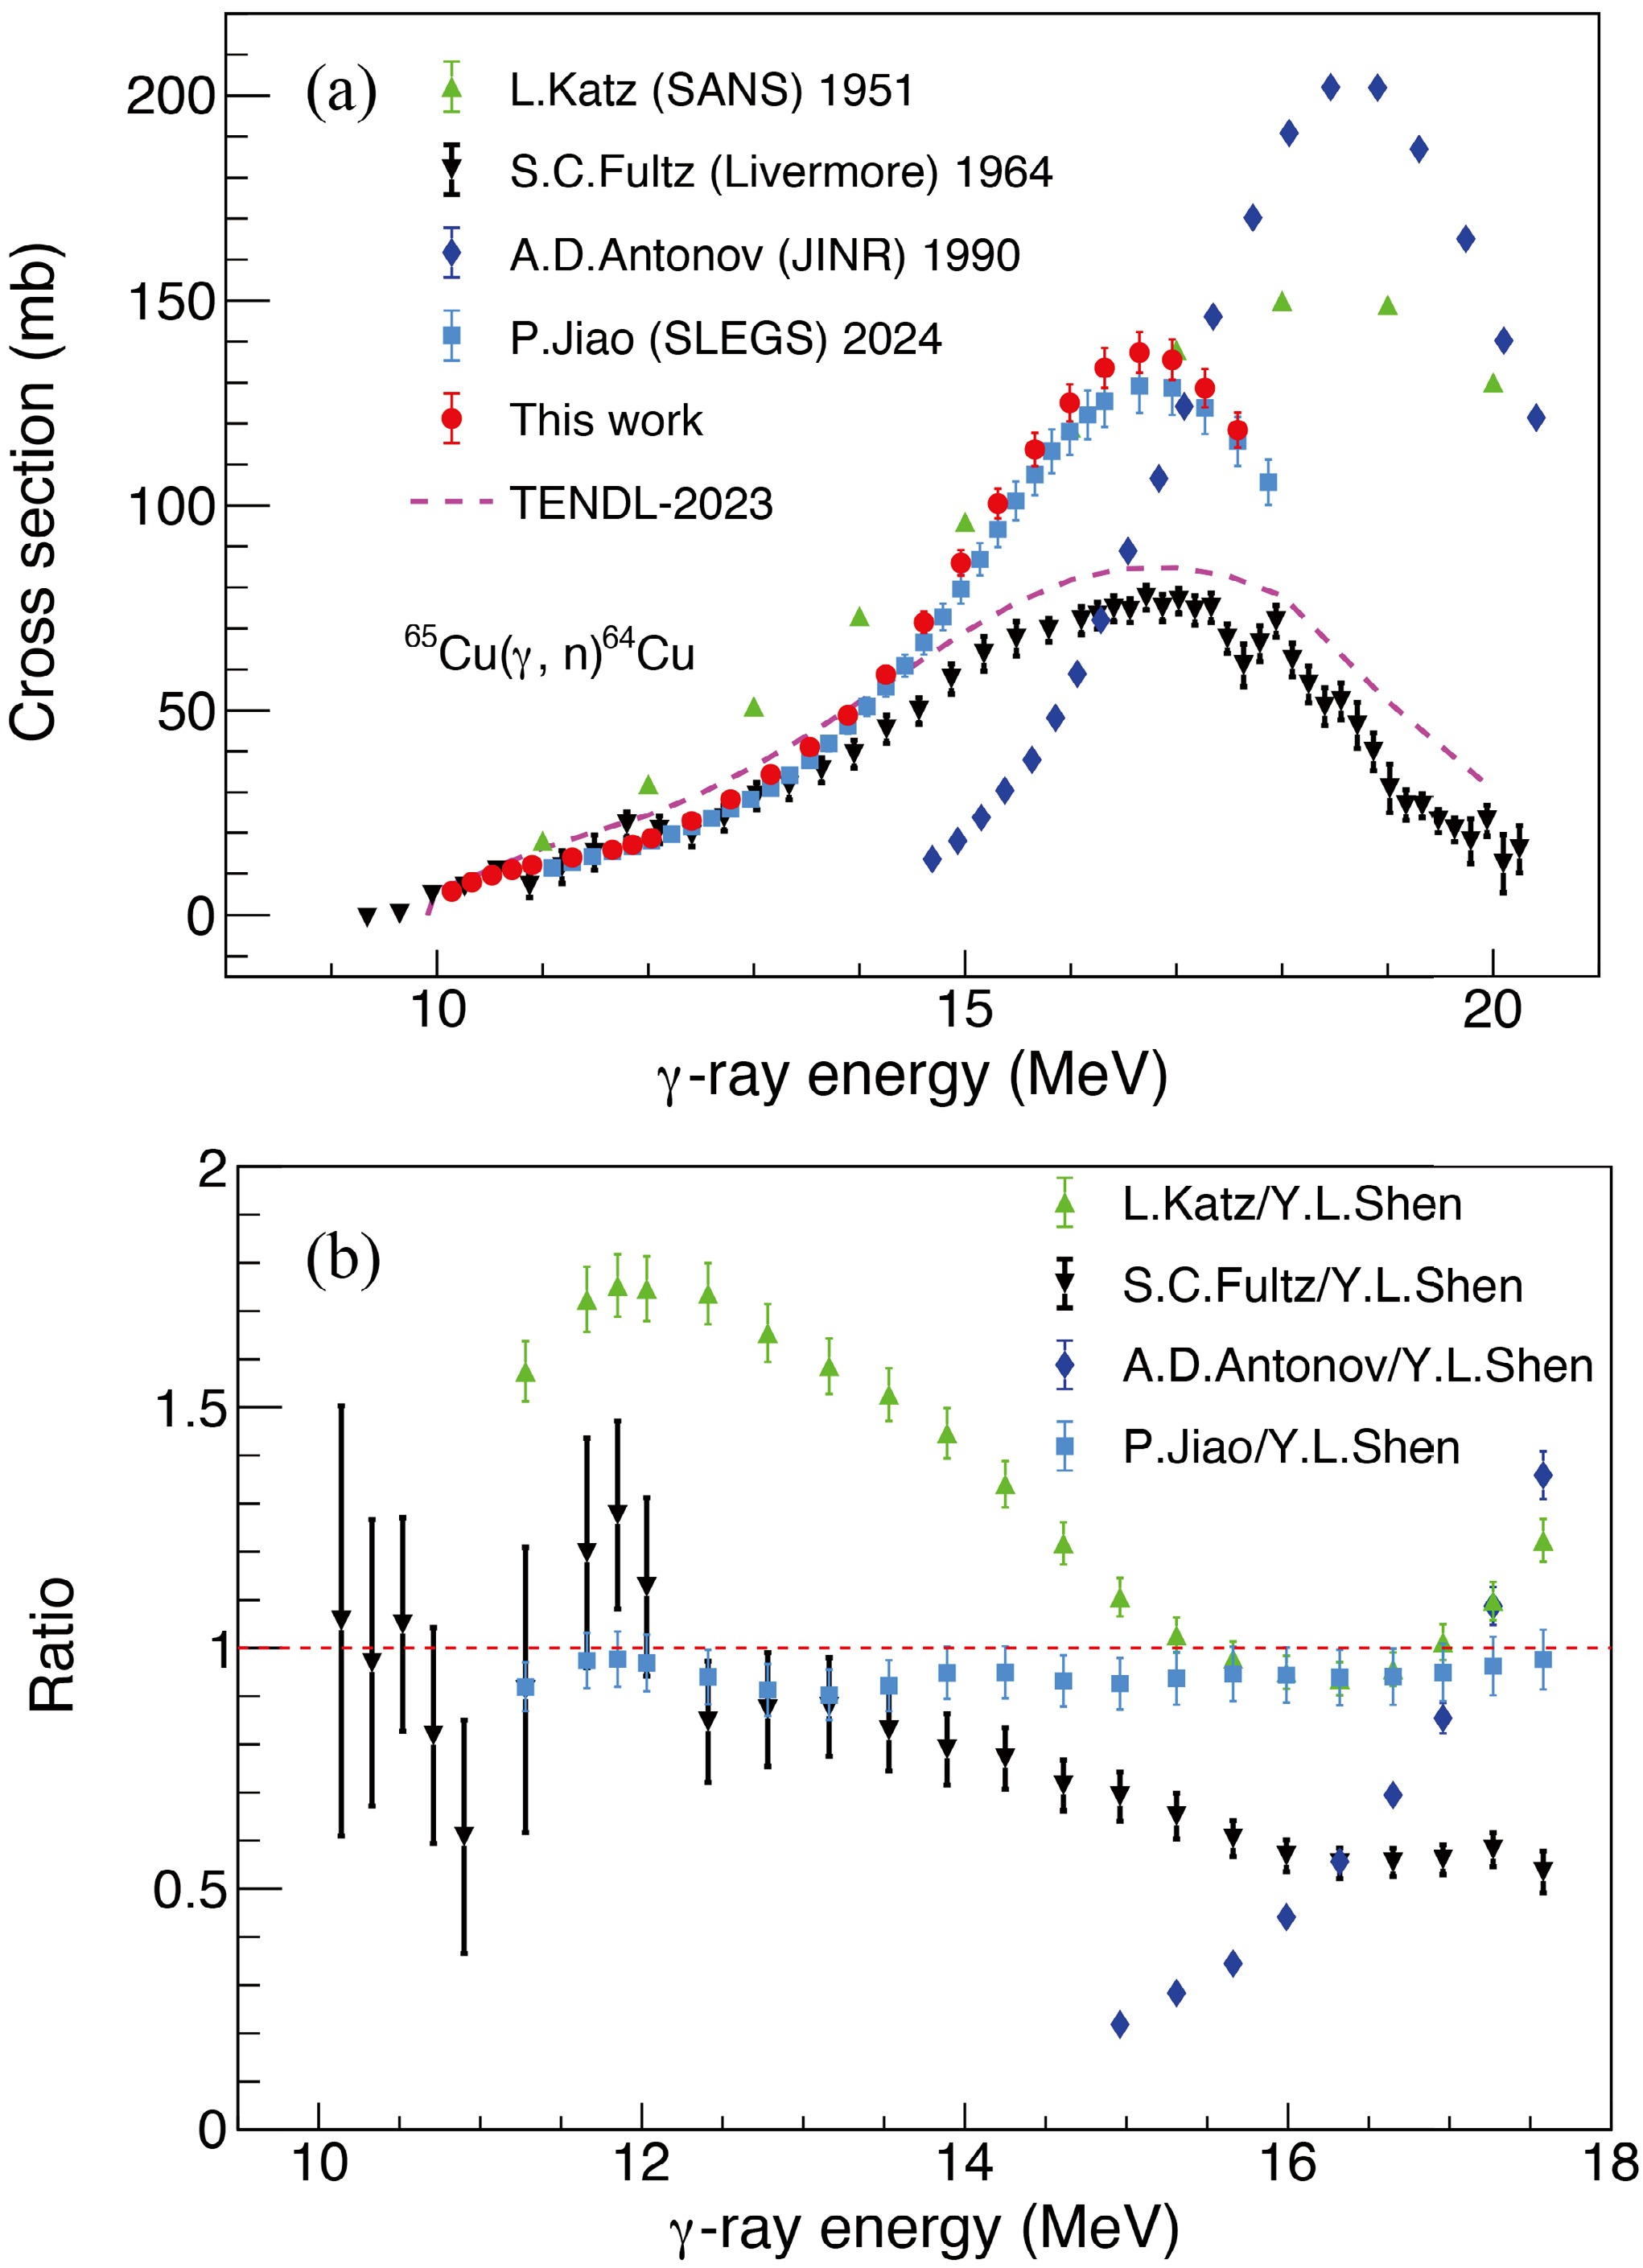
Katz et al. [12] reported
$ ^{65} {\rm{Cu}}$ photoneutron cross sections in 1951 at the SANS laboratory in Canada, using bremsstrahlung photons with endpoint energies between 11.00 and 22.00 MeV. Antonov et al. [13] carried out a similar measurement at JINR in Russia with bremsstrahlung radiations whose endpoint energies ranging from 14.68 to 24.55 MeV. Compared with the present work, both datasets show substantial deviations both at lower energies and within the GDR peak region. For example, a significant difference exists in their GDR peak positions, magnitude, and widths.Fultz et al. [14] measured the
$ ^{65} {\rm{Cu}}$ (γ, n)$ ^{64} {\rm{Cu}}$ data at the Livermore Laboratory in 1964 using quasi-monoenergetic annihilation photons and a BF3-filled FED neutron detector, covering the energy range 9.34 – 27.78 MeV. Such measurement exhibits a good agreement with our data below 15 MeV, although the data of Fultz et al. remain systematically lower than our data by a factor of about 0.4 in the GDR region.Recently, Jiao et al. [15] performed the photoneutron cross section measurement with natural Cu target by using the quasi-monoenergetic γ-ray beams at the SLEGS. Combining with the measured natural Cu data and the previously measured
$ ^{63} {\rm{Cu}}$ data [39], the$ ^{65} {\rm{Cu}}$ (γ, n)$ ^{64} {\rm{Cu}}$ cross sections within the energy range of 11.28 – 17.58 MeV were successfully extracted using the subtraction method [15]. Their result shows good agreement with the present measurement using an isotopic$ ^{65} {\rm{Cu}}$ target, as shown in Fig. 5.We should note that early measurements with bremsstrahlung γ-ray sources [12, 13] suffered from limited accuracy due to the broad photon spectra and additional uncertainties introduced in the unfolding procedures. Although the Livermore data were obtained using quasi-monoenergetic annihilation photons, systematic discrepancies still appear when compared with the Saclay measurements that employed the same type of γ-ray beams. The SLEGS experiment [15] did not measure the cross sections near
$ S_{\text{n}} $ of the$ ^{65} {\rm{Cu}}$ , which led to a slight difference between the monochromatic cross sections obtained through the subtraction method and those from the present experiment. -
The γSF [40] is a nuclear statistical quantity to describe the nuclear electromagnetic response. In the de-excitation mode, the γSF quantifies the average probability of a nucleus emitting a γ-ray of a given energy
$ E_{\gamma} $ during de-excitation, which we refer to as downward γSF and can be defined by [41],$ \overleftarrow{f_{X1}}(E_\gamma) = \frac{\langle \Gamma_{X1}(E_{\gamma}) / E_{\gamma}^3 \rangle}{D_{\ell}}. $
(8) Here, the symbol X is either electric (E) or magnetic (M),
$ \langle\Gamma_{X1}(E_\gamma)\rangle $ is the average radiation width, and$ D_\ell $ is the average level spacing for s-wave ($ \ell $ = 0) or p-wave ($ \ell $ = 1) neutron resonances.In contrast, the γSF in the excitation mode, which we refer to as upward γSF, is defined by the average cross section for
$ E_1 $ /$ M_1 $ photoabsorption$ \langle\sigma_{X1}(E_{\gamma})\rangle $ to the final states with all possible spins and parities [42],$ \overrightarrow{f_{X1}}(E_\gamma) = \frac{1}{3 \pi^2 \hbar^2 c^2} \frac{\langle \sigma_{X1}(E_{\gamma}) \rangle}{E_\gamma}. $
(9) Here,
$ \hbar $ is the planck constant and c is the light speed in vacuum. Above the$ S_{\text{n}} $ , except at energies very close to the reaction threshold, the total upward γSF can be approximated by replacing$ \sigma_{X1}(E_\gamma) $ with experimental (γ, n) cross sections, which dominate the photoabsorption cross section in this energy region. This approach relies on the principle of the detailed balance [43] and on the generalized Brink hypothesis, which assumes that the average electromagnetic decay process (i.e. photo-deexcitation) can be directly related to the inverse photo-excitation and depends only on the energy of the emitted γ-ray, irrespective of the absolute excitation energy or nuclear structure properties such as spin and parity. This assumption is expressed as$ f_{X1}(E_\gamma) = \overleftarrow{f_{X1}}(E_\gamma) = \overrightarrow{f_{X1}}(E_\gamma) $ , and provides the theoretical foundation for linking (γ, n) cross section to the downward γSF,$ f_{E1}(E_\gamma) = \frac{1}{3 \pi^2 \hbar^2 c^2} \frac{\sigma_{\gamma n}(E_\gamma)}{E_\gamma}, $
(10) where the constant
$ 1 / (3 \pi^2 \hbar^2 c^2) = 8.674 \times 10^{-8} \,\mathrm{mb}^{-1}\,\mathrm{MeV}^{-2} $ . Using this relation, we can obtain the experimentally constrained γSF from the measured$ ^{65} {\rm{Cu}}$ (γ, n)$ ^{64} {\rm{Cu}}$ data, as shown in Fig. 6. Note that Eq. 10 holds only when the neutron channel in the photoneutron data dominates. In the vicinity of$ S_{\text{n}} $ , the competing γ emission needs to be taken into account through the HF formalism.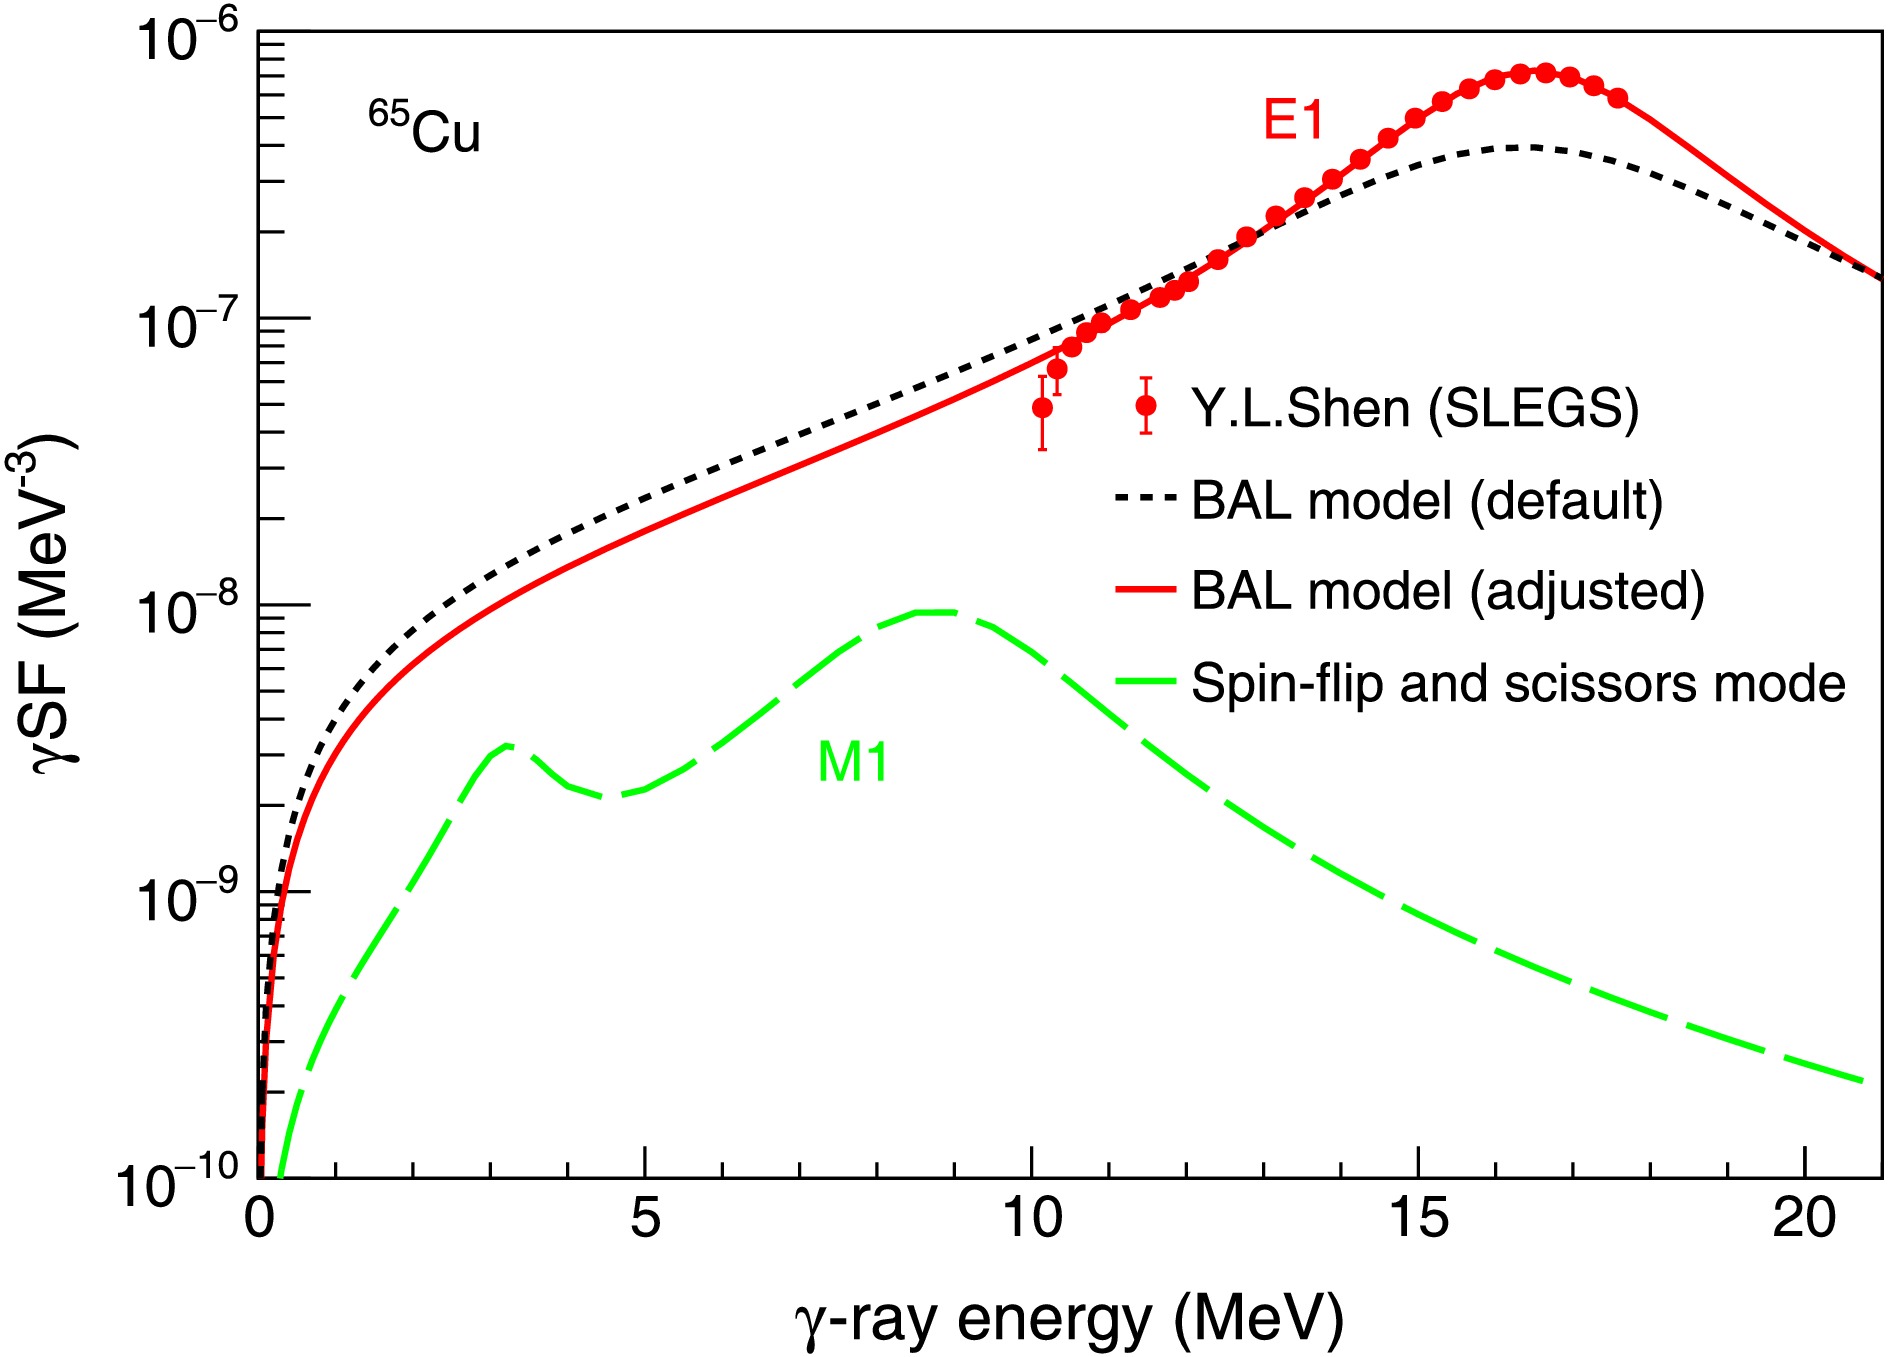
Figure 6. (Color online) Comparison of the experimentally extracted γSF (red circles) for
$ ^{65} {\rm{Cu}}$ with theoretical calculations. The black line corresponds to the$ E_1 $ component calculated using the BAL model (strength 2), and the green line represents the$ M_1 $ contribution arising from the spin-flip and scissors mode (strengthM1 3) in TALYS. The red line indicates the adjusted BAL model that fits well the experimental data.We further perform a theoretical analysis for
$ ^{65} {\rm{Cu}}$ γSF using the TALYS software (version 2.0) [44]. Here, the$ E_1 $ strength was described by the macroscopic Brink–Axel Lorentzian (BAL) model [45, 46], and the$ M_1 $ strength was described using the default M1 model spin-flip and scissors mode in TALYS, which includes contributions from the spin-flip mode and the scissors mode [47]. These results are also shown in Fig. 6. It is found that the theoretical γSF by default and the experimental data have noticeable discrepancies. This suggests that additional constraints are required to further improve the theoretical description.To improve the agreement between the theoretical calculation and the experimental data, the Lorentzian parameters
$ sgr $ ,$ ggr $ and$ egr $ in TALYS calculations were adjusted simultaneously by a Bayesian optimization procedure [48, 49]. The parameter spaces were chosen in a proper way such that the calculated cross sections encompass the experimental upper and lower limits. Within this parameter space, we try to identify an optimal parameter set that best reproduces the experimentally extracted γSF, which corresponds to a minimized value for chi-square ($ \chi^2 $ ) between the TALYS calculations and the experimental data. In our case, the$ \chi^2 $ reads,$ \chi^2 = \frac{1}{N} \sum \frac{(\gamma\mathrm{SF}_{\mathrm{th}} - \gamma\mathrm{SF}_{\mathrm{exp}})^2} {\gamma\mathrm{SF}_{\mathrm{err}}^2}, $
(11) where N is the number of experimental data points, and
$ \gamma\mathrm{SF}_{\mathrm{th}} $ ,$ \gamma\mathrm{SF}_{\mathrm{exp}} $ and$ \gamma\mathrm{SF}_{\mathrm{err}} $ represent theoretical data, experimental data and its uncertainty, respectively. In our case, a Gaussian process was employed as a surrogate model to describe the dependence of$ \chi^2 $ on model parameters in TALYS, assuming that these$ \chi^2 $ values follow a Gaussian distribution. At each iteration, the next candidate point was selected by maximizing the expected improvement acquisition function. Then an optimal parameter set was determined as the one yields a globally minimum$ \chi^2 $ among all data points. As the BAL model is employed, the$ \chi^2 $ value for$ ^{65} {\rm{Cu}}$ reaches a minimum of 9.96 when the Lorentzian parameters$ sgr $ = 139.31,$ egr $ = 16.63 and$ ggr $ = 4.37. One can see that the optimized calculation reproduces well with the experimental data of the$ ^{64} {\rm{Cu}}$ γSF (see Fig. 6). -
The constrained
$ ^{65} {\rm{Cu}}$ γSF is further applied to calculate neutron capture cross sections for the inverse reaction$ ^{64} {\rm{Cu}}$ (n, γ)$ ^{65} {\rm{Cu}}$ . Note that in addition to the constrained γSF, the above calculation is highly sensitive to the nuclear level density (NLD) in TALYS. As a result, we first check the level density data considering different NLD models. Fig. 7 shows six kinds of level densities for$ ^{65}\text{Cu} $ , which are predicted by available NLD models including CTM [50], BFM [51], GSM [52, 53], HF-BCS [54], Skyrme-HFB [55] and Gogny-HFB [56]. One can see that these level density curves show an overall agreement, whereas a slight variation appears when the excitation energy is higher than 7 MeV.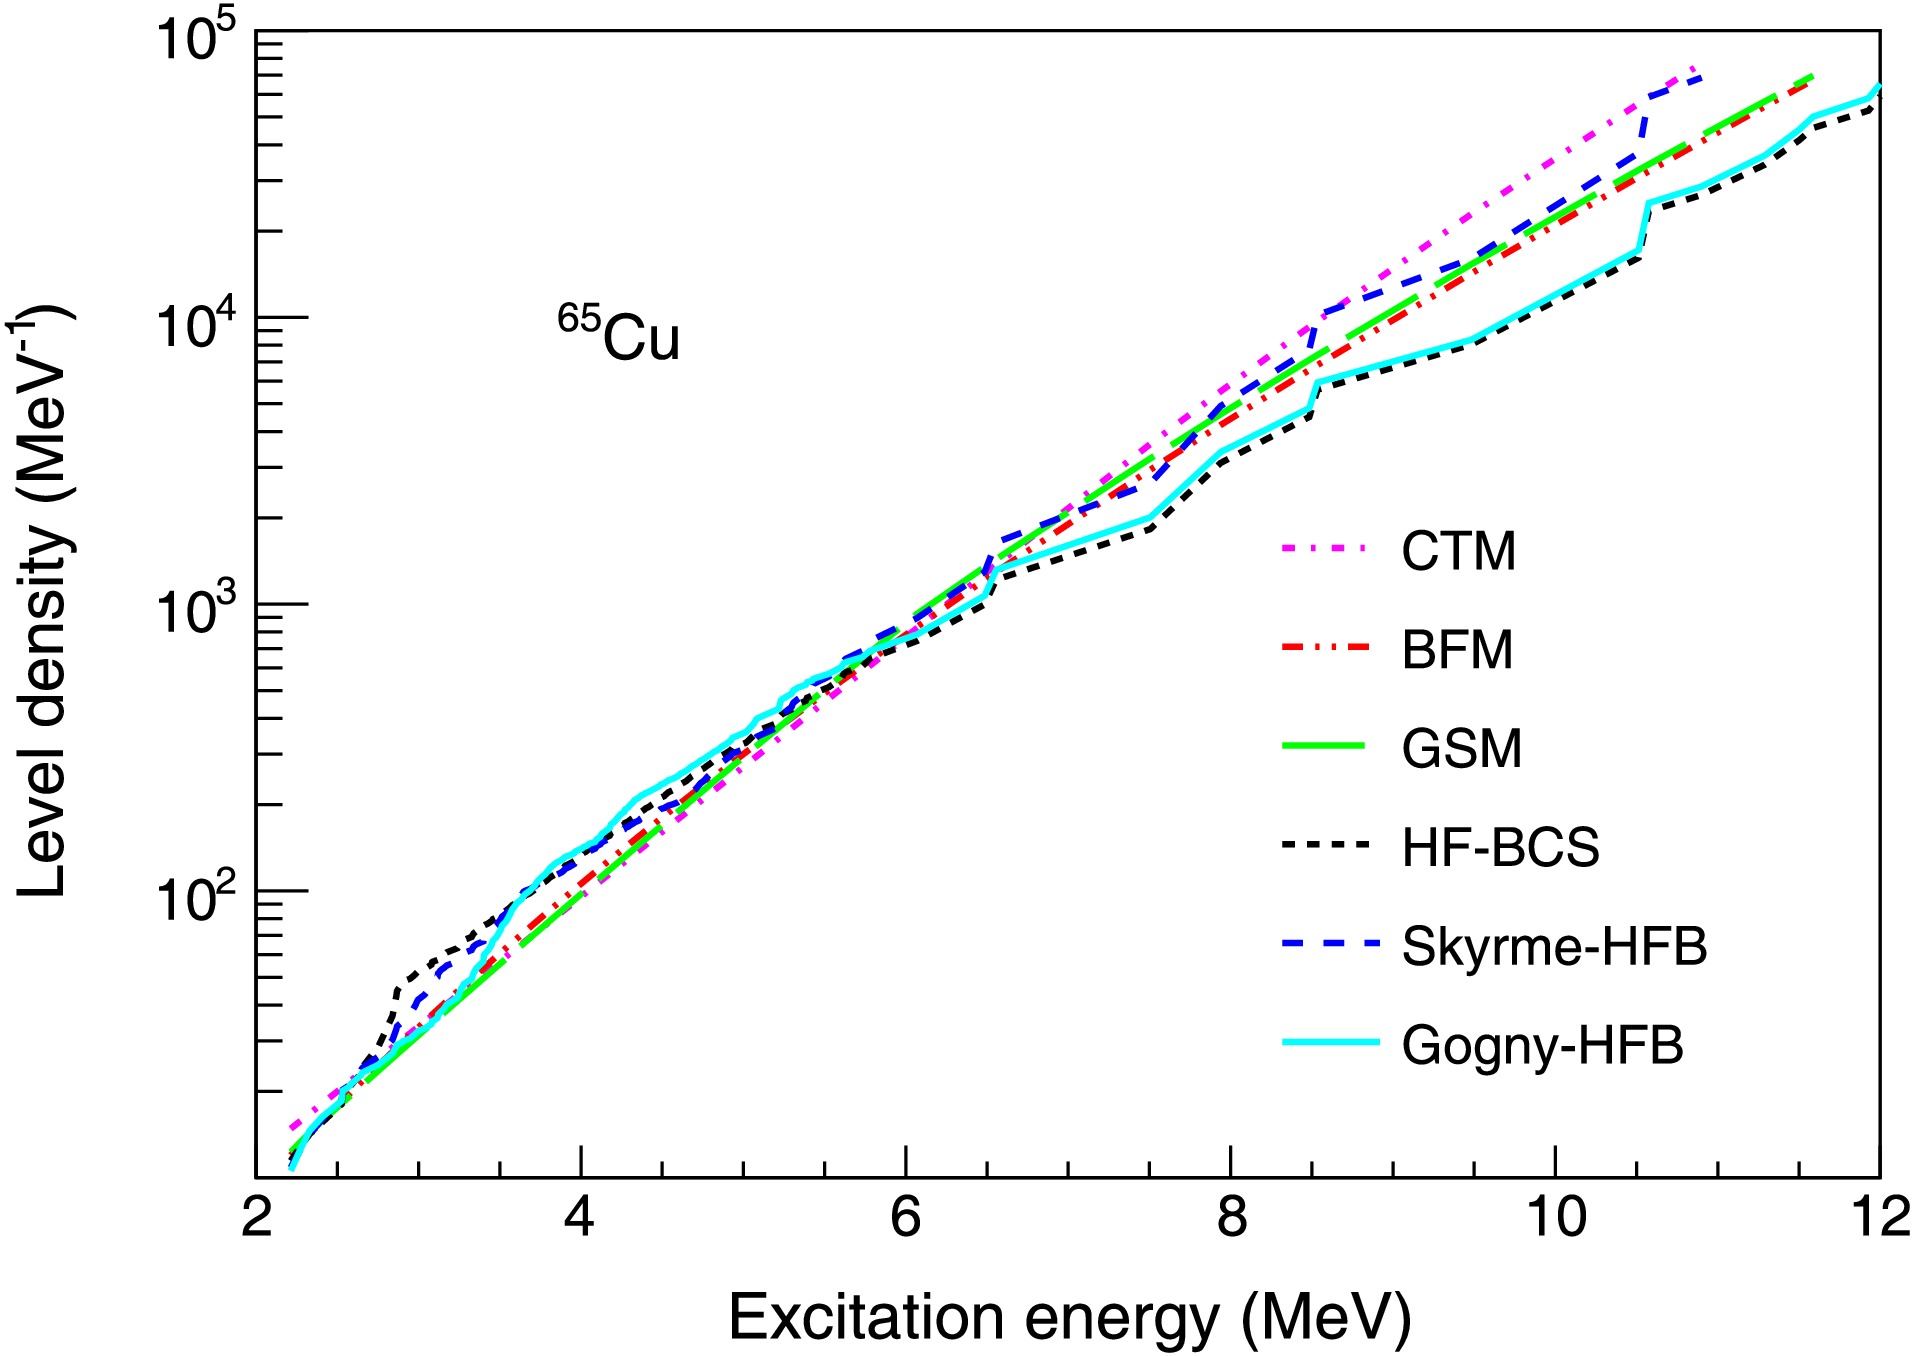
By using the adjusted BAL model (
$ E_1 $ ) and the default spin-flip and scissors mode ($ M_1 $ ), we further calculate radiative neutron capture cross sections for$ ^{64} {\rm{Cu}}$ . The resulting$ ^{64} {\rm{Cu}}$ (n, γ)$ ^{65} {\rm{Cu}}$ data are shown in Fig. 8. The shaded band in the figure reflects the data uncertainty arising from different NLD models [38, 57]. Evaluated data from the EAF-2010, ENDF/B-VIII.0, JEFF-3.3, TENDL-2023, and JENDL-5 libraries are also presented in Fig. 8 for comparison. One can see that the data obtained within the BAL model show good agreement with the EAF-2010, TENDL-2023, and JENDL-5 evaluations, whereas they are higher than the evaluated data from both ENDF/B-VIII.0 and JEFF-3.3.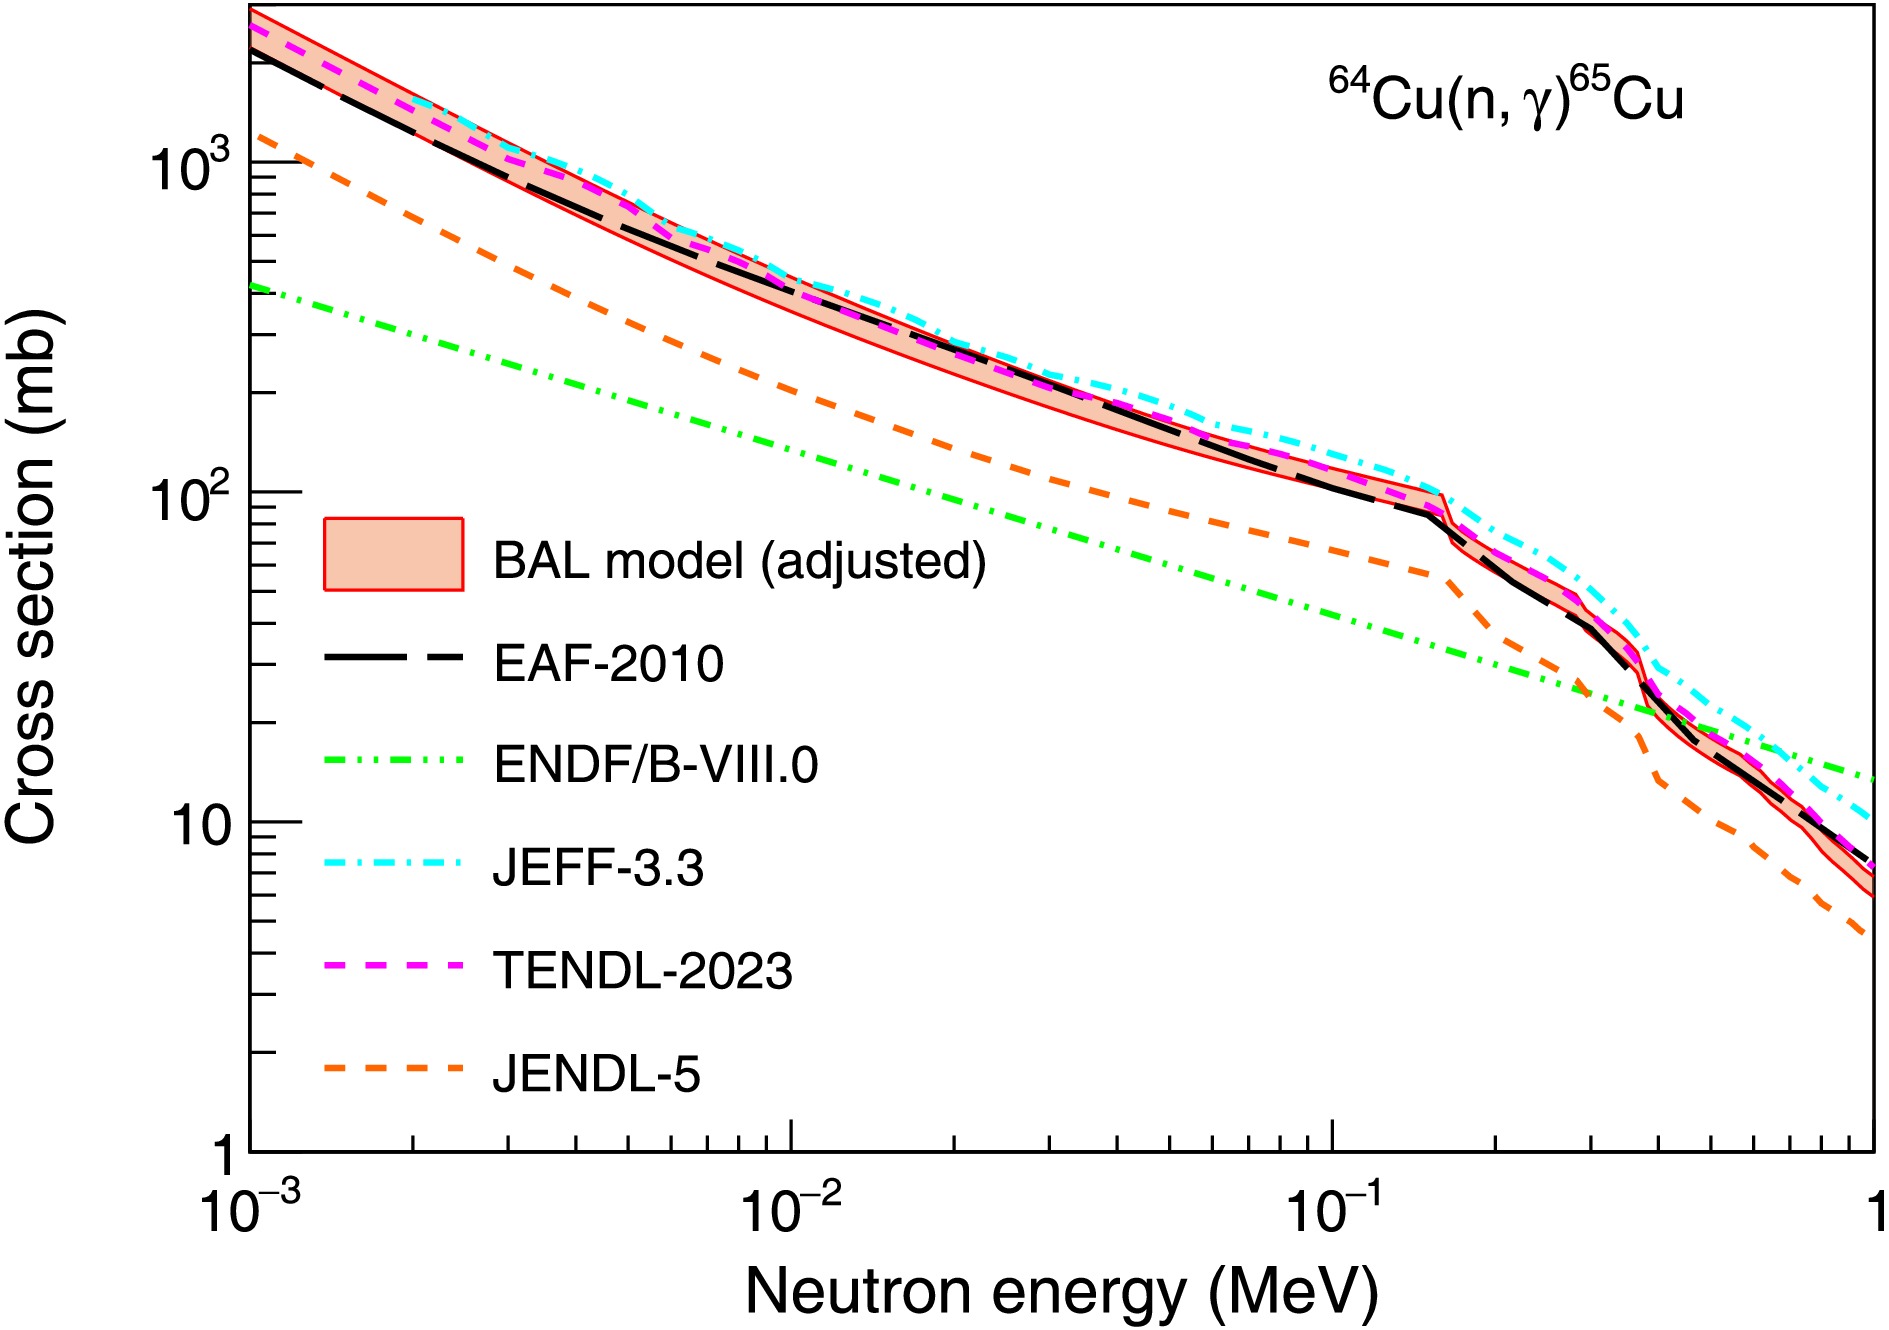
Figure 8. (Color online) Comparison of the
$ ^{64} {\rm{Cu}}$ (n, γ)$ ^{65} {\rm{Cu}}$ cross sections calculated with different γSF models. The red band represent the uncertainty arising from different NLD models. Evaluated data from EAF-2010, ENDF/B-VIII.0, JEFF-3.3, and TENDL-2023 libraries are also shown for comparison. -
According to the
$ ^{64} {\rm{Cu}}$ (n, γ)$ ^{65} {\rm{Cu}}$ data presented above, the corresponding astrophysical reaction rates were calculated. Fig. 9(a) shows the$ ^{64} {\rm{Cu}}$ (n, γ)$ ^{65} {\rm{Cu}}$ reaction rate as a function of astrophysical temperature, together with the data from the JINA REACLIB database (using the recommended label ths8) [58]. In order to facilitate comparison, the ratio between the calculated reaction rates and those from from the JINA REACLIB database [58] are figured, as shown in Fig. 9(b). In our case, the data uncertainty is also induced by the NLD models, which is not constrained in a proper way due to the lack of experimental$ ^{64} {\rm{Cu}}$ (n, γ)$ ^{65} {\rm{Cu}}$ data. The comparison shows that our results agree very well with the JINA REACLIB database at astrophysical temperatures over$ 0.4 \times 10^{9} $ , while they are slightly lower at lower temperatures.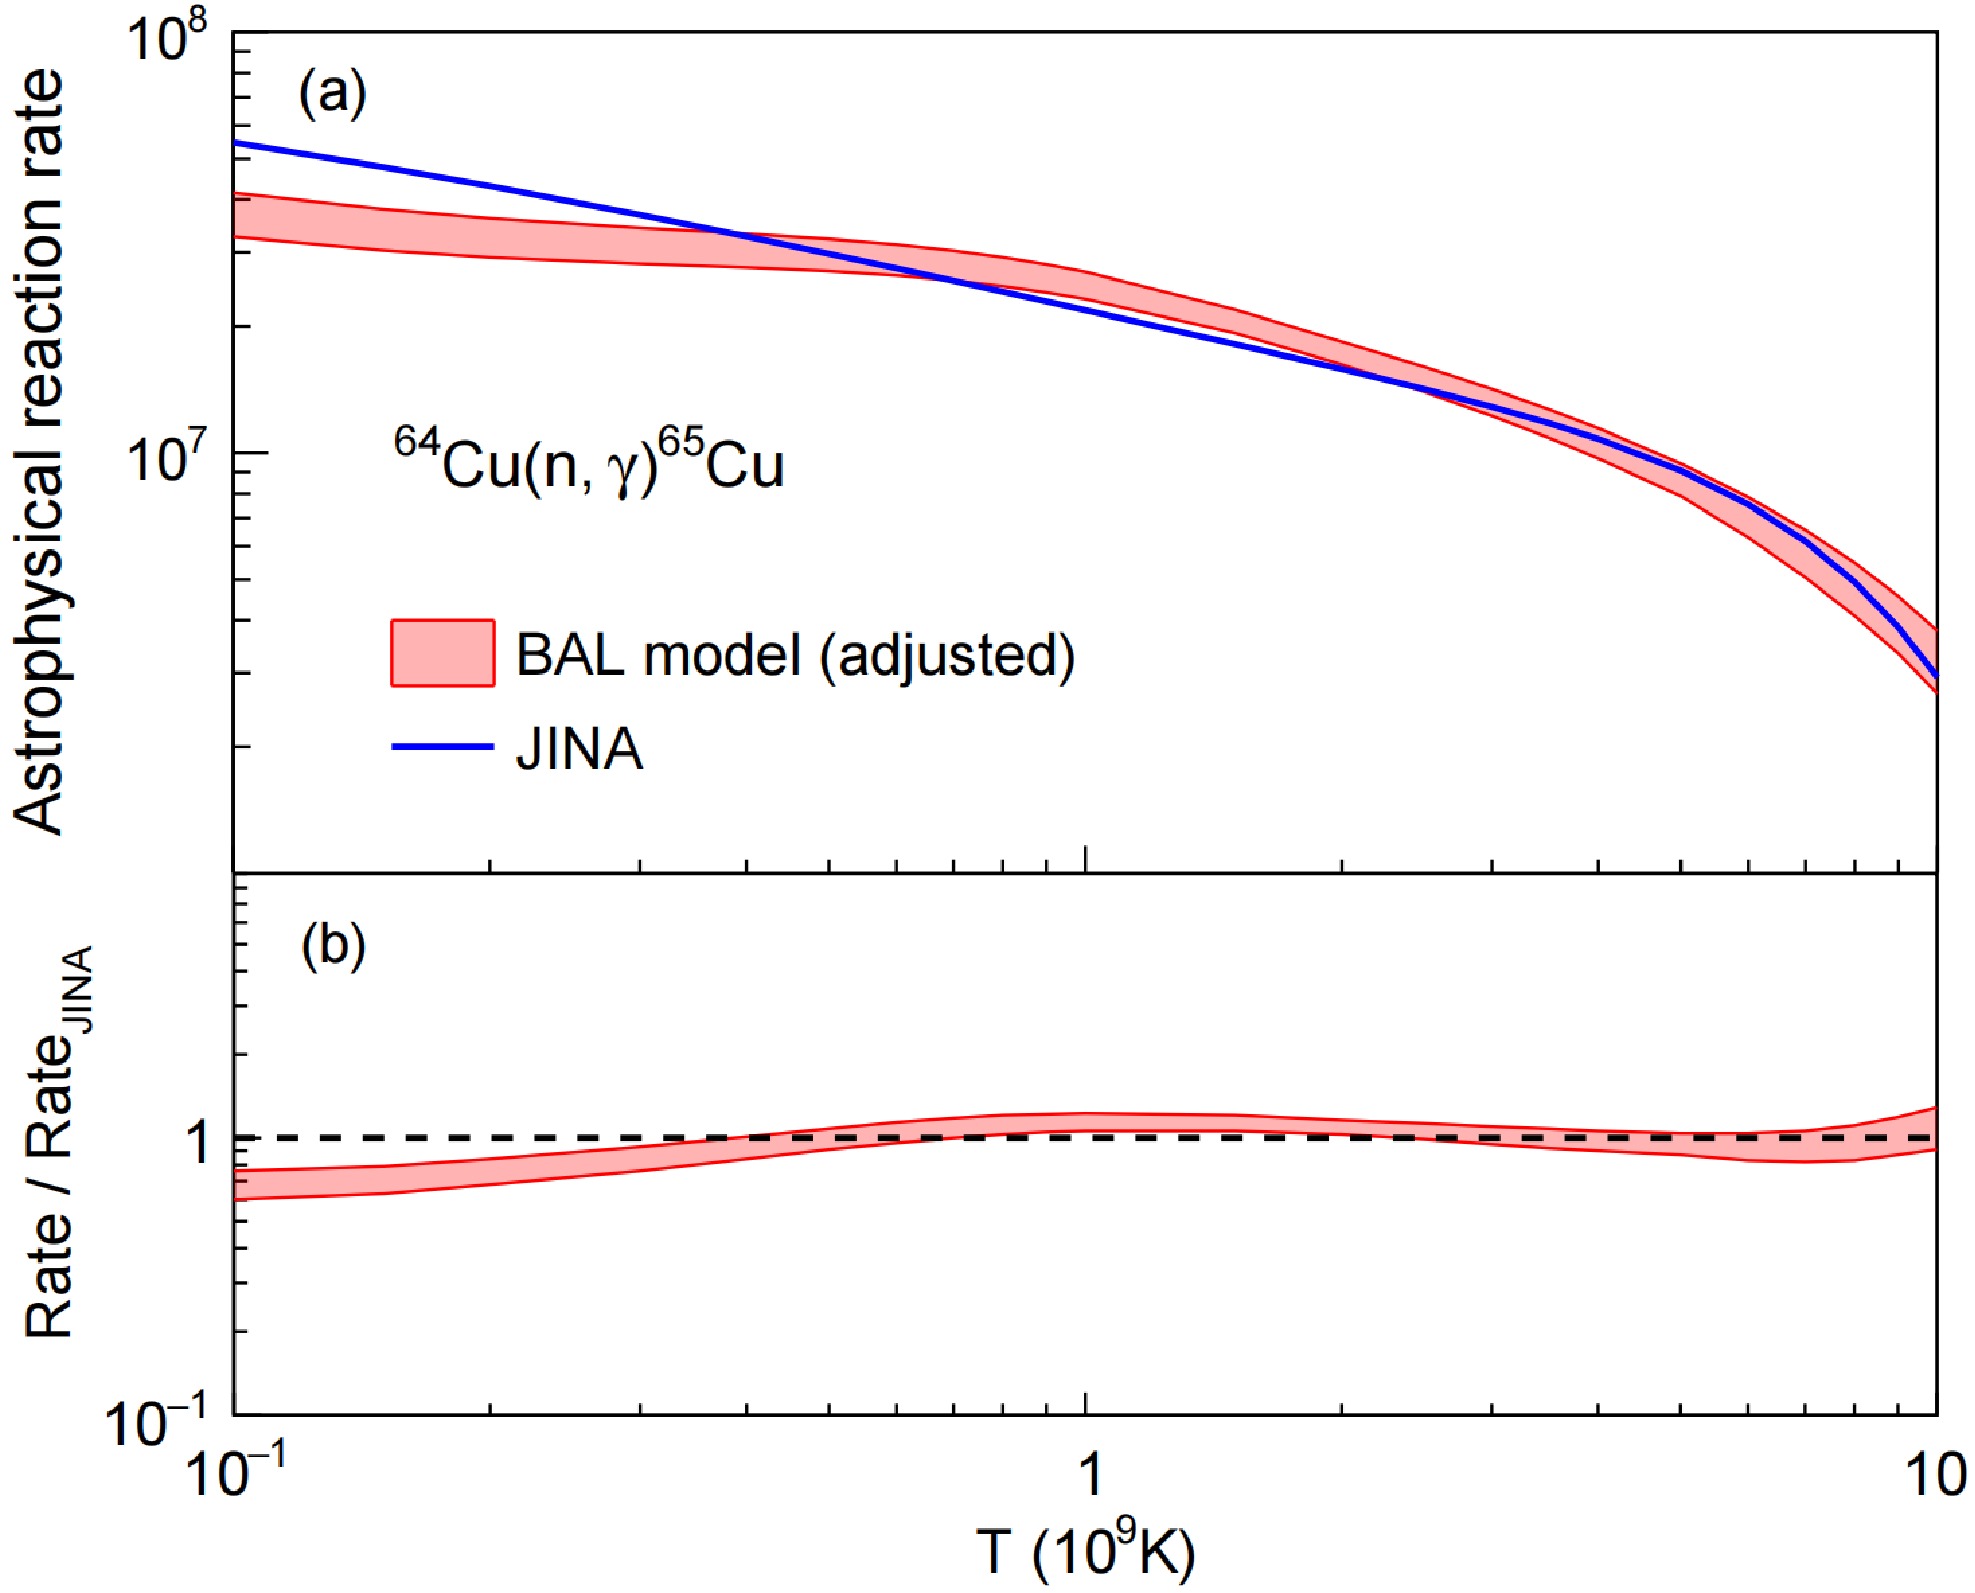
Figure 9. (Color online) Calculated and evaluated astrophysical reaction rates for
$ ^{64} {\rm{Cu}}$ (n, γ)$ ^{65} {\rm{Cu}}$ reaction (a) and the corresponding reaction rate ratio as a function of astrophysical temperature (b). -
In summary, we have demonstrated a precise measurement of
$ ^{65} {\rm{Cu}}$ (γ, n)$ ^{64} {\rm{Cu}}$ reaction cross sections by using a quasi-monoenergetic, energy-tunable γ-ray beam and a high-purity$ ^{65} {\rm{Cu}}$ target. The$ ^{65} {\rm{Cu}}$ (γ, n)$ ^{64} {\rm{Cu}}$ data within the energy range of$ 10.1 \le E_\gamma \le 17.6 $ MeV were obtained with a total uncertainty of less than 4%, which are beneficial for resolving the long-standing discrepancy among existing measurements of this cross section. Furthermore, the$ ^{65} {\rm{Cu}}$ γSF above the$ S_{\text{n}} $ was extracted in a reasonable way, and the radiative neutron capture cross sections and astrophysical reaction rates for short-lived$ ^{64} {\rm{Cu}}$ are calculated and compared with several major evaluated nuclear data libraries. It is found that these calculated$ ^{64} {\rm{Cu}}$ (n, γ)$ ^{65} {\rm{Cu}}$ data exhibit a good agreement with the evaluations.When employing the adjusted BAL model, the calculated
$ ^{64} {\rm{Cu}}$ γSF show an overall consistency with the experimental measurement. However, a significant difference still exists between the default calculations and the experimental ones, particularly around the$ S_{\text{n}} $ . It highlights the need for additional experimental constraints on both the γSF and NLD models in order to reasonably predict (n, γ) cross sections for short-lived isotopes of interest, especially for those nuclei far from stability. -
We would like to thank the SLEGS and SSRF staffs for kind supports on SLEGS γ-ray beamline operation and
$ ^{65} {\rm{Cu}}$ (γ, n)$ ^{64} {\rm{Cu}}$ reaction cross sections measurement.
Photoneutron cross section measurements on 65Cu: Toward understanding (n, γ) cross sections relevant to weak s-process nucleosynthesis
- Received Date: 2026-02-10
- Available Online: 2026-04-01
Abstract: A new measurement of the 65Cu(γ, n)64Cu photoneutron cross section is performed using a quasi-monoenergetic, tunable γ-ray beams produced at the Shanghai Laser Electron Gamma Source (SLEGS). The energy spectrum of the SLEGS γ-ray beams incident on the isotopically enriched 65Cu target was monitored using a BGO detector, while the photoneutron yields are determined with a moderated 3He detection array with high and flat efficiency. Within the energy range of $10.1 \le E_\gamma \le 17.6$ MeV, the measured $\sigma(E_\gamma)$ data have an uncertainty of $\lesssim 4$%, and a pronounced giant-dipole peak is observed at $E_\gamma \simeq 16.65$ MeV with a maximal cross section of $\sigma_{\text{max}} \simeq 137$ mb. These photoneutron data are compared with previous experimental results, and are employed to extract the γ-ray strength function of 65Cu above the neutron threshold. Furthermore, we calculate the radiative neutron capture cross sections and the astrophysical reaction rates for 64Cu, which is a short-lived intermediate nucleus whose reaction rate controls the local abundance distribution in the weak s-process. It is found that the calculated 64Cu(n, γ)65Cu data have an overall agreement with ENDF/B-VIII.0, JEFF-3.3, and TENDL-2023 evaluations and the corresponding astrophysical reaction rates are consistent with those reported in the JINA REACLIB database.


 DownLoad: