


 Abstract
 HTML
HTML Reference
 Related
 PDF
PDF


-
The experimental investigation of the decays of charmed baryons plays a critical role in understanding the complex dynamics of strong and weak interactions involving heavy quarks. The charmed baryon,
$ \Lambda_{c}^{+} $ , was first observed by the Mark II experiment in 1979 [1]. However, after decades of research, the sum of the known$ \Lambda^+_c $ decay branching fractions (BFs) is still limited to approximately 70%, with the remaining decays yet to be measured [2, 3]. The hadronic decay amplitudes of$ \Lambda^+_c $ include both factorizable and nonfactorizable contributions [4], given that its weak decays are not suppressed by color or helicity [5]. These nonfactorizable effects, such as those from W-exchange diagrams, play a crucial role in understanding the decay dynamics. In contrast, these effects are negligible in heavy meson decays [6]. Improving measurements of the BFs of$ \Lambda_{c}^{+} $ decays is essential for better understanding the internal dynamics of charmed baryon decays.Study of the three-body hadronic decays
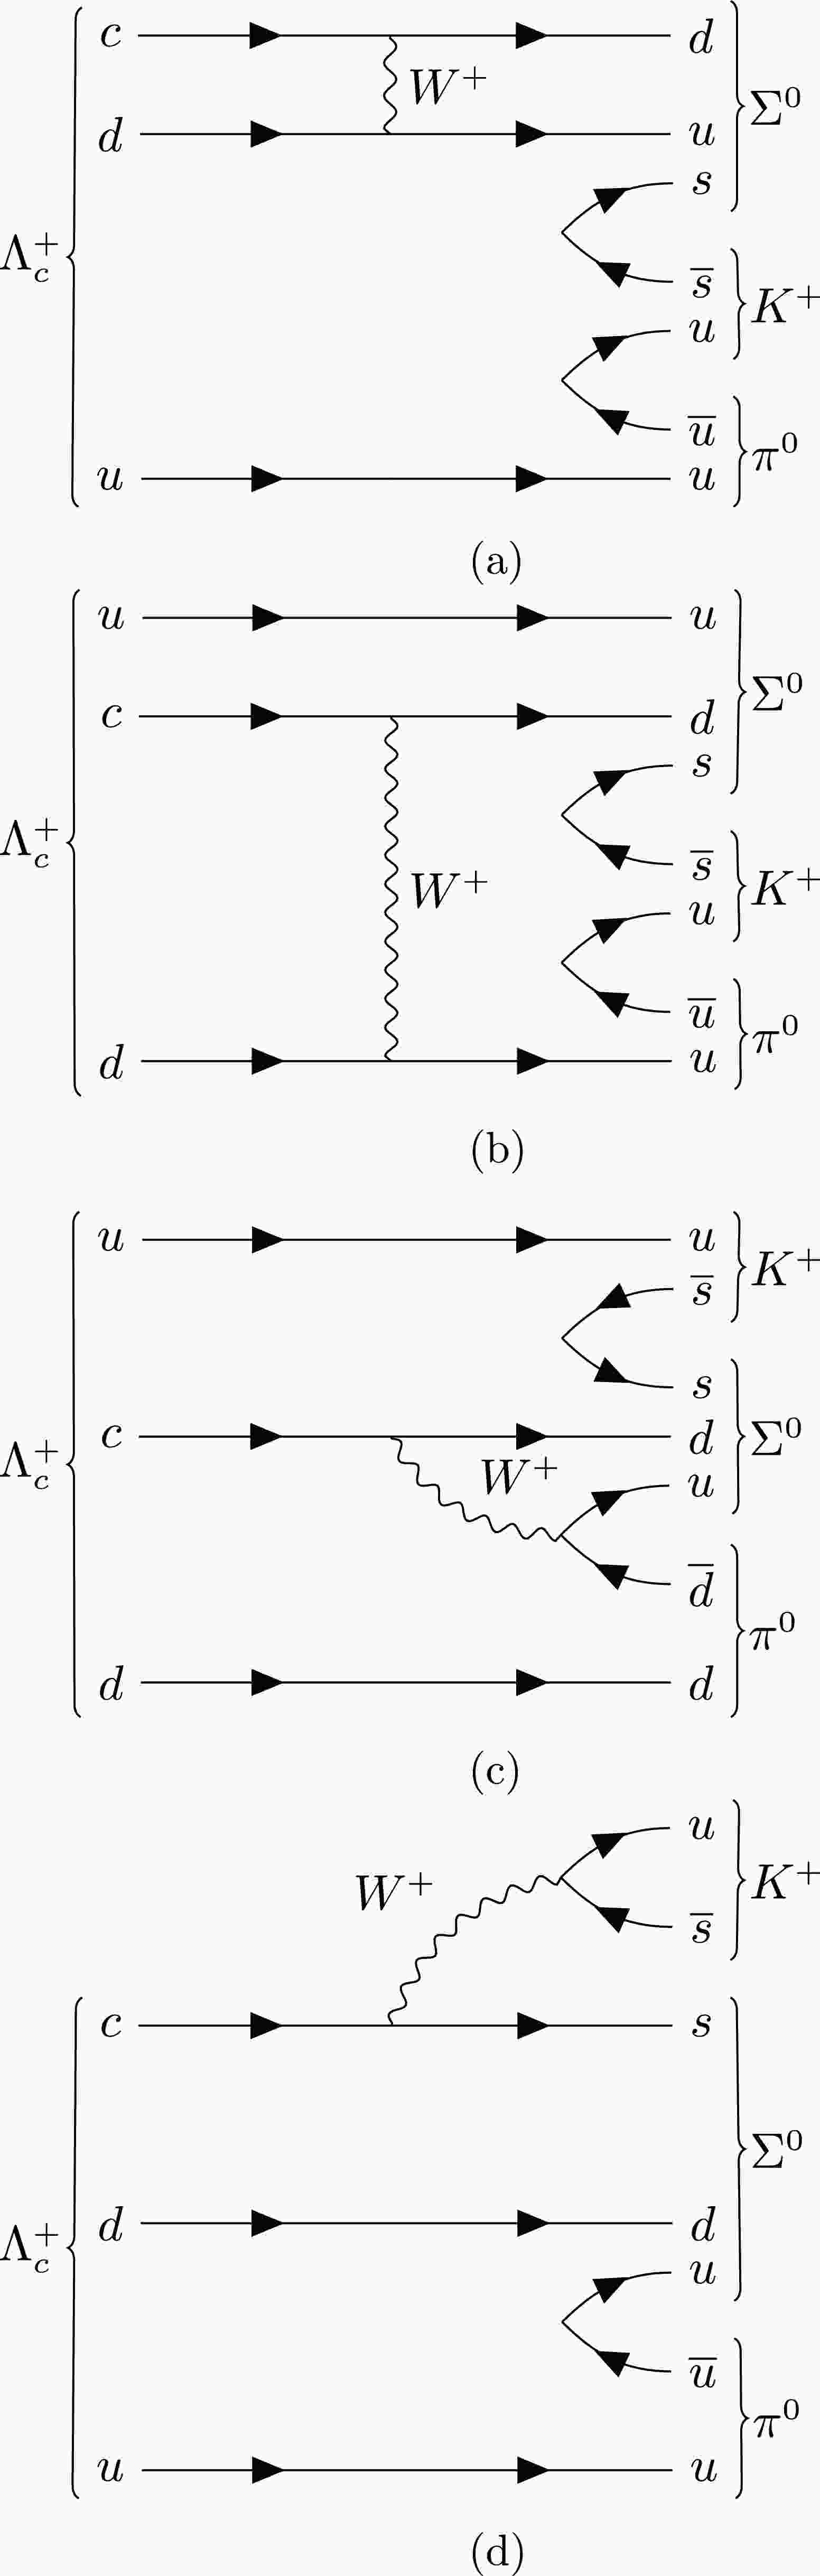
$ \Lambda_{c}^{+} \to B_{n}PP' $ is an important research area;$ B_{n} $ and P($ P' $ ) denote an octet baryon and a pseudoscalar meson, respectively. To date, Cabibbo-suppressed (SCS) hadronic decay$ \Lambda_{c}^{+} \to \Sigma^{0} K^{+}\pi^{0} $ has not been observed. This decay can proceed via the Feynman diagrams shown in Fig. 1. Predictions of the decay BF range from$ 0.8 \times 10^{-3} $ to$ 1.2 \times 10^{-3} $ with the SU(3) flavor symmetry framework [7−9], under the assumption that the$ PP' $ system is in an S-wave state. The most recent prediction, reported in Ref. [9], considers the complete effective Hamiltonian contribution. By contrast, Ref. [10] predicts the BF of$\Lambda^+_c\to \Sigma^0K^+\pi^0$ to be$ (2.1\pm0.6) \times 10^{-3} $ using the statistical isospin model. Experimentally, the BESIII experiment searched for this decay for the first time using a double-tag method and set the upper limit on its BF at the 90% confidence level (C.L.) to be$ 1.8\times 10^{-3} $ [11].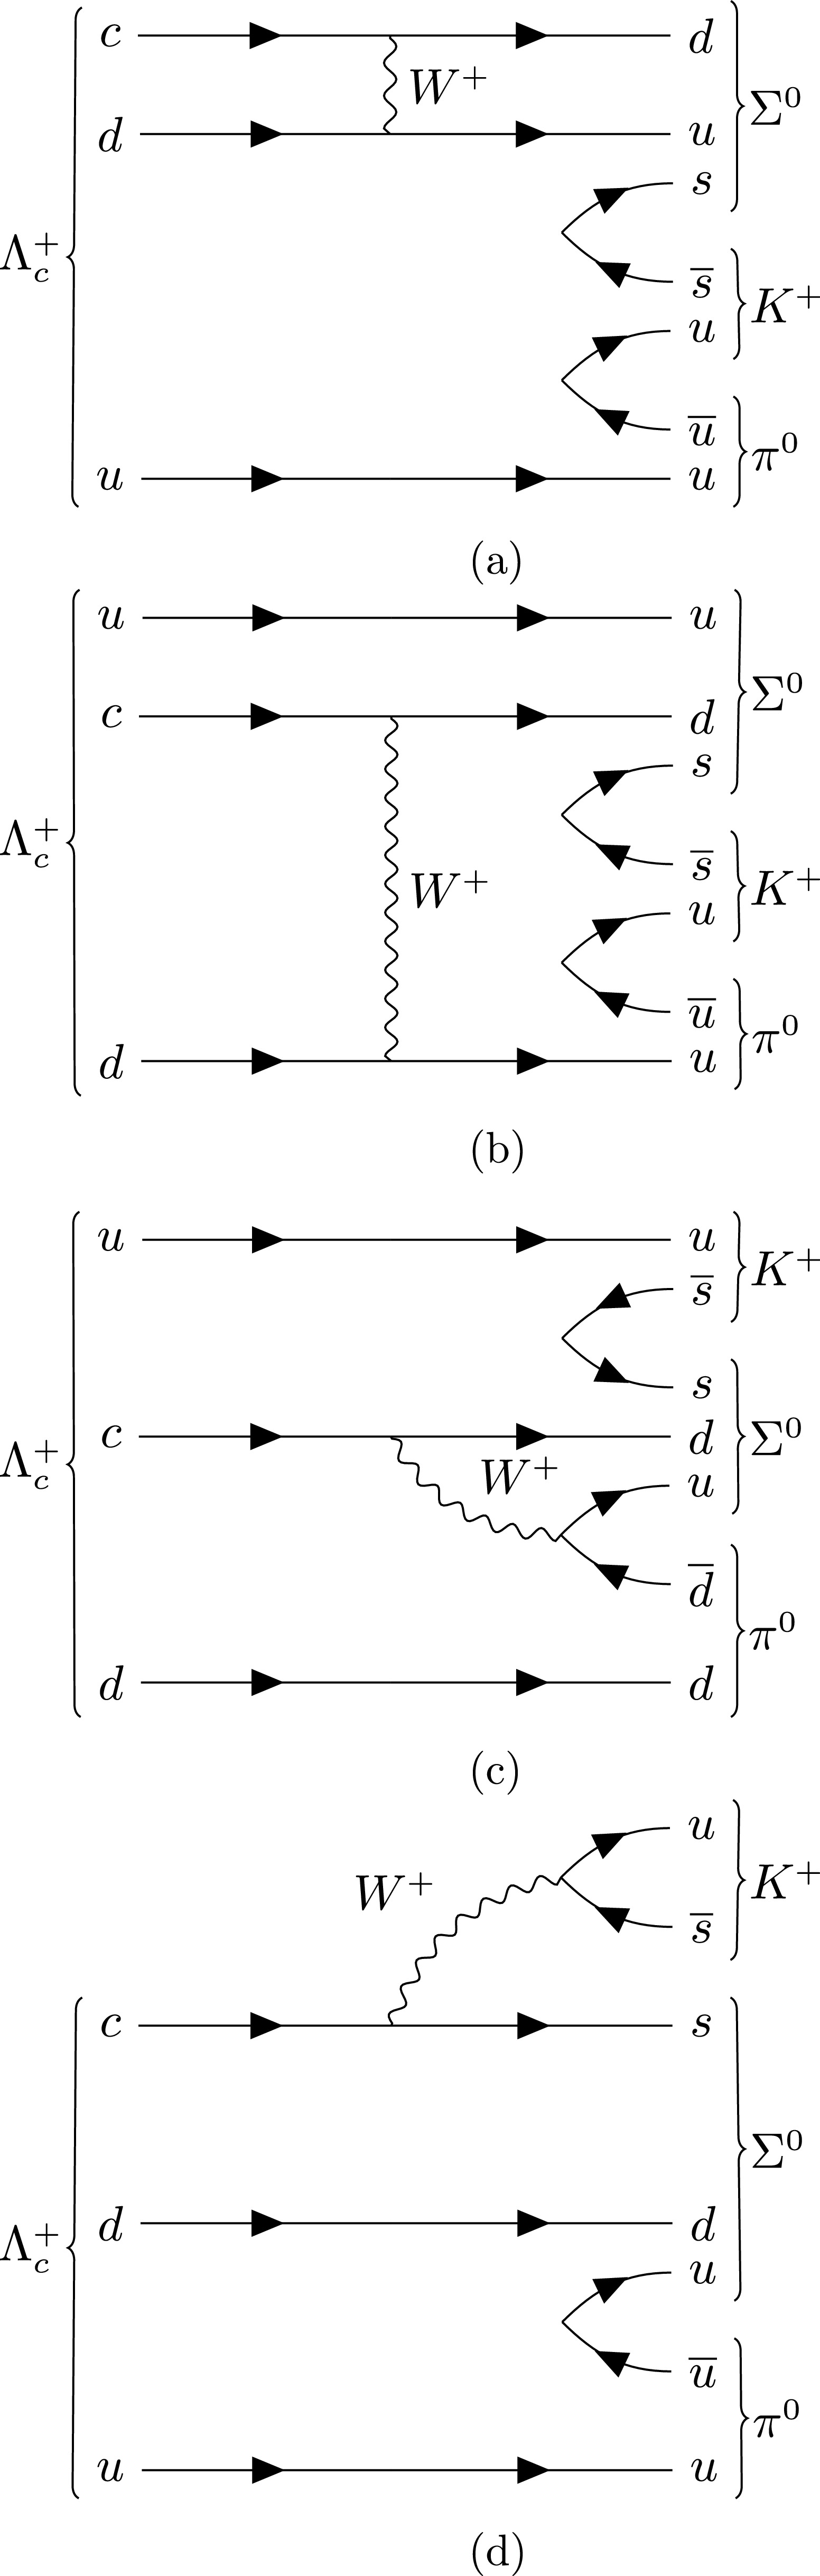
Figure 1. Feynman diagrams of
$ \Lambda_{c}^{+}\to\Sigma^{0} K^{+}\pi^{0} $ : (a) and (b) W-exchange diagrams, (c) internal W-emission diagram, and (d) external W-emission diagram.Currently, there are no theoretical predictions of the four-body hadronic decay
$ \Lambda_c^{+} \to \Sigma^0K^{+}\pi^{+}\pi^{-} $ . The BaBar experiment performed the first search for this decay and reported an upper limit on the BF ratio expressed as$ \dfrac{{\cal{B}} (\Lambda_c^{+} \to \Sigma^0K^{+}\pi^{+}\pi^{-})}{{\cal{B}} (\Lambda_{c}^{+} \to \Sigma^{0}\pi^+)} < 2.0 \times 10^{-2} $ at the 90% C.L. [12].In this study, we searched for hadronic decays
$ \Lambda_{c}^{+} \to \Sigma^{0} K^{+} \pi^{0} $ and$ \Lambda_{c}^{+} \to \Sigma^{0} K^{+} \pi^{+} \pi^{-} $ , with subsequent decays$ \Sigma^{0} \to \gamma \Lambda $ and$ \Lambda\to p \pi^- $ , utilizing 4.5 fb$ ^{-1} $ of$ e^{+}e^{-} $ annihilation data collected at center-of-mass (c.m.) energies ranging from 4599.53 MeV to 4698.82 MeV [13−15]. The results could be employed to test theoretical models and provide important input to them. Throughout this paper, the charge-conjugate state is always implied. -
The BESIII detector [16] records symmetric
$ e^+e^- $ collisions provided by the BEPCII storage ring [17] in the c.m. energy range from 1.84 to 4.95 GeV, with a peak luminosity of$ 1.1\times 10^{33}\;\text{cm}^{-2}\text{s}^{-1} $ achieved at$ \sqrt{s} = $ 3.773 GeV. BESIII has collected large data samples in this energy region [21]. The cylindrical core of the BESIII detector covers 93% of the full solid angle and consists of a helium-based multilayer drift chamber (MDC), a plastic scintillator time-of-flight system (TOF), and a CsI(Tl) electromagnetic calorimeter (EMC), which are all enclosed in a superconducting solenoidal magnet providing a 1.0 T magnetic field. The solenoid is supported by an octagonal flux-return yoke with resistive plate counter muon identification modules interleaved with steel. The charged-particle momentum resolution at$ 1\; {\rm GeV}/c $ is$ 0.5 $ %, and the$ {\rm d}E/{\rm d}x $ resolution is$ 6 $ % for electrons from Bhabha scattering. The EMC measures photon energies with a resolution of$ 2.5 $ % ($ 5 $ %) at$ 1 $ GeV in the barrel (end-cap) region. The time resolution in the TOF barrel region is 68 ps, while that in the end-cap region is 110 ps. The end-cap TOF system was upgraded in 2015 using multigap resistive plate chamber technology. As a result of this upgrading, a time resolution of 60 ps was achieved [18−20]. Approximately 87% of the data used in this analysis benefit from this upgrade.Simulated samples, generated by the GEANT4-based [22] Monte Carlo (MC) package, which includes the geometric description of the BESIII detector and the detector response, are used to determine the detection efficiency and to estimate the backgrounds. The simulations include the beam energy spread and initial state radiation (ISR) in the
$ e^+e^- $ annihilation, modeled with the generator KKMC [23]. For ISR simulation, the Born cross section line shape of$ e^+e^-\to\Lambda_c^{+}\bar{\Lambda}_c^{-} $ measured by BESIII is used [24]. Signal MC samples are generated as$ \Lambda_c^{+}\to\Sigma^0K^{+}\pi^{0} $ ,$ \Lambda_c^{+}\to\Sigma^0\pi^{+}\pi^{0} $ ,$ \Lambda_c^{+}\to\Sigma^0K^{+}\pi^{+}\pi^{-} $ , and$ \Lambda_c^{+}\to\Sigma^0\pi^{+}\pi^{+}\pi^{-} $ , with the$ \bar{\Lambda}_c^{-} $ baryon decays inclusively. The signal decays are produced using the phase space (PHSP) model. To calculate the detection efficiencies, one million signal MC events are generated for each energy point, where$ \Lambda_c^+ $ ($ \bar{\Lambda}_c^- $ ) decays into the signal mode, and$ \bar{\Lambda}_c^- $ ($ \Lambda_c^+ $ ) decays into all possible states. Additionally, to study the peaking background, exclusive MC samples of$ \Lambda_c^{+}\to\Xi^{0} K^{+} $ and$ \Lambda_c^{+}\to\Lambda K^{*+} $ are generated. Inclusive MC samples consist of open-charm states, ISR production of the$ J/\psi $ and$ \psi(3686) $ states, and continuum processes$ e^+e^-\to q\bar{q} (q = u, d, s) $ , used to study backgrounds. The known decay modes of charmed hadrons and charmonium states are modeled with EVTGEN [25, 26] using BFs taken from the Particle Data Group (PDG) [2]; the remaining unknown decays are modeled with LUNDCHARM [27, 28]. Final state radiation from charged final-state particles is incorporated with the PHOTOS package [29]. -
Owing to the limited availability of data statistics, we adopted a single-tag approach to improve signal efficiencies, where only one
$ \Lambda_c^{+} $ is reconstructed in each event, with no requirement on the recoil side. To avoid potential bias and validate the analysis procedure, a blind analysis was adopted to examine pseudodata; in this analysis, for instance, the inclusive MC sample featured an equivalent size to that of the data. The real data were unblinded after fixing the analysis procedure.All charged tracks were required to have a polar angle (θ) range within
$ |{\rm{cos}}\theta|<0.93 $ , where θ is defined with respect to the z axis, which is the symmetry axis of the MDC. For those charged tracks not originating from Λ decays, the distance of closest approach to the interaction point (IP) was set to be less than 10 cm along the z-axis,$ |V_{z}| $ , and less than 1 cm in the transverse plane,$ V_{xy} $ . Particle identification (PID) for charged tracks combines measurements of the energy deposited in the MDC (dE/dx) and the flight time in the TOF to form likelihoods$ {\cal{L}}(h)\; (h=p,K,\pi) $ for each hadron h hypothesis. Tracks are identified as protons when the proton hypothesis has the greatest likelihood ($ {\cal{L}}(p)>{\cal{L}}(K) $ and$ {\cal{L}}(p)>{\cal{L}}(\pi) $ ), while charged kaons and pions are identified by comparing the likelihoods for the kaon and pion hypotheses,$ {\cal{L}}(K)>{\cal{L}}(\pi) $ and$ {\cal{L}}(\pi)>{\cal{L}}(K) $ , respectively.The Λ particles were reconstructed from a pair of oppositely charged proton and pion candidates satisfying
$ |V_{z}|< $ 20 cm. The same PID requirements as mentioned before were imposed to select the proton candidates. Other charged tracks were assigned to be π candidates without any PID requirements. These charged tracks were constrained to originate from the common decay vertex by requiring the$ \chi^{2} $ of the vertex fit to be less than 100, and the decay length was required to be greater than twice the vertex resolution away from the IP. To ensure reconstruction reliability, the Λ candidates were required to have an invariant mass within$ 1.111 < M(p\pi^{-}) < 1.121 $ GeV/$ c^{2} $ , which corresponds to three times the mass resolution around the known Λ mass [2].Photon candidates were identified using isolated showers in the EMC. The deposited energy of each shower was set to be more than 25 MeV in the barrel region (
$ |\cos \theta|< 0.80 $ ) and more than 50 MeV in the end cap region ($ 0.86 <|\cos \theta|< 0.92 $ ). To exclude showers that originate from charged tracks, the angle subtended by the EMC shower and the position of the closest charged track at the EMC were set to be greater than$ 10^\circ $ as measured from the IP. To suppress electronic noise and showers unrelated to the event, the difference between the EMC time and event start time was required to be within [0, 700] ns. The$ \pi^{0} $ candidates were reconstructed from photon pairs with an invariant mass within$ 0.115 < M(\gamma\gamma) < 0.150 $ GeV/$ c^{2} $ . To improve momentum resolution, a one-constraint kinematic fit was utilized to constrain$ M(\gamma\gamma) $ to the known$ \pi^0 $ mass [2]. Only combinations that satisfy$ \chi^{2}<200 $ were retained, and the refined momenta were then employed for subsequent analysis. Then, the$ \Sigma^{0} $ candidates were reconstructed from the$ \Lambda\gamma $ final states, with an invariant mass in the range$ 1.179 < M(\Lambda\gamma) < 1.203 $ GeV/$ c^{2} $ .To reduce the effect from the noise produced by
$ \bar{p} $ in the EMC, the opening angle between photon and antiproton was required to be greater than$ 20^\circ $ , which was obtained by optimizing the figure-of-merit defined as Punzi FOM$ = \dfrac{\varepsilon}{2.5+\sqrt{B}} $ [30]. Here, ε is the signal efficiency and B denotes the background yield from the inclusive MC samples. By utilizing the generic event-type analysis tool TopoAna [31], the study of inclusive MC samples shows that the peaking backgrounds for$ \Lambda_c^+ \to \Sigma^{0}K^+\pi^{0} $ result from$ \Lambda_c^+ \to \Xi^0 K^+ $ and$ \Lambda_c^+ \to \Lambda K^{*+} $ decays. These backgrounds involve one less photon in the final state than the signal process. To suppress these backgrounds, we defined the energy difference$ \Delta E_{p \pi^- K^{+}\gamma\gamma} \equiv E_{p} + E_{ \pi^-} + E_{K^+} + E_{\gamma1} + E_{\gamma2} - E_{\text{beam}} $ , where$ E_{p} $ ,$ E_{ \pi^-} $ ,$ E_{K^+} $ , and$ E_{\gamma1/2} $ are the energies of a proton, pion, kaon, and two photons (coming from$ \pi^0 $ ), respectively, while$ E_{\text{beam}} $ represents the beam energy. Candidate events for$ \Lambda^+_c\to \Sigma^0K^+\pi^0 $ were required to satisfy$ -160 < \Delta E_{p \pi^- K^{+}\gamma\gamma} <-30 $ MeV, while candidate events for$ \Lambda^+_c\to \Sigma^0K^+\pi^+\pi^- $ were required to satisfy$ \Delta E_{p \pi^- K^{+} \pi^+ \pi^-} <-40 $ MeV. The distributions of$ \Delta E_{p \pi^- K^{+}\gamma\gamma} (\Delta E_{p \pi^- K^{+} \pi^+ \pi^-}) $ are shown in Fig. 2.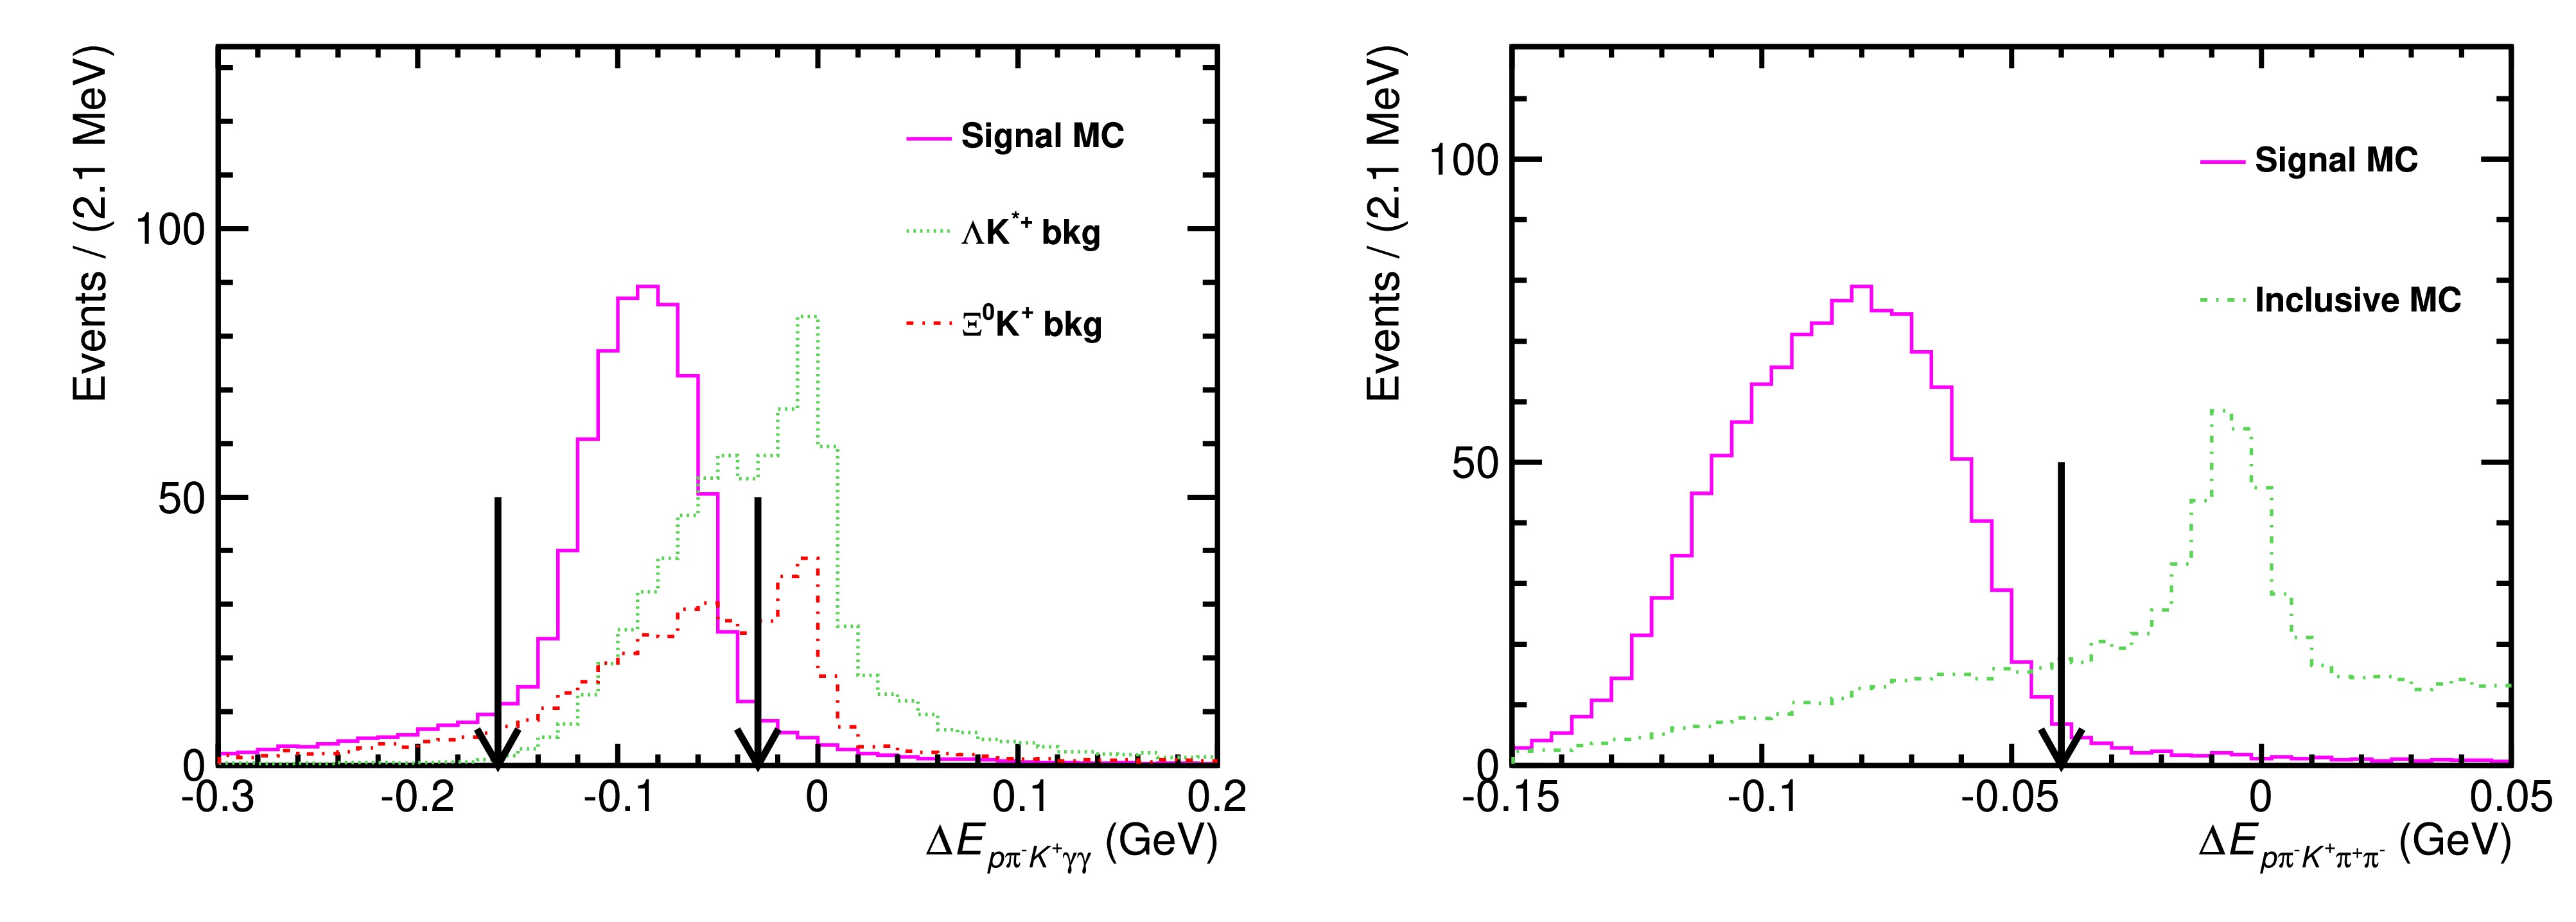
Figure 2. (color online) Distributions of
$ \Delta E_{p \pi^- K^{+}\gamma\gamma} (\Delta E_{p \pi^- K^{+} \pi^+ \pi^-}) $ for$ \Lambda_c^+ \to \Sigma^{0}K^+\pi^{0} $ ($ \Lambda_c^+ \to \Sigma^{0}K^+\pi^{+}\pi^{-} $ ). The histograms of the signal MC are normalized to make the distribution more intuitive when compared to the inclusive MC.After applying the above requirements, the
$ \Sigma^{0} $ ,$ K^+ $ , and$ \pi^0(\pi^{\pm} $ ) candidates were combined to reconstruct$ \Lambda_c^{+} $ . Kinematic variables, including energy difference$ \Delta E $ , defined as$ \Delta E \equiv E_{\text{rec}-\Lambda_c^{+}} - E_{\text{beam}} $ , and the beam-constrained mass$ M_{\text{BC}} $ , defined as$ M_{\text{BC}} \equiv \sqrt{E^2_{\text{beam}}/^{}c^4 - {|\vec{p}|}^2/^{}c^2} $ , were utilized to identify$ \Lambda_c^{+} $ candidates. Here,$ E_{\text{rec}-\Lambda_c^{+}} $ and$ \vec{p} $ are the energy and momentum of a$ \Lambda_c^{+} $ candidate, respectively. If there were multiple combinations satisfying these requirements in an event, the one with the minimum$ |\Delta E| $ was retained. Candidate events for$ \Lambda_{c}^{+}\to\Sigma^{0} K^{+}\pi^{0} $ and$ \Lambda^+_c\to \Sigma^0K^+\pi^+\pi^- $ were required to satisfy$ \Delta E \in [-27,\; 6] $ MeV and$ \Delta E \in [-21,\; 7] $ MeV, respectively, with the ranges optimized according to the Punzi FOM. The signal efficiency and background yield were obtained within the$ M_{\rm BC} $ signal region given by$ M_{\text{BC}} \in $ [2.282, 2.291] GeV/$ c^2 $ . To obtain a pure signal, we employed the truth-match method [32]. This method involves comparing two photons in$ \pi^{0} $ , one photon in$ \Sigma^{0} $ , and the charged tracks$ K^{\pm} $ and$ \pi^{\pm} $ with their corresponding truth information. The angle$ \theta_{\text{truth}} $ is defined as the opening angle between each reconstructed track (showers) and its corresponding simulated track (showers). The signal shape was derived from events where$ \theta_{\text{truth}} $ was less than$ 20^\circ $ for all tracks (showers).Table 1 lists the signal efficiencies obtained at different energy points. Figures 3 and 5 show the
$ M_{\text{BC}} $ distributions of the simultaneous fit performed between different energy points for each of the signal decays; no evident$ \Lambda_c^+ $ signals were observed. A likelihood scan method was employed after incorporating the systematic uncertainties, as discussed in the next section, to estimate the upper limits.$\sqrt{s} / \,\text{MeV}$ 

$ \varepsilon_{\Lambda_c^+ \to \Sigma^{0}K^+\pi^{0}} $ 

$ \varepsilon_{\Lambda_c^+ \to \Sigma^{0}K^+ \pi^+ \pi^-} $ 

4599.53 5.17 $ \pm $ 0.04

3.44 $ \pm $ 0.03

4611.86 4.89 $ \pm $ 0.03

3.10 $ \pm $ 0.03

4628.00 4.76 $ \pm $ 0.03

3.14 $ \pm $ 0.03

4640.91 4.76 $ \pm $ 0.03

3.21 $ \pm $ 0.03

4661.24 4.71 $ \pm $ 0.03

3.32 $ \pm $ 0.03

4681.92 4.68 $ \pm $ 0.03

3.43 $ \pm $ 0.03

4698.82 4.65 $ \pm $ 0.03

3.44 $ \pm $ 0.03

Table 1. Single-tag efficiencies (%) for
$ \Lambda_c^+ \to \Sigma^{0}K^+\pi^{0} $ and$ \Lambda_c^+ \to \Sigma^{0}K^+ \pi^+ \pi^- $ at different energy points; the uncertainties are statistical only.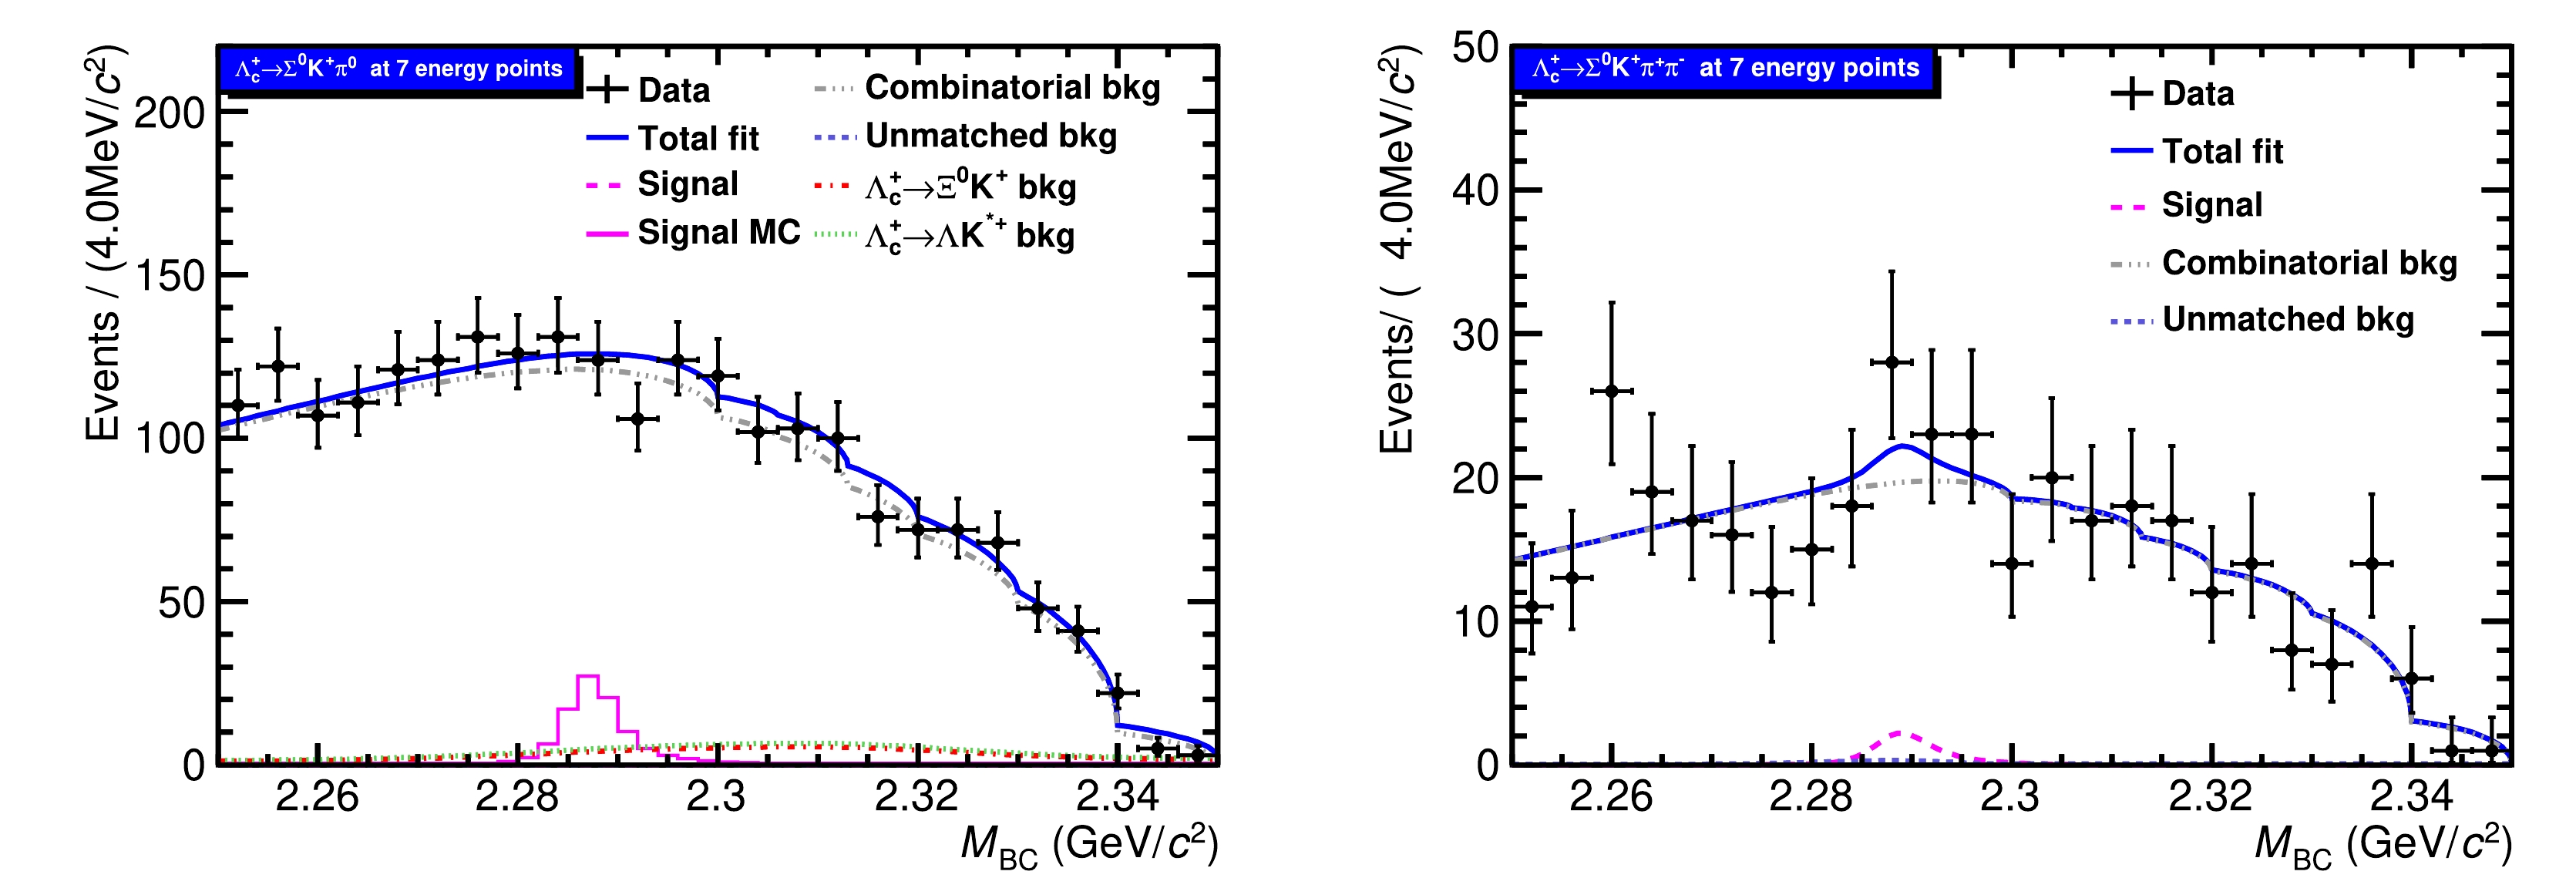
Figure 3. (color online) Fit to the
$ M_{\rm BC} $ distributions of$ \Lambda_c^+ \to \Sigma^{0}K^+\pi^{0} $ (left) and$ \Lambda_c^+ \to \Sigma^{0}K^+ \pi^+ \pi^- $ (right) of the combined data. For$ \Lambda_c^+ \to \Sigma^{0}K^+\pi^{0} $ , the violet histograms represent the signal MC samples normalized with a product BF of 1.2$ \times 10^{-3} $ [7]. The ARGUS function includes seven sub-ARGUS functions. The black point with the error bar represents data, the blue solid line represents the total fit function, the gray dashed line represents the combinatorial background, the violet dash line represents the signal function, the navy blue dashed line represents the unmatched component, the cyan dashed line represents the background shape extracted from$ \Lambda_c^{+}\to\Lambda K^{*+} $ MC samples, and the red dashed line represents the background shape extracted from$ \Lambda_c^{+}\to\Xi^{0} K^{+} $ MC samples.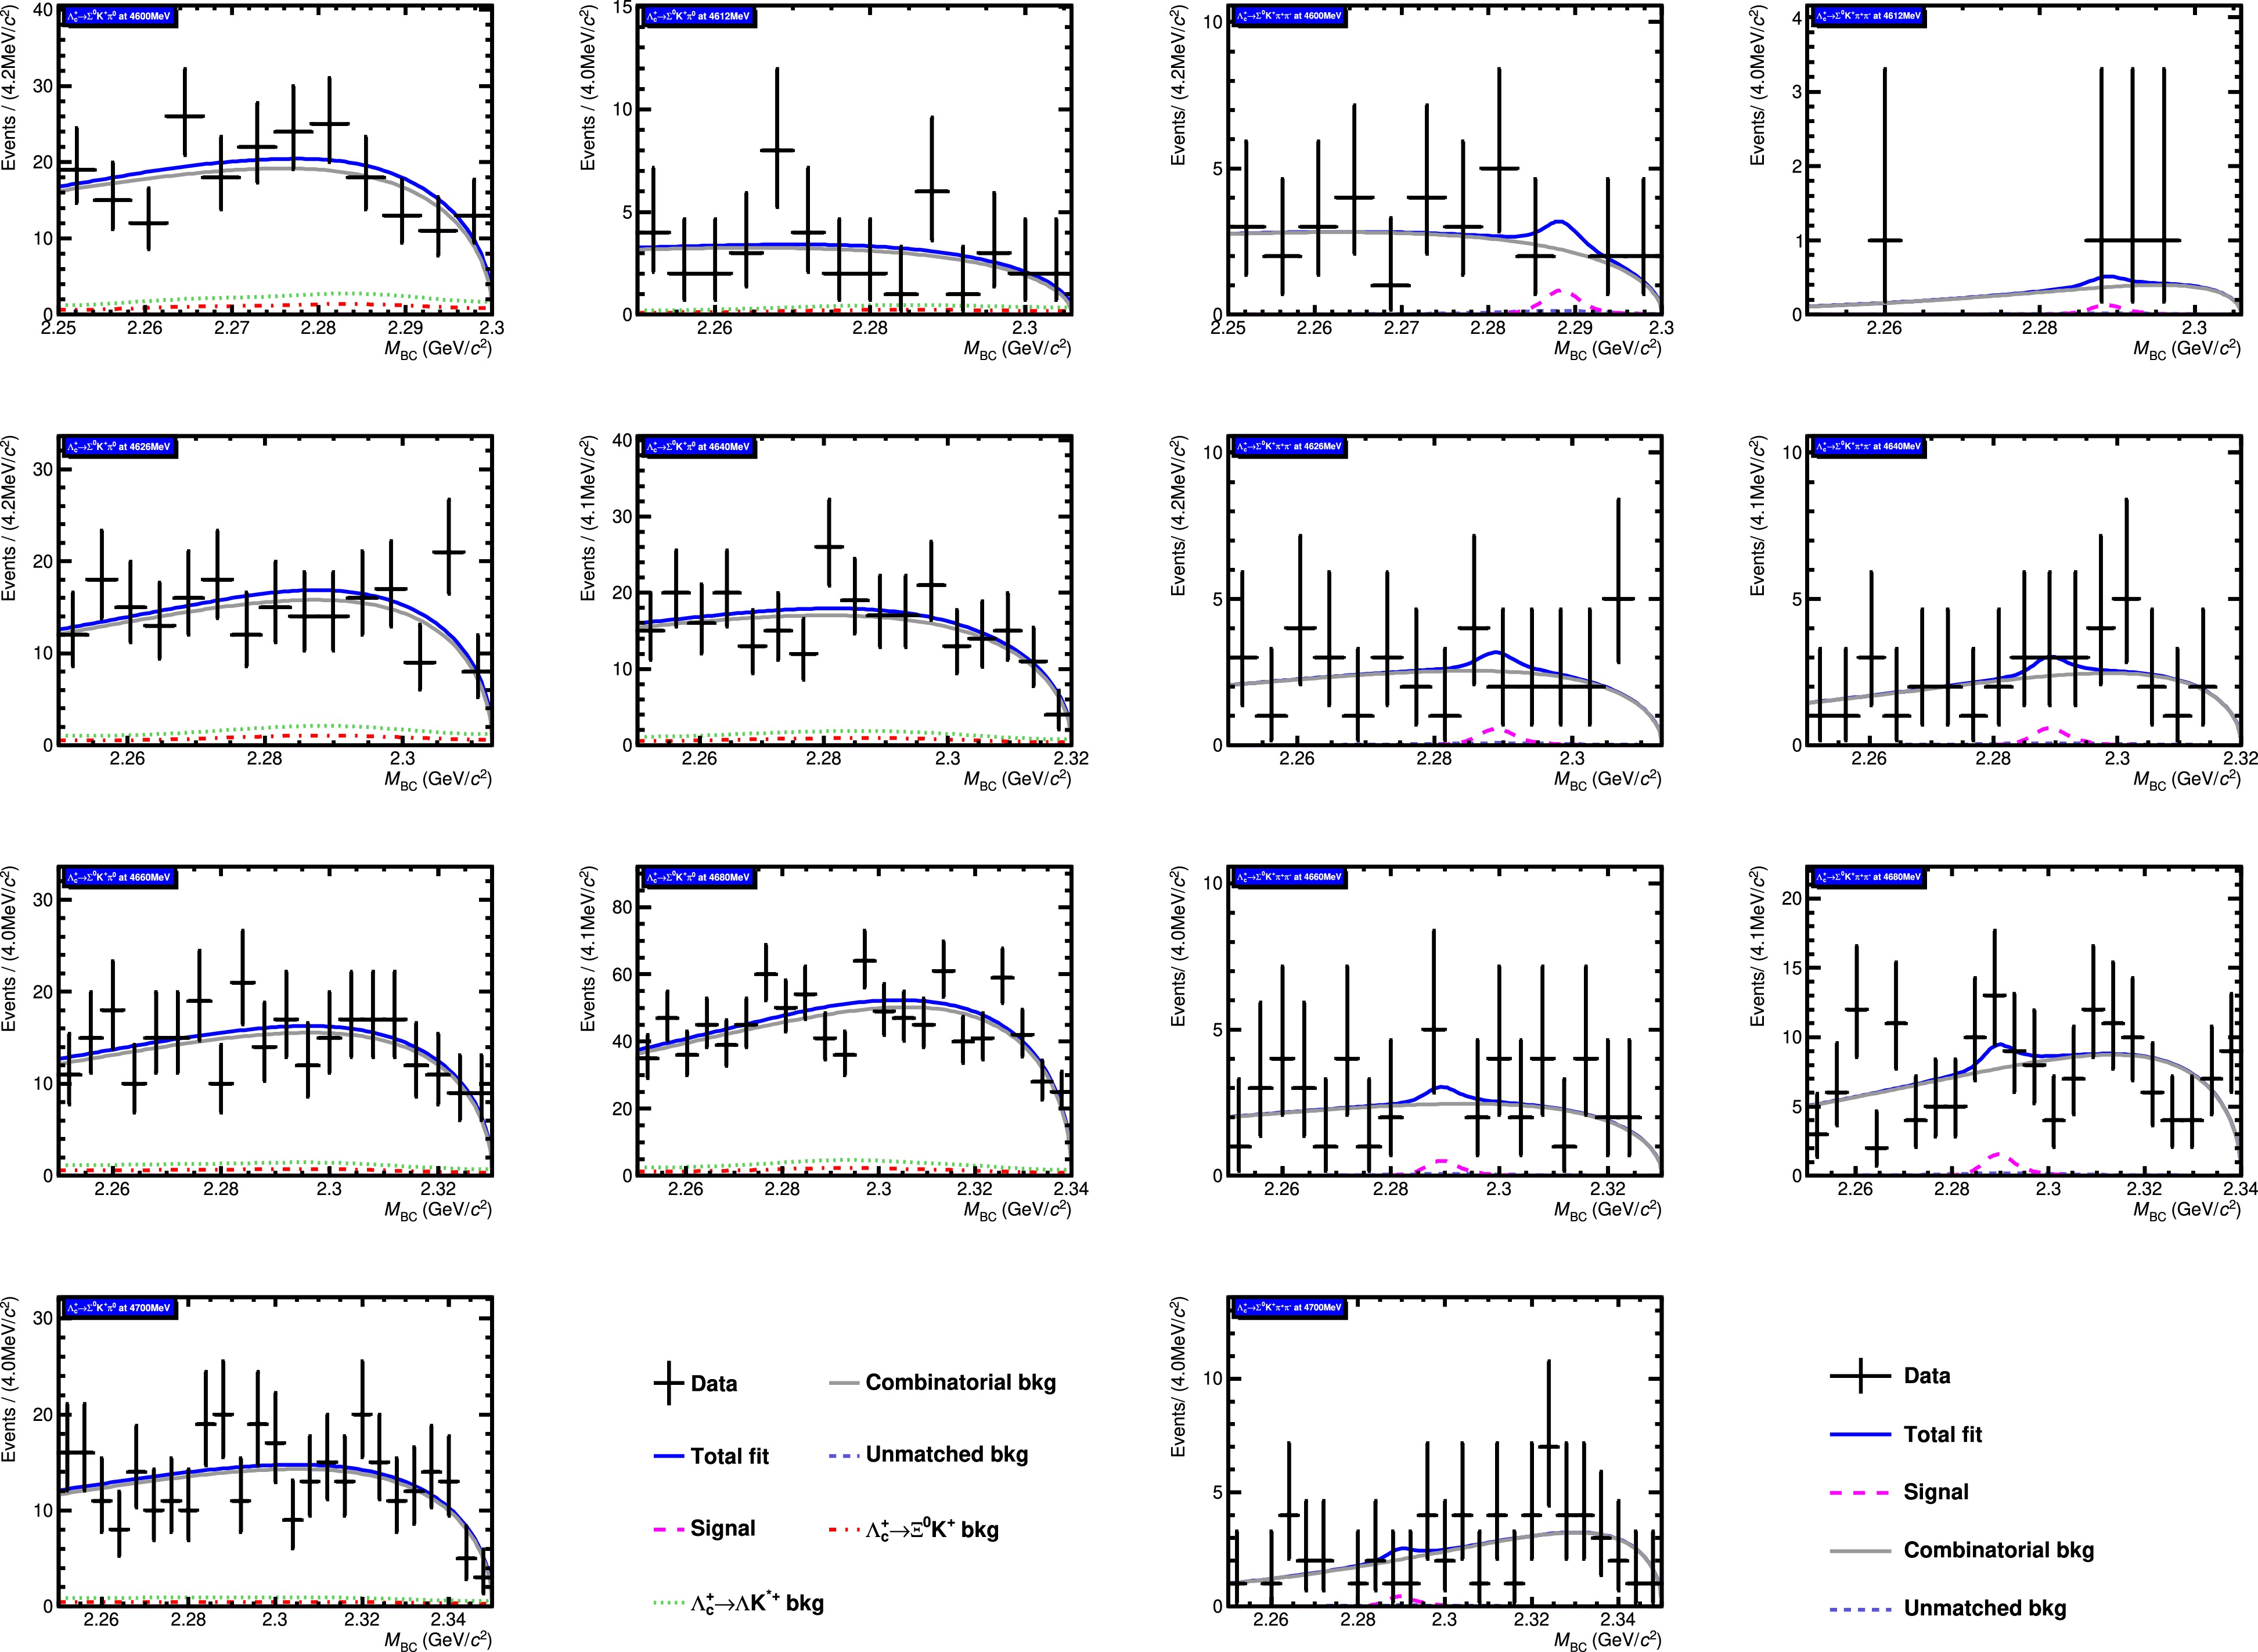
Figure 5. (color online) Fit to the
$ M_{\rm BC} $ distributions of$ \Lambda_c^+ \to \Sigma^{0}K^+\pi^{0} $ (left) and$ \Lambda_c^+ \to \Sigma^{0}K^+ \pi^+ \pi^- $ (right) at different energy points. The black point with the error bar represents data, the blue solid line represents the total fit function, the gray dashed line represents the combinatorial background, the violet dash line represents the signal function, the navy blue dashed line represents the unmatched component, the cyan dashed line represents the background shape extracted from$ \Lambda_c^{+}\to\Lambda K^{*+} $ MC samples, and red dashed line represents the background shape extracted from$ \Lambda_c^{+}\to\Xi^{0} K^{+} $ MC samples.The absolute BF of the signal decay is determined by
$ \begin{aligned} {\cal{B}}^{\rm{sig}} \equiv \frac{N^{\rm{sig}}}{2 \cdot N_{\Lambda_c^+\bar{\Lambda}_c^-}\cdot {\cal{B}}^{\text{inter}} \cdot \varepsilon^{\text{sig}}}, \end{aligned} $

(1) where
$ N_{\Lambda_c^{+}\bar{\Lambda}_c^{-}} $ is the total number of$ \Lambda_c^{+}\bar{\Lambda}_c^{-} $ pairs,$ \varepsilon^{\text{sig}} $ is the single-tag efficiency, and$ {\cal{B}}^{\text{inter}} $ is the product BFs of the intermediate states$ \Sigma^0 $ , Λ, and$ \pi^0 $ .Given that there were different distributions of background and signal events at each energy point, a simultaneous fit was performed on individual
$ M_{\rm BC} $ distributions. The BF of each signal decay was constrained to be the same value through a maximum likelihood simultaneous fit to individual$ M_{\rm BC} $ distributions across seven energy points. In the fit, the signal shapes were derived from MC simulations convolved with Gaussian functions to account for the potential difference between data and MC simulations. This is because of the imperfect modeling in MC simulations and the beam-energy spread. The control samples of$ \Lambda_c^{+}\to\Sigma^0\pi^{+}\pi^{0} $ and$ \Lambda_c^{+}\to\Sigma^0\pi^{+}\pi^{+}\pi^{-} $ were used to evaluate the resolution. These samples have similar topologies as those of our signal decays. The combinatorial backgrounds are well described by the ARGUS function [33], with the c.m. energy dependent endpoint fixed at$ E_{\text{beam}} $ . The remaining peaking backgrounds,$ \Lambda_c^{+}\to\Xi^{0} K^{+} $ and$ \Lambda_c^{+}\to\Lambda K^{*+} $ for$ \Lambda_c^+ \to \Sigma^{0}K^+\pi^{0} $ , were described using exclusive MC simulations with yields determined by the known BFs and the simulated misidentification rates listed in Table 2. For$ \Lambda_c^{+}\to\Sigma^0K^{+}\pi^{+}\pi^{-} $ , there was no significant peaking background. Unmatched events, studied through the signal MC samples, exhibited a non-flat distribution. In the simultaneous fit, the yields associated with the unmatched events were determined by evaluating the ratio between the matched signal yields and the unmatched background yields, with the ratio obtained from MC simulation.$\sqrt{s} / \text{MeV}$ 

$ \varepsilon_{\Lambda_c^+\to\Xi^0K^+} $ 

$ \varepsilon_{\Lambda_c^+\to\Lambda K^{*+}} $ 

4599.53 2.34 $ \pm $ 0.03

2.63 $ \pm $ 0.02

4611.86 1.97 $ \pm $ 0.03

2.59 $ \pm $ 0.02

4628.00 2.10 $ \pm $ 0.03

2.58 $ \pm $ 0.02

4640.91 2.06 $ \pm $ 0.03

2.58 $ \pm $ 0.02

4661.24 2.10 $ \pm $ 0.03

2.57 $ \pm $ 0.02

4681.92 2.14 $ \pm $ 0.03

2.56 $ \pm $ 0.02

4698.82 2.25 $ \pm $ 0.03

2.46 $ \pm $ 0.02

Table 2. Contamination rates (%) after including the BFs of the secondary decays at each energy point; the uncertainties are statistical only.
-
The systematic uncertainties in the determinations of the upper limits on the BFs are classified into two categories: additive and multiplicative terms.
The additive terms include the uncertainties introduced by the chosen signal and background shapes. The uncertainty associated with the signal shape was estimated by changing the parameters of the convolved Gaussian functions within their uncertainties. The largest deviation of the individual changes was considered as the uncertainty. The background shape of the non-peaking components was changed from the ARGUS function to be the shape extracted from the inclusive MC samples. The uncertainty due to the fixed contribution of the peaking background yields in the fit was investigated by varying the fixed yields within
$ \pm 1 \sigma $ of the PDG BFs of individual background sources. Among all the above terms, the case yielding the largest upper limit was chosen for further analysis. The additive uncertainty for$ \Lambda_c^+ \to \Sigma^{0}K^+\pi^+\pi^- $ is dominated by the signal shape uncertainty, while the$ \Lambda_c^+ \to \Sigma^{0}K^+\pi^{0} $ is mainly influenced by the background shape uncertainty.The sources of multiplicative systematic uncertainties include tracking and PID of charged particles,
$ \pi^0 $ reconstruction, Λ reconstruction, photon reconstruction,$ \Delta E $ requirement,$ {\cal{B}}^{\text{inter}} $ (Quoted BF), MC model, truth matching, MC statistics,$ N_{\Lambda_c^+\bar\Lambda_c^-} $ ,$ \Delta E_{\Lambda} $ ($ \Delta E_{ p \pi^- K^{+}\gamma\gamma} $ and$ \Delta E_{p \pi^- K^{+} \pi^+ \pi^-} $ ), and$ \theta_{\bar{p}\gamma} $ requirement. The total multiplicative systematic uncertainties are summarized in Table 3 and discussed in detail below.Source $ \Lambda_c^+ \to \Sigma^{0}K^+\pi^{0} $ 

$ \Lambda_c^+ \to \Sigma^{0}K^+ \pi^+ \pi^- $ 

Tracking 1.0 3.0 PID 1.0 3.0 $ \pi^0 $ reconstruction

3.1 - Λ reconstruction 2.5 2.5 Photon detection 0.5 0.5 $ \Delta E $ requirement

2.0 3.7 MC model 5.5 18.5 $ {\cal{B}}^{\text{inter}} $ 

0.8 0.8 Truth matching 5.5 4.9 $ N_{\Lambda_c^+\bar\Lambda_c^-} $ 

0.9 0.9 MC statistics 0.5 0.3 $ \Delta E_{\Lambda} $ requirement

0.4 0.3 $ \theta_{\bar{p}\gamma} $ requirement

0.1 - Total 9.2 20.1 Table 3. Multiplicative systematic uncertainties in unit of % for the BF measurement.
$ \bf (a) $ Tracking and PID: The uncertainties of either PID or tracking of the charged tracks were set to be 1.0$ $ % per track according to studies of the control sample of$ e^+e^-\to K^+K^-\pi^+\pi^- $ [34].$ \bf (b) $ $ {\pi^{0}} $ reconstruction: The$ \pi^0 $ reconstruction efficiency was studied with the control samples of$ \psi(3686)\to J/\psi\pi^0\pi^0 $ and$ e^+e^-\to \omega\pi^{0} $ . The associated systematic uncertainty was assigned to be 3.1$ $ % for each$ \pi^{0} $ .$ \bf (c) $ Λ reconstruction: The systematic uncertainty of Λ reconstruction was assigned to be 2.5% according to the study of$ \Lambda_c^+\to\Lambda\pi^+ $ reported in Ref. [35], which includes the systematics associated with reconstructing the proton and pion daughter particles.$ \bf (d) $ Photon reconstruction: The systematic uncertainty due to the photon reconstruction was estimated to be 0.5% for photons by analyzing the ISR process$ e^+e^-\to \gamma\mu^+\mu^- $ .$ \bf (e) $ $ \Delta E $ requirements: Potential differences in the$ \Delta E $ distributions between data and MC simulation were studied with the control samples of$ \Lambda_c^+ \to \Sigma^{0}\pi^+\pi^{0} $ and$ \Lambda_c^+ \to \Sigma^{0}\pi^+\pi^+\pi^- $ . The differences between the nominal and alternative acceptance efficiencies, namely 2.0% and 3.7%, were considered as the systematic uncertainties for$ \Lambda_c^+ \to \Sigma^{0}K^+\pi^{0} $ and$ \Lambda_c^+ \to \Sigma^{0}K^+\pi^+\pi^- $ , respectively.$ \bf (f) $ MC model: The systematic uncertainties associated with the MC model were evaluated with alternative signal MC samples for$ \Lambda_c^+ \to \Sigma^{0}K^+\pi^{0} $ and$ \Lambda_c^+ \to \Sigma^{0}K^+\pi^+\pi^- $ . These samples were generated as$ \Lambda_c^+\to \Lambda(1405) K^+ $ , with$ \Lambda(1405)\to \Sigma^{0}\pi^0 $ via the PHSP model, and$ \Lambda_c^+\to\Sigma^0 \pi^+ K^{*} $ , with$ K^{*}\to K^+ \pi^- $ also simulated in the PHSP model. The differences between the efficiencies of these alternative models and the nominal model were considered as the systematic uncertainties:$ 5.5 $ % for$ \Lambda_c^+ \to \Sigma^{0}K^+\pi^{0} $ and$ 18.5 $ % for$ \Lambda_c^+ \to \Sigma^{0}K^+\pi^+\pi^- $ , respectively.$ \bf (g) $ $ {\cal{B}}^{\text{inter}} $ : The BFs of$ \Sigma^{0}\to\Lambda\gamma,\; \Lambda\to p \pi^- \; \text{and}\; \pi^{0}\to\gamma\gamma $ were extracted from results reported by the PDG [2]. The uncertainties of these known BFs add up to a total uncertainty of 0.8%.$ \bf (h) $ Truth matching: To estimate the uncertainty caused by the angle cut in deriving the signal MC shape, we loosened the cut by$ 5^\circ $ for each angle. The differences between the nominal and new efficiencies were considered as the systematic uncertainties: 5.5% for$ \Lambda_c^+ \to \Sigma^{0}K^+\pi^{0} $ and 4.9% for$ \Lambda_c^+ \to \Sigma^{0}K^+\pi^+\pi^- $ .$ \bf (i) $ $ N_{\Lambda_c^+\bar\Lambda_c^-} $ : The uncertainty of$ N_{\Lambda_c^+\bar\Lambda_c^-} $ was extracted from Refs. [13, 15]. Its effect on BF measurement, 0.9%, was assigned as the systematic uncertainty for both decays.$ \bf (j) $ MC statistics: The uncertainties due to limited MC statistics were 0.5$ $ % for$ \Lambda_c^+ \to \Sigma^{0}K^+\pi^{0} $ and 0.3$ $ % for$ \Lambda_c^+ \to \Sigma^{0}K^+\pi^+\pi^- $ .$ \bf (k) $ $ \Delta E_{\Lambda} $ requirement: The uncertainty due to the$ \Delta E_{\Lambda} $ requirement was estimated using the control samples of$ \Lambda_c^+ \to \Sigma^{0}\pi^+\pi^{0} $ and$ \Lambda_c^+ \to \Sigma^{0}\pi^+\pi^{+}\pi^{-} $ . The maximum changes of the acceptance efficiencies between data and MC simulation resulting from varying the$ \Delta E_\Lambda $ requirement by$ \pm0.05 $ GeV were considered as the systematic uncertainties: 0.4% and 0.3% for$ \Lambda_c^+ \to \Sigma^{0}K^+\pi^{0} $ and$ \Lambda_c^+ \to \Sigma^{0}K^+\pi^+\pi^- $ , respectively.$ \bf (l) $ $ \theta_{\bar{p}\gamma} $ requirement: The systematic uncertainty from the$ \theta_{\bar{p}\gamma} $ requirement for$ \Lambda^+_c\to \Sigma^0K^+\pi^0 $ was estimated using the control sample of$ \Lambda^+_c\to \Sigma^0\pi^+\pi^0 $ . The maximum change in the acceptance efficiencies between data and MC simulation after varying the$ \theta_{\bar p\gamma} $ requirement by$ \pm5^\circ $ , 0.1% was assigned as the systematic uncertainty. -
The fit result is consistent with a background-only hypothesis of
$ \Lambda_c^+ \to \Sigma^{0}K^+\pi^{0} $ and$ \Lambda_c^+ \to \Sigma^{0}K^+ \pi^+ \pi^- $ , and the upper limits on their BFs were determined. The distributions of raw likelihoods versus individual BFs are represented as blue dashed curves in Fig. 4. Each curve is then convolved with a Gaussian function with zero mean and width set as the corresponding multiplicative systematic uncertainty, according to Refs. [36, 37]. The updated likelihood distributions are represented as red solid lines in Fig. 4. By integrating the red solid curves from zero to 90% of the physical region, the upper limits on the BFs at the 90% C.L. were set to be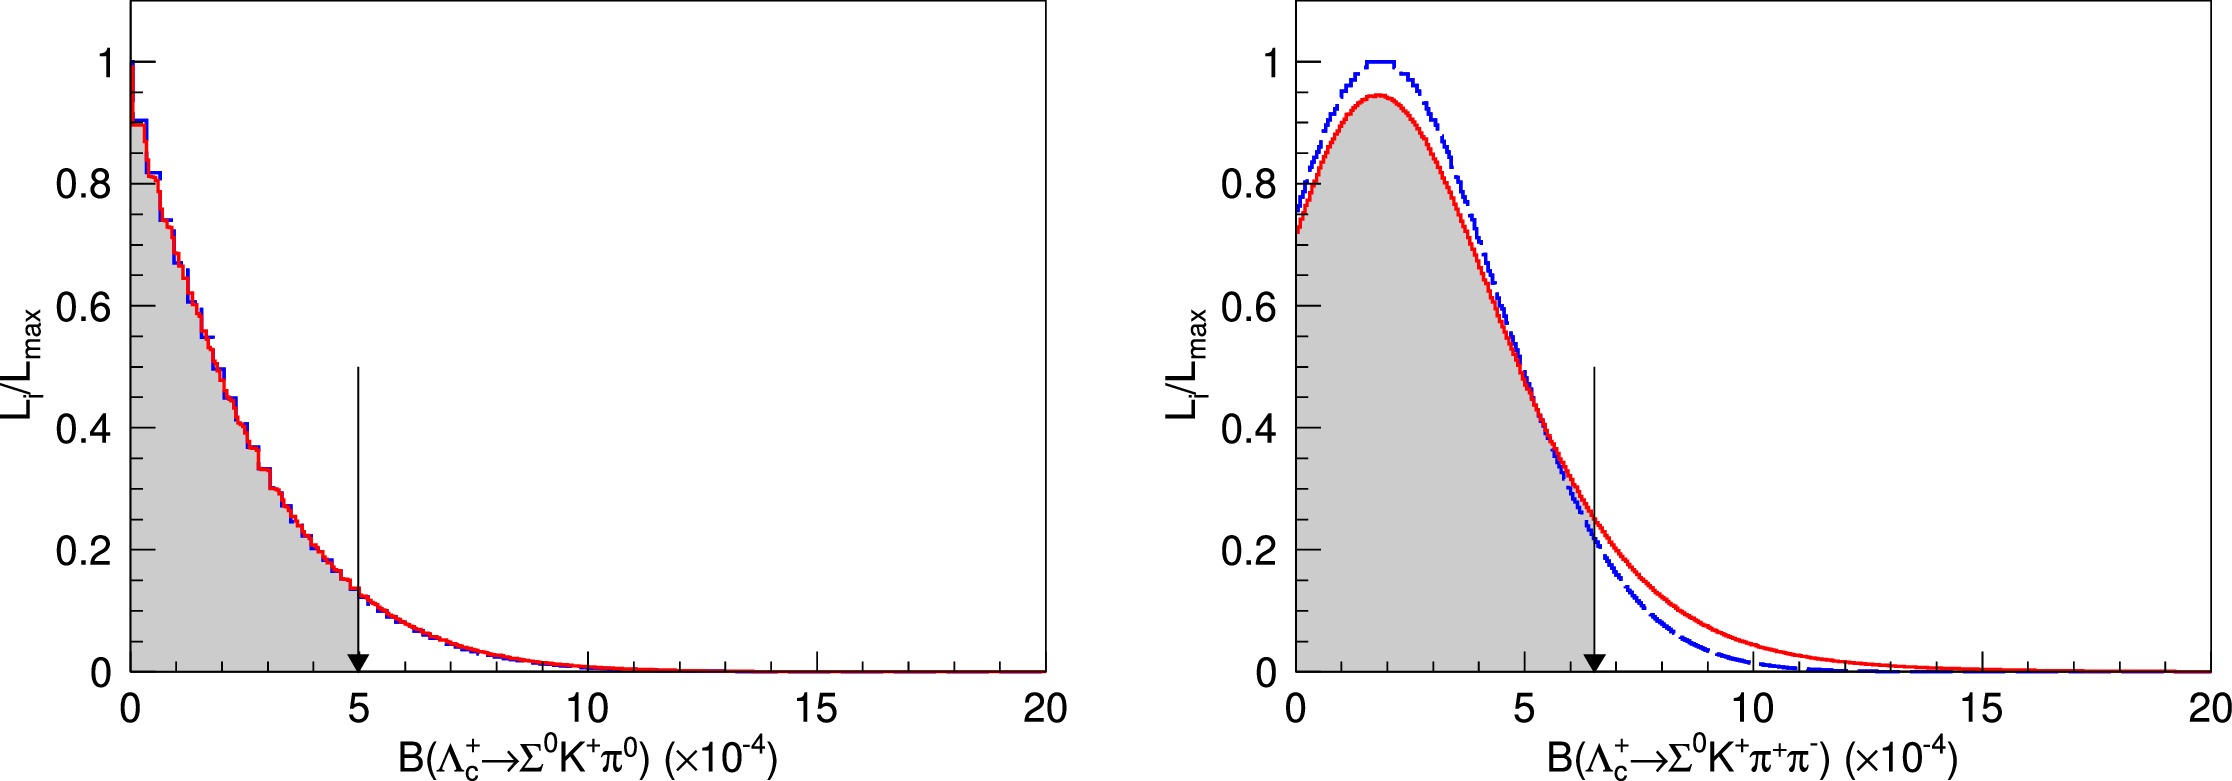
Figure 4. (color online) Distributions of the likelihoods versus BFs of
$ \Lambda_c^+ \to \Sigma^{0}K^+\pi^{0} $ (top) and$ \Lambda_c^+ \to \Sigma^{0}K^+ \pi^+ \pi^- $ (bottom). The results obtained with and without incorporating the systematic uncertainties are represented by red solid and blue dashed curves, respectively. The black arrows show the results corresponding to the 90% C.L.$ \begin{aligned} &{\cal{B}}(\Lambda_c^+ \to \Sigma^{0}K^+\pi^{0})< 5.0\times 10^{-4},\\ &{\cal{B}}(\Lambda_c^+ \to \Sigma^{0}K^+\pi^+\pi^-)< 6.5\times 10^{-4}. \end{aligned}$

-
Based on 4.5 fb
$ ^{-1} $ of$ e^+e^- $ annihilation data collected at c.m. energies between 4599.53 MeV and 4698.82 MeV with the BESIII detector at the BEPCII collider, we studied singly Cabibbo-suppressed hadronic decays$ \Lambda_c^+ \to \Sigma^{0}K^+\pi^{0} $ and$ \Lambda_c^{+}\to\Sigma^0K^{+}\pi^{+}\pi^{-} $ using a single-tag method. The upper limits on their BFs at the 90% C.L. were determined to be$ 5.0\times 10^{-4} $ for$ \Lambda_c^+ \to \Sigma^{0}K^+\pi^{0} $ and$ 6.5\times 10^{-4} $ for$ \Lambda_c^{+}\to\Sigma^0K^{+}\pi^{+}\pi^{-} $ . The upper limit of the BF of$ \Lambda^+_c\to \Sigma^0K^+\pi^0 $ is more stringent than the previous BESIII measurement using a double-tag method [11]. The predictions based on$ SU(3) $ flavor symmetry exceed our upper limit by 2.4σ [7], 1.7σ [8], and 2.0σ [9], respectively. These discrepancies can be further investigated through fits to progressively obtain more accurate experimental measurements. Predictions from the statistical isospin model [10] differ from our results by 2.9σ, which indicates that the assumption of$ {\cal{B}}(\Lambda_c^+ \to \Sigma^{+}K^+\pi^{-}) $ =$ {\cal{B}}(\Lambda_c^+ \to \Sigma^{0}K^+\pi^{0}) $ is not accurate, as shown in Table 4. For$ \Lambda_c^{+}\to\Sigma^0K^{+}\pi^{+}\pi^{-} $ , the upper limit is less stringent than the BaBar result [12]. These results provide valuable information for understanding the dynamics of charmed baryon decays and important input to theoretical models. The sensitivities to these two decays could be further improved with a larger data sample at BESIII [21] in the near future.Decay mode $ \Lambda_{c}^{+}\to\Sigma^{0} K^{+}\pi^{0} $ 

$ \Lambda_c^{+}\to\Sigma^0K^{+}\pi^{+}\pi^{-} $ 

M.Gronau et al. [10] $ (2.1\pm0.6) \times 10^{-3} $ 

- C.Q.Geng et al. [7] $ (1.2\pm0.3) \times 10^{-3} $ 

- J.Y.Cen et al. [8] $ (7.8\pm2.3) \times 10^{-4} $ 

- C.Q.Geng et al. [9] $ (8.2\pm1.4) \times 10^{-4} $ 

- BESIII (double-tag) [11] $ < 1.8 \times 10^{-3} $ 

- BaBar experiment [12] - $ < 2.5 \times 10^{-4} $ 

BESIII (single-tag) $ < 5.0 \times 10^{-4} $ 

$ < 6.5 \times 10^{-4} $ 

Table 4. Comparison of the experimental measurements of
$ \Lambda_c^+ \to \Sigma^{0}K^+\pi^{0} $ and$ \Lambda_c^{+}\to\Sigma^0K^{+}\pi^{+}\pi^{-} $ obtained in this study with those of BaBar and BESIII (single-tag) as well as theoretical predictions. -
The BESIII collaboration thanks the staff of BEPCII and the IHEP computing center for their strong support.
Search for Cabibbo-suppressed decays ${\boldsymbol\Lambda_{\boldsymbol c}^{\bf +} }$ → Σ0K+π0 and $ {\boldsymbol\Lambda_{\boldsymbol c}^{\bf +} }$ → Σ0K+π+π−
- Received Date: 2025-02-16
- Available Online: 2025-07-15
Abstract: Utilizing 4.5


 DownLoad: