-
Chemical and kinetic freeze-out temperatures are two critical stages experienced by a system. Different levels of system excitations can be observed in these stages. These various excitation levels are represented by chemical and kinetic freeze-out temperatures. Typically, during chemical freeze-out, particle ratios are stable, and using the thermal model, the chemical freeze-out temperature is calculated from different particle ratios [1−3]. During kinetic freeze-out, the transverse momentum spectra of various particles are unaffected. Via the hydro-dynamical model, these spectra can be used to determine the thermal/kinetic freeze-out temperature [4].
Transverse momentum spectra cover both thermal motion and transverse flow velocity effects across a small pT range. The transverse flow velocity denotes system expansion, whereas random thermal motion denotes excitation. We disregard the influence of the transverse flow velocity (βT) to isolate the random thermal motion and establish the kinetic freeze-out temperature (T0). The blast wave fit using Boltzmann Gibbs statistics [5−7], blast wave model with Tsallis statistics [8–10], and other approaches [11–17] are several methods that can be used to address this.
A difficult situation is presented by the centrality relationship between T0 and βT, for which there are two perspectives: (1) T0 decreasing from central to peripheral collisions [18–21], and (2) T0 increasing from central to peripheral collisions [22–24]. Both perspectives provide a justification. A lower T0 in central collisions denotes a longer-lasting fireball in such occurrences, whereas a higher T0 in core collisions denotes stronger system excitation as a result of more powerful collisions. The collision system exhibiting the greater T0 must be identified. Various viewpoints on particle freeze-out also exist, covering single, double, and multiple kinetic freeze-out scenarios; therefore, establishing the precise freeze-out scenario is crucial.
In this study, the extraction of temperature from proton, deuteron, and triton pT spectra is the main objective. As light nuclei, deuterons and tritons present a problem in understanding their formation mechanism in relativistic heavy ion collisions [25–27]. The coalescence of nucleons and anti-nucleons is one conceivable strategy [28–32]. Light nuclei cannot survive at temperatures much higher than their binding energies because of their small binding energies (d with 1.1 MeV/nucleon and t with 2.93 MeV/nucleon). Because the normal kinetic freeze-out temperature of light hardons is around 100 MeV [33], it is possible that once nucleons separate from the hot, dense system, they will divide and then consolidate to produce new particles. Therefore, the nucleon distribution at freeze-out can be better understood by analyzing light nuclei [28, 31, 34].
It is important to emphasize the importance of volume in high-energy collisions before exploring the formalism. The kinetic freeze-out volume (V) is the amount of space occupied by secondary particles when reciprocal interactions cease and only the Coulombic repulsive force remains. Although multiple freeze-out volumes can appear at different times, in this study, we only consider the kinetic freeze-out volume, or V. This variable provides information on the coexistence of phase transitions and is crucial for deriving multiplicity, micro-canonical heat capacity, and the negative branch or shape of caloric curves under thermal limitations.
The technique and formalism are presented in Sec. II, and the findings and subsequent discussion are presented in Sec. III. Finally, our main findings and recommendations are outlined in Sec. IV.
-
In high-energy collisions, such as those occurring in particle accelerators or in cosmic rays interacting with matter, the production of deuterons and hadrons follows complex processes governed by quantum chromodynamics (QCD) and nuclear physics. Below is a detailed description of the mechanisms involved [25–34].
(a) Initial collision: In high-energy collisions (e.g., proton-proton or heavy-ion collisions), two high-energy particles collide, producing a highly energetic environment where quarks and gluons (the fundamental constituents of matter) are liberated from their bound states inside protons or neutrons. The collision can create a quark-gluon plasma (QGP), a state of matter where quarks and gluons are not confined within hadrons but exist freely for a brief moment.
(b) Hadronization: As the system cools, quarks and gluons recombine to form hadrons in a process called hadronization.
(c) Fragmentation: Individual quarks and gluons fragment into jets of particles, which then combine to form hadrons such as pions, kaons, protons, and neutrons. This is described by fragmentation functions.
(d) Coalescence: In some cases, especially in the dense environment of a heavy-ion collision, quarks can combine directly to form hadrons. For instance, two up quarks and a down quark might recombine to form a proton.
(e) Hadron resonances: Resonances, which are short-lived excited states of hadrons, can be produced. These resonances quickly decay into stable hadrons.
(f) Final state interactions: After hadronization, hadrons may still interact with each other through final-state interactions, such as rescattering, which can alter their momentum and distribution.
Deuterons, which are bound states of a proton and neutron, are primarily produced through a process called coalescence. In a high-energy collision, if a proton and neutron are sufficiently close in phase space (i.e., they have similar positions and momenta), they can coalesce to form a deuteron. The coalescence mechanism depends heavily on the density and temperature of the system, as well as the relative momentum of the nucleons. The production of hadrons and deuterons in high-energy collisions is a multi-step process involving the liberation of quarks and gluons, their recombination into hadrons, and the coalescence of nucleons to form light nuclei such as deuterons. The details of these processes are highly dependent on the environment created in the collision, including factors such as temperature, density, and the dynamics of QGP [25–34].
In the context of heavy-ion collisions, deuteron production can also be understood within the statistical hadronization model, where deuterons form as part of the thermal freeze-out of the system. This model assumes that as the system cools, hadrons (including light nuclei such as deuterons) are produced according to thermal distributions based on the temperature and chemical potential of the system.
A variety of methodologies, including the Hagedorn thermal model [20], blast wave model using Boltzmann Gibbs statistics [5‒7], and standard distribution [35, 36], are used to obtain such an environment in which particles are assumed to be produced virtually. The blast wave model using Tsallis statistics is the subject of our study. According to [8], the probability density function can be obtained using the blast wave fit with Tsallis statistics (BWTS function).
$ f\left({p}_{\rm T}\right)=\frac{1}{N}\frac{{\rm d}N}{{\rm d}{p}_{\rm T}}, $

(1) or
$ f\left({p}_{\rm T}\right) \propto {m}_{\rm T}{\int }_{-Y}^{+Y}\mathrm{c}\mathrm{o}\mathrm{s}\mathrm{h}\left(y\right){\rm d}y{\int }_{-\pi }^{\pi }{\rm d}\Phi {\int }_{0}^{R}r{\rm d}r \left[1+ \frac{(q-1)\left\{{m}_{\rm T}\mathrm{c}\mathrm{o}\mathrm{s}\mathrm{h}\left(y\right){\rm cosh}\left(\rho \right)-{p}_{\rm T}{\rm sin}h\left(\rho \right){\rm cos}\left(\Phi \right)\right\}}{{T}_{o}}\right]^{-1/(q-1)}. $

This gives
$ f\left({p}_{\rm T}\right)=C\frac{gV}{{\left(2\pi \right)}^{2}}{p}_{\rm T}{m}_{\rm T}{\int }_{-Y}^{+Y}\mathrm{c}\mathrm{o}\mathrm{s}\mathrm{h}\left(y\right){\rm d}y{\int }_{-\pi }^{\pi }{\rm d}\Phi {\int }_{0}^{R}r{\rm d}r{\left[1+\frac{(q-1)\left\{{m}_{\rm T}\mathrm{c}\mathrm{o}\mathrm{s}\mathrm{h}\left(y\right){\rm cosh}\left(\rho \right)-{p}_{\rm T}{\rm sin}h\left(\rho \right){\rm cos}\left(\Phi \right)\right\}}{{T}_{o}}\right]}^{-1/(q-1)}, $

(2) where C is a normalization constant, which normalizes the integral in the above equations to 1. g is the degeneracy factor, which is different for different particles based on gn= 2Sn+ 1. mT is the transverse mass, i.e, mT=
$ \sqrt{{p}_{\rm T}^{2}+{m}_{o}^{2}} $ , where m0 is the rest mass of the particle. Φ is the azimuthal angle, r is the radial coordinate, R is the maximum value of r, q is the measure of the degree of deviation of the system from an equilibrium state, and ρ = tanh-1{β(r)} is the boost angle, where {β(r)} = βS(r/R)no is a self-similar flow profile in which βS is the flow velocity on the surface, as a mean of β(r), β(r) = (2/R2)$ \int_{0}^{r} r \beta(r) \text{dr}$ = 2βs/(n0 + 2) = 2βs/3, and n0 = 1. Furthermore, the index –1/(q – 1) in Eq. (1) can be replaced by – q/(q – 1) because q is close to 1. This replacement results in a small and negligible divergence in the Tsallis distribution.The aforementioned equation successfully characterizes the pT spectra for a small pT range, enabling the extraction of hadron temperature. However, we must consider the impact of the hard scattering process when using a broad pT range. The contribution of the hard process is quantified as an inverse power law according to QCD calculus [37–39].
$ {f}_{H}\left({p}_{\rm T}\right)=\frac{1}{N}\frac{{\rm d}N}{{\rm d}{p}_{\rm T}}=A{p}_{\rm T}{\left(1+\frac{{p}_{\rm T}}{{p}_{o}}\right)}^{-n} .$

(3) This is the Hagedorn function [39, 40].
Here, A is the normalization constant, and p0 and n are the free parameters.
When the pT spectra are distributed in a wide range, the superposition of the soft and hard scattering processes can be used. If Eq. (1) describes the contribution of the soft process, the contribution of the hard process can be described by Eq. (2). To describe the spectrum in a wide pT range, we can superpose the two-component superposition, i.e,
$ {f}_{o}\left({p}_{\rm T}\right)=k{f}_{S}\left({p}_{\rm T}\right)+(1-k){f}_{H}\left({p}_{\rm T}\right). $

(4) Here, k is the contribution fraction of soft excitation, (1 –k) is the hard scattering process, fS is the soft process, which contributes to the low pT region, and fH is the hard process, which contributes in the entire pT region. The two contributions overlap in the low pT region.
We may also use the usual step function to superpose the two functions. According to the Hagedorn model [39],
$ {f}_{o}\left({p}_{\rm T}\right)={A}_{1}\theta \left({p}_{1}-{p}_{\rm T}\right){f}_{S}\left({p}_{\rm T}\right)+{A}_{2}\theta \left({p}_{\rm T}-{p}_{1}\right){f}_{H}\left({p}_{\rm T}\right), $

(5) where A1 and A2 are the normalization constants that synthesize A1fS (p1) = A1fH (p1) and θ(x) is the usual step-function.
Further information about the fitting parameters and process may be found in references [15, 18−21, 33, 35, 36]
-
The transverse momentum (pT) distributions for protons, deuterons, and tritons in Au + Au collisions at
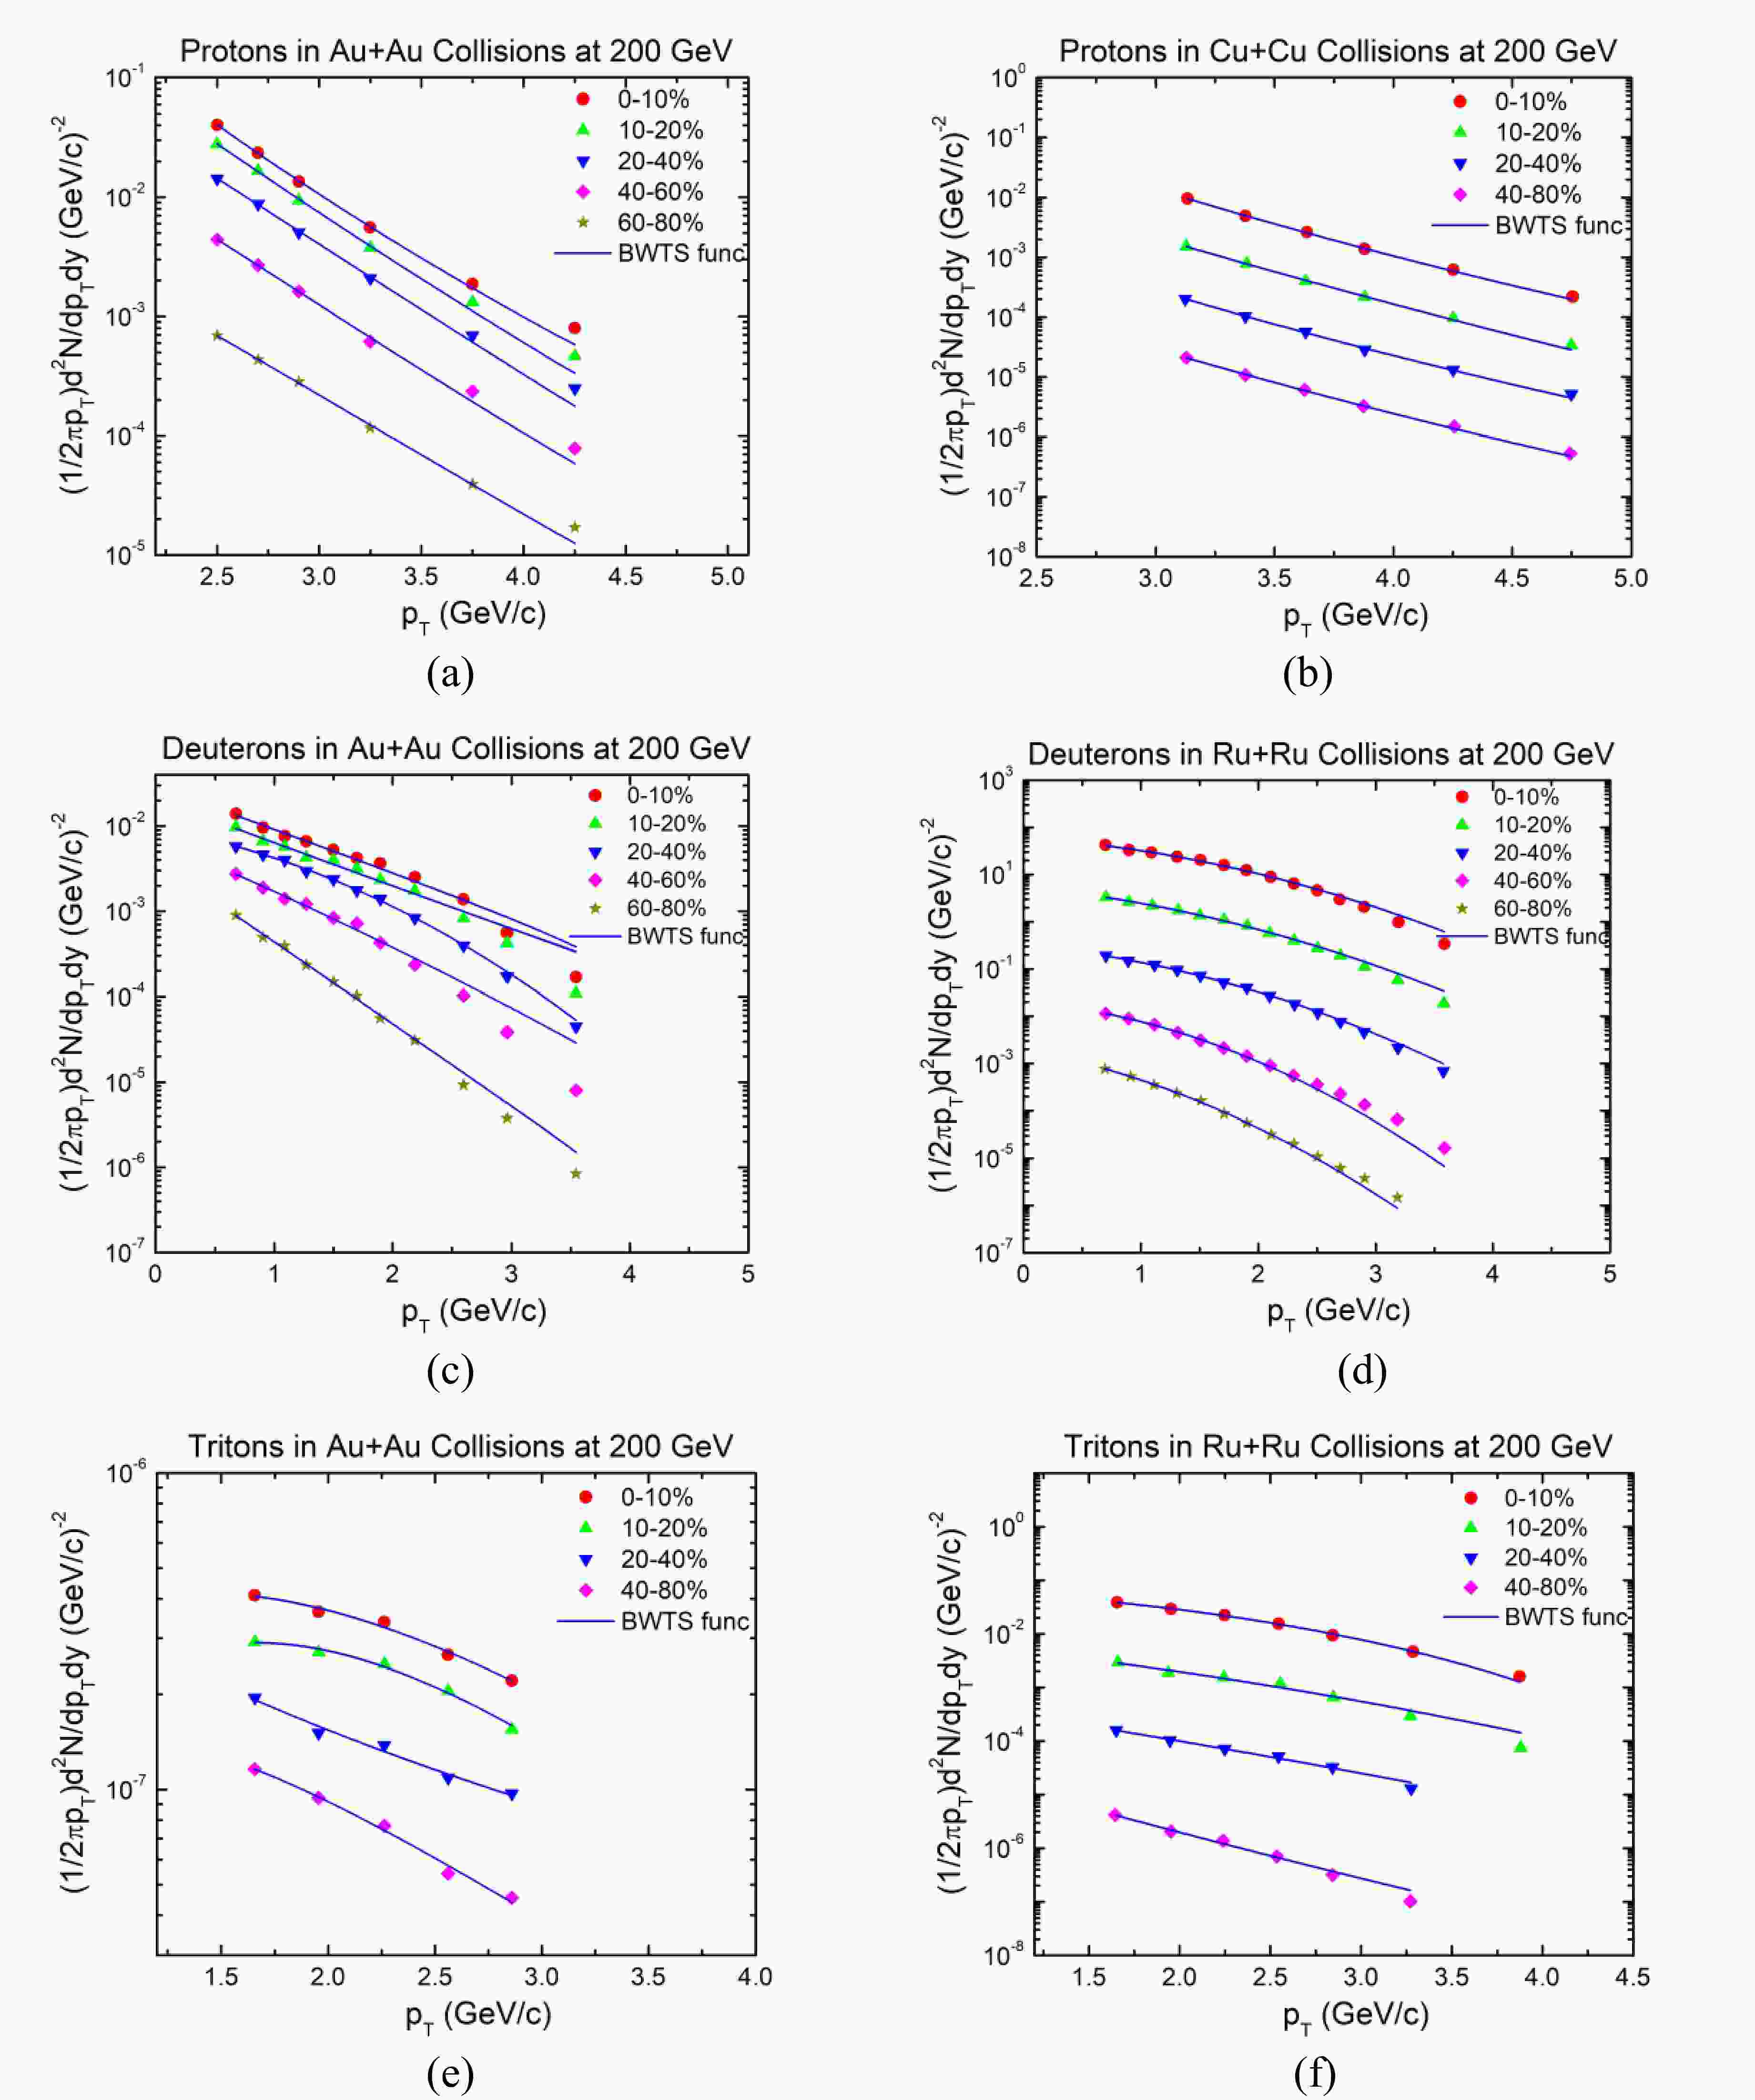
$\sqrt{{s}_{_{NN}}}$ = 200 GeV are shown in Fig. 1(a), (c), and (e), respectively, and are given by$\left\{\left(\dfrac{1}{2\pi {p}_{\rm T}}\right) \dfrac{{\rm d}^{2}N}{{\rm d}y{\rm d}{p}_{\rm T}}\right\}$ . For comparison, we present protons obtained in Cu+Cu collisions (b) at same energy and deuterons (d) and tritons (f) produced in Ru+Ru collisions at the same center of mass energy of 200 GeV. We investigate the proton, deuteron, and triton production at$\sqrt{{s}_{_{NN}}}$ = 200 GeV. Proton production data are available only for Cu+Cu collisions [41], whereas deuteron and triton data are available only for Ru+Ru collisions [42] at 200 GeV. Therefore, we choose to compare these datasets. Based on the available datasets, the transverse momentum (pT) regions for protons, deuterons, and tritons in all collision systems at the same energy are chosen to be (2.5 to 5.0) GeV/c, (0.5 to 4.0) GeV/c, and (1.5 to 5.0) GeV/c, respectively, owing to the limited available data. The experimental data are taken from published papers, e.g., protons [43], deuterons [44], and tritons [45] obtained in Au+Au collisions, Cu+Cu collisions [41], and Ru+Ru collisions [42] at 200 GeV. For protons and deuterons in Au+Au collisions, the pT distributions are divided into separate centrality intervals of 0–10%, 10%–20%, 20%–40%, 40%–60%, and 60%–80%, whereas the centrality bins for tritons are 0–10%, 10%–20%, 20%–40%, and 40%–80%, all within the mid rapidity (y) range. For protons in Cu+Cu collisions and tritons in Ru+Ru collisions, the pT distributions are divided into separate centrality intervals of 0–10%, 10%–20%, 20%–40%, and 40%–80%, whereas the centrality bins for deuterons are 0–10%, 10%–20%, 20%–40%, 40%–60%, and 60%–80%, all within the mid rapidity (y) range. The curves show the results of our fitting using the blast wave model with Tsallis statistics (Eq. (2)), where the symbols represent the experimental observations from published works of RHIC data. Table 1 lists the pertinent variables obtained from the fitting process shown in Fig. 1. It is clear that the results from Au-Au, Cu+Cu, and Ru+Ru collisions at 200 GeV at the RHIC are well described by Eq. (2). This is also evident from the χ2/n.d.f values in Table 1.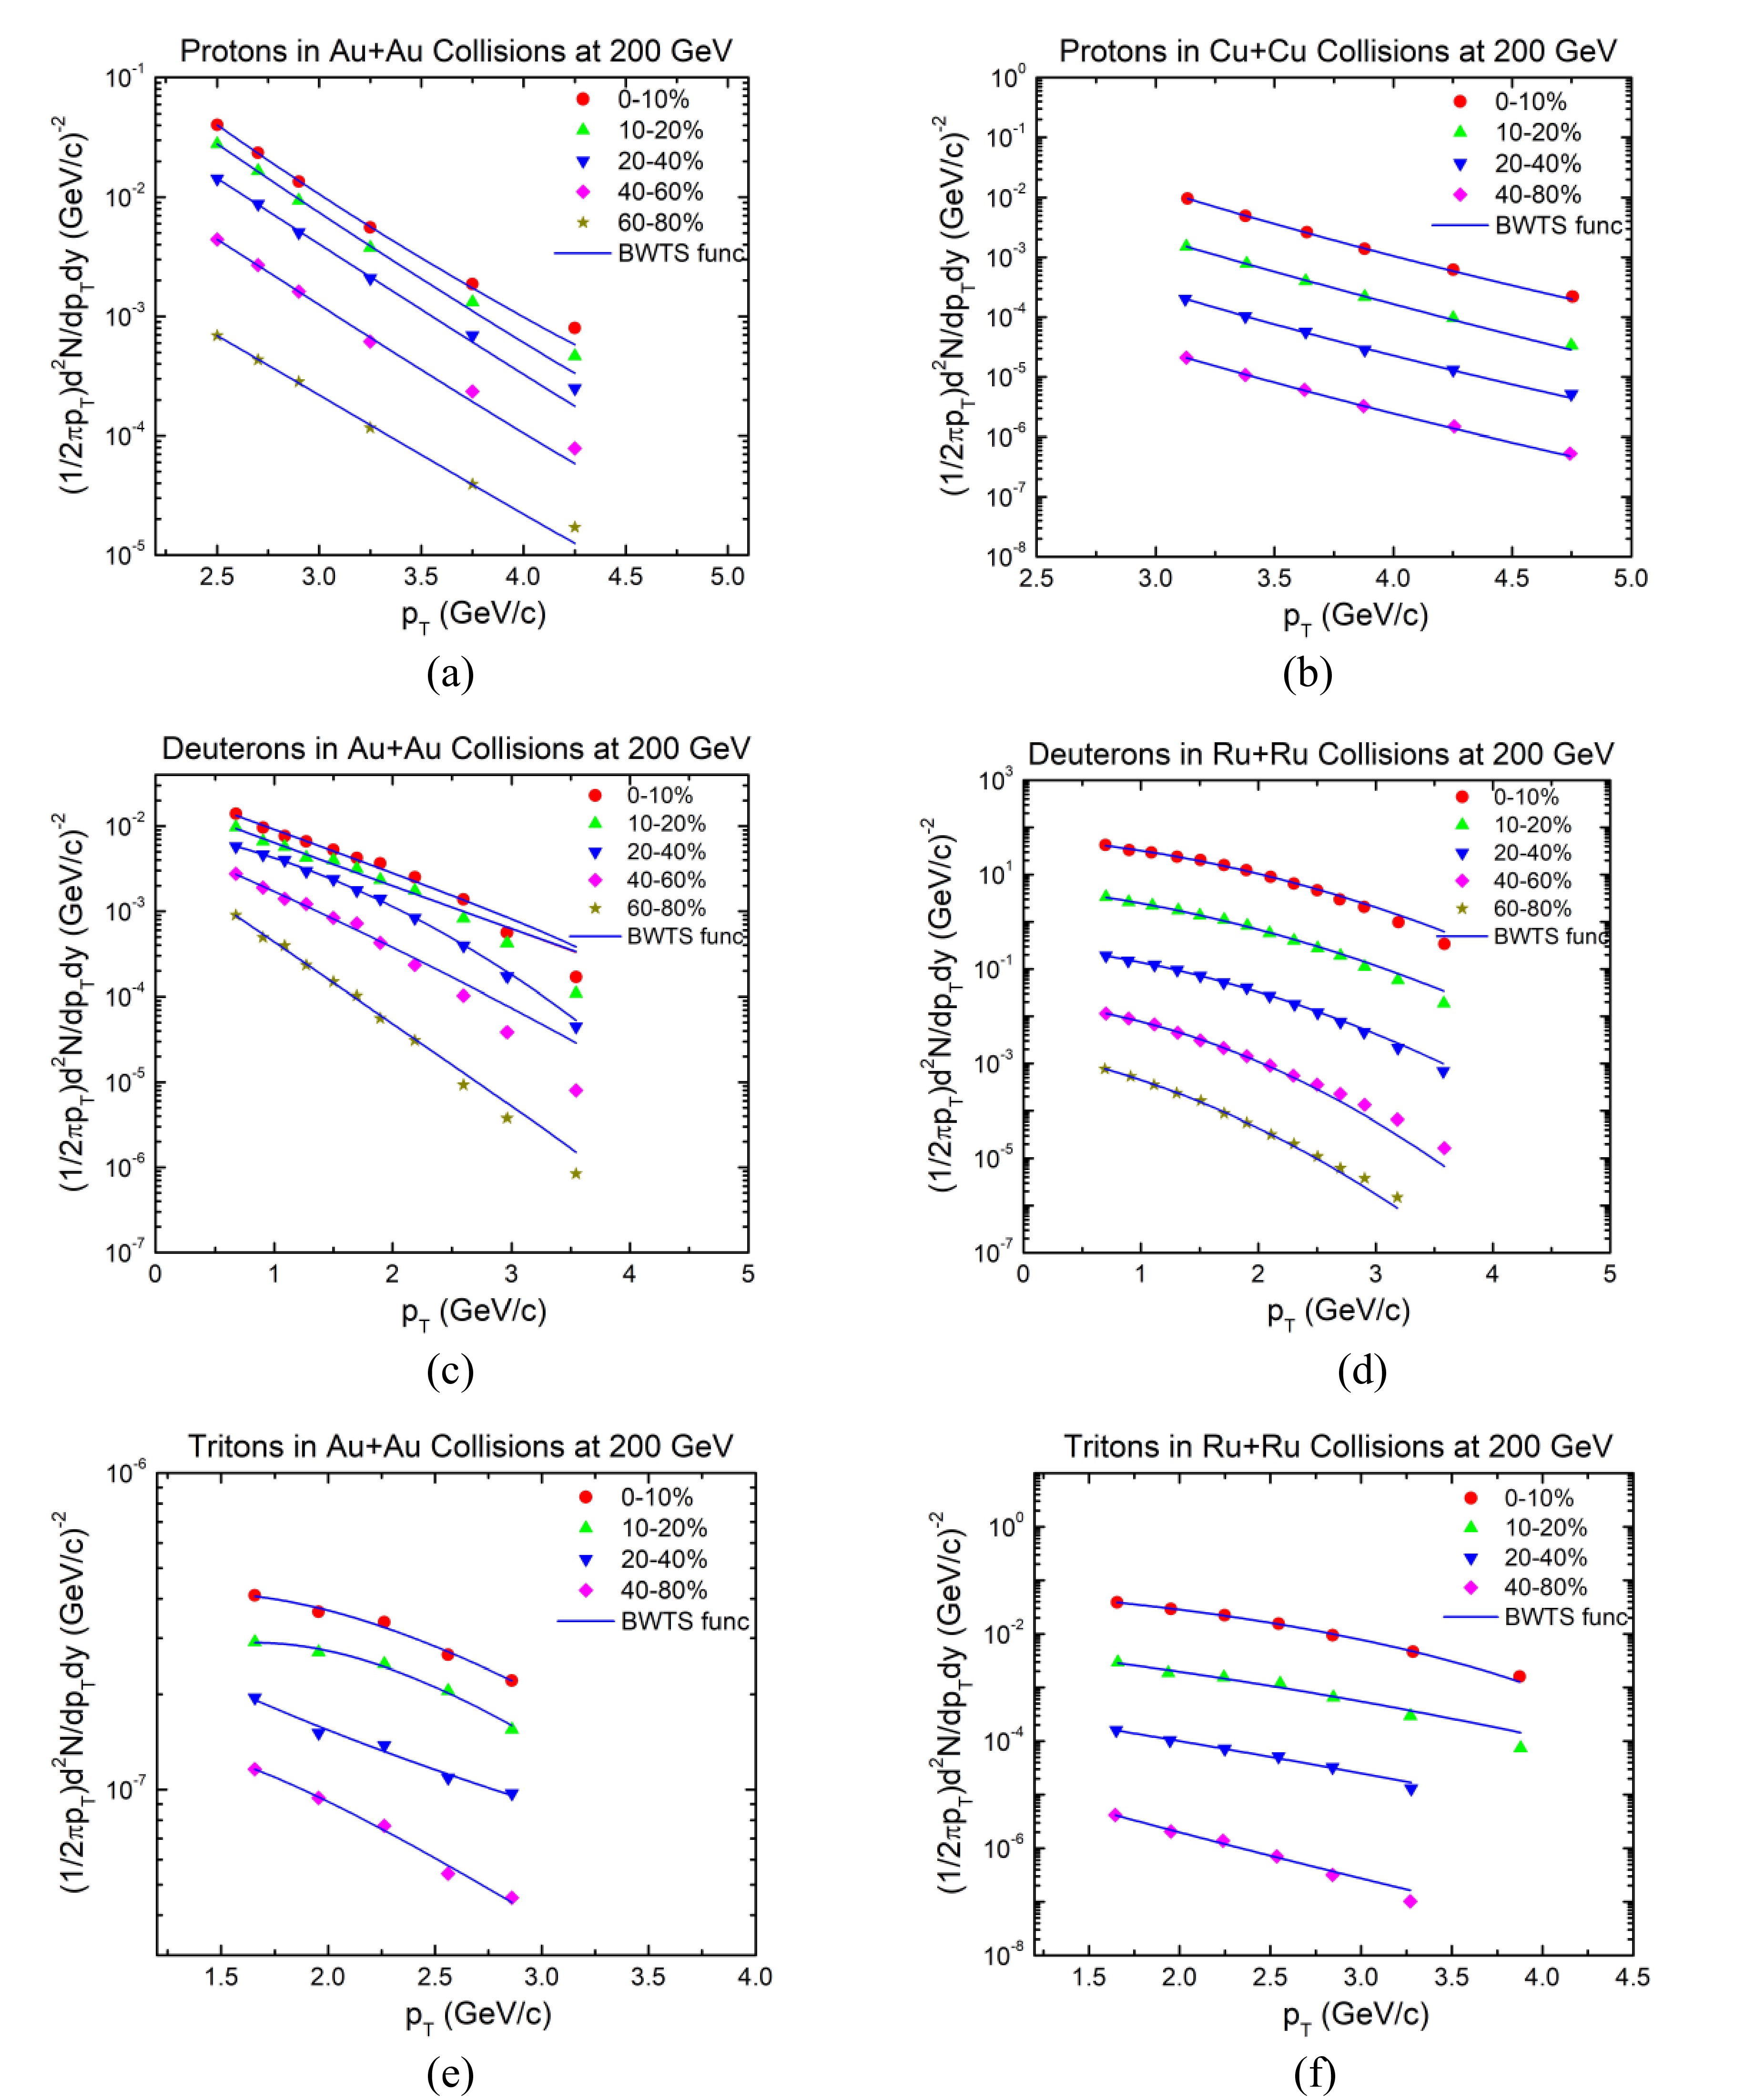
Figure 1. (color online) Transverse mass spectra of protons (a), deuterons (c), and tritons (e) produced in Au-Au collisions at
$\sqrt{{s}_{_{NN}}}$ = 200 GeV, protons (b) in Cu-Cu collisions, and deuterons (d) and tritons (f) in Ru-Ru collisions at$\sqrt{{s}_{_{NN}}}$ = 200 GeV. The solid curves show the fitted results from Eq. (2).Particle Centrality (%) Collision N0 q V/fm3 T0/GeV βT/c χ2/n.d.f Protons (p) 0−10 Au+Au 0.0894±0.006 1.131±0.013 4215±213 0.091±0.005 0.512±0.003 0.0114 Cu+Cu 0.0713±0.001 1.112±0.041 3075±115 0.082±0.007 0.452±0.003 0.0141 10−20 Au+Au 0.0657±0.007 1.135±0.012 4120±114 0.097±0.006 0.501±0.008 0.0075 Cu+Cu 0.0518±0.004 1.121±0.021 2861±125 0.094±0.008 0.421±0.004 0.0071 20−40 Au+Au 0.0420±0.005 1.138±0.012 3986±233 0.106±0.005 0.482±0.007 0.0034 Cu+Cu 0.0591±0.003 1.121±0.081 2605±116 0.101±0.009 0.358±0.002 0.0082 40−60 Au+Au 0.0203±0.006 1.139±0.021 3884±134 0.116±0.007 0.466±0.010 0.0846 40−80 Cu+Cu 0.0493±0.002 1.128±0.071 2461±131 0.107±0.006 0.318±0.001 0.0051 60−80 Au+Au 0.0093±0.001 1.140±0.013 3469±115 0.123±0.008 0.449±0.011 0.0081 Deuterons (d) 0−10 Au+Au 0.061±0.007 1.120±0.012 3567±123 0.129±0.009 0.425±0.013 0.0012 Ru+Ru 0.016±0.003 1.101±0.031 3075±114 0.124±0.006 0.413±0.003 0.0324 10−20 Au+Au 0.0019±0.0004 1.122±0.13 3320±145 0.134±0.008 0.412±0.013 0.0262 Ru+Ru 0.0029±0.0002 1.103±0.02 2861±117 0.129±0.007 0.401±0.002 0.0087 20−40 Au+Au 0.0011±0.0003 1.124±0.04 3028±162 0.139±0.009 0.385±0.014 0.0611 Ru+Ru 0.002±0.0002 1.107±0.01 2605±118 0.131±0.006 0.379±0.001 0.0092 40−60 Au+Au 0.0006±0.00004 1.131±0.09 2856±173 0.145±0.009 0.338±0.021 0.0037 Ru+Ru 0.0007±0.00003 1.111±0.03 2461±121 0.136±0.008 0.327±0.002 0.0063 60−80 Au+Au 1.7E-5±2.0E-7 1.132±0.01 2602±152 0.147±0.008 0.302±0.018 0.0011 Ru+Ru 2.6E-5±1.0E-6 1.115±0.04 2176±125 0.139±0.009 0.301±0.003 0.0042 Tritons (t) 0−10 Au+Au 0.073±0.005 1.101±0.013 2775±134 0.136±0.007 0.405±0.017 0.0037 Ru+Ru 0.043±0.002 1.091±0.011 2368±132 0.130±0.009 0.402±0.003 0.0541 10−20 Au+Au 0.069±0.011 1.105±0.012 2364±143 0.139±0.006 0.351±0.002 0.0041 Ru+Ru 0.0183±0.001 1.101±0.041 2154±123 0.132±0.008 0.346±0.002 0.0271 20−40 Au+Au 0.0594±0.012 1.103±0.001 2007±173 0.144±0.006 0.297±0.018 0.0081 Ru+Ru 0.0091±0.0003 1.107±0.031 1976±117 0.137±0.002 0.291±0.013 0.0121 40−80 Au+Au 0.04980±0.005 1.112±0.021 1762±182 0.152±0.007 0.261±0.012 0.0011 Ru+Ru 0.0082±0.0004 1.111±0.022 1692±128 0.141±0.003 0.256±0.003 0.0061 Table 1. Values of variables βT, T0, index of entropy (q), constant (N0), and χ2/n.d.f extracted from the fitting curves in Fig. 1.
To reveal the trend of the calculated parameters, Fig. 2 shows the fluctuation in the kinetic freeze-out temperature T0 with respect to centrality. It is clear that T0 is significantly smaller in central collisions, and its value increases as the centrality decreases, revealing a shift from central to periphery collisions and a shortening of the fireball lifetime. To check the system dependency of hadrons with respect to the centrality of the collision systems at the same energy, Fig. 2 shows the centrality dependence of T0 of protons (a), deuterons (b), and tritons (c) obtained via the BWTS function (Eq. (2)). As shown in Fig. 2(a), the temperature of protons increases with decreasing centrality for both Au+Au and Cu+Cu collisions at 200 GeV. The T0 values of protons for Cu+Cu collisions are smaller than those for Au+Au collisions at the same colliding energy, owing to the smaller colliding system of
$ {}_{29}^{64}{\rm Cu} + {}_{29}^{64}{\rm Cu} $ compared to the${}_{79}^{197}{\rm Au} + {}_{79}^{197}{\rm Au}$ system. However, both have the same ascending slope and agreed values of temperature within uncertainty until 40% centrality. Beyond 40% centrality, there is some difference in both T0 values owing to the peripheral collision systems. Similarly, the deuterons and tritons obtained in Ru+Ru collisions have smaller values of T0 compared to those obtained in Au+Au collisions at the same colliding energy. This is also due to the smaller colliding system of${}_{44}^{101}{\rm Cu} + {}_{44}^{101}{\rm Cu}$ compared to the${}_{79}^{197}{\rm Au} + {}_{79}^{197}{\rm Au}$ system. However, both have the same ascending slope and agreed values of temperature within uncertainty.
Figure 2. (color online) Centrality dependence of T0 of protons (a), deuterons (b), and tritons (c) obtained via the blast wave function with Tsallis statistics (BWTS) function (Eq. (2)).
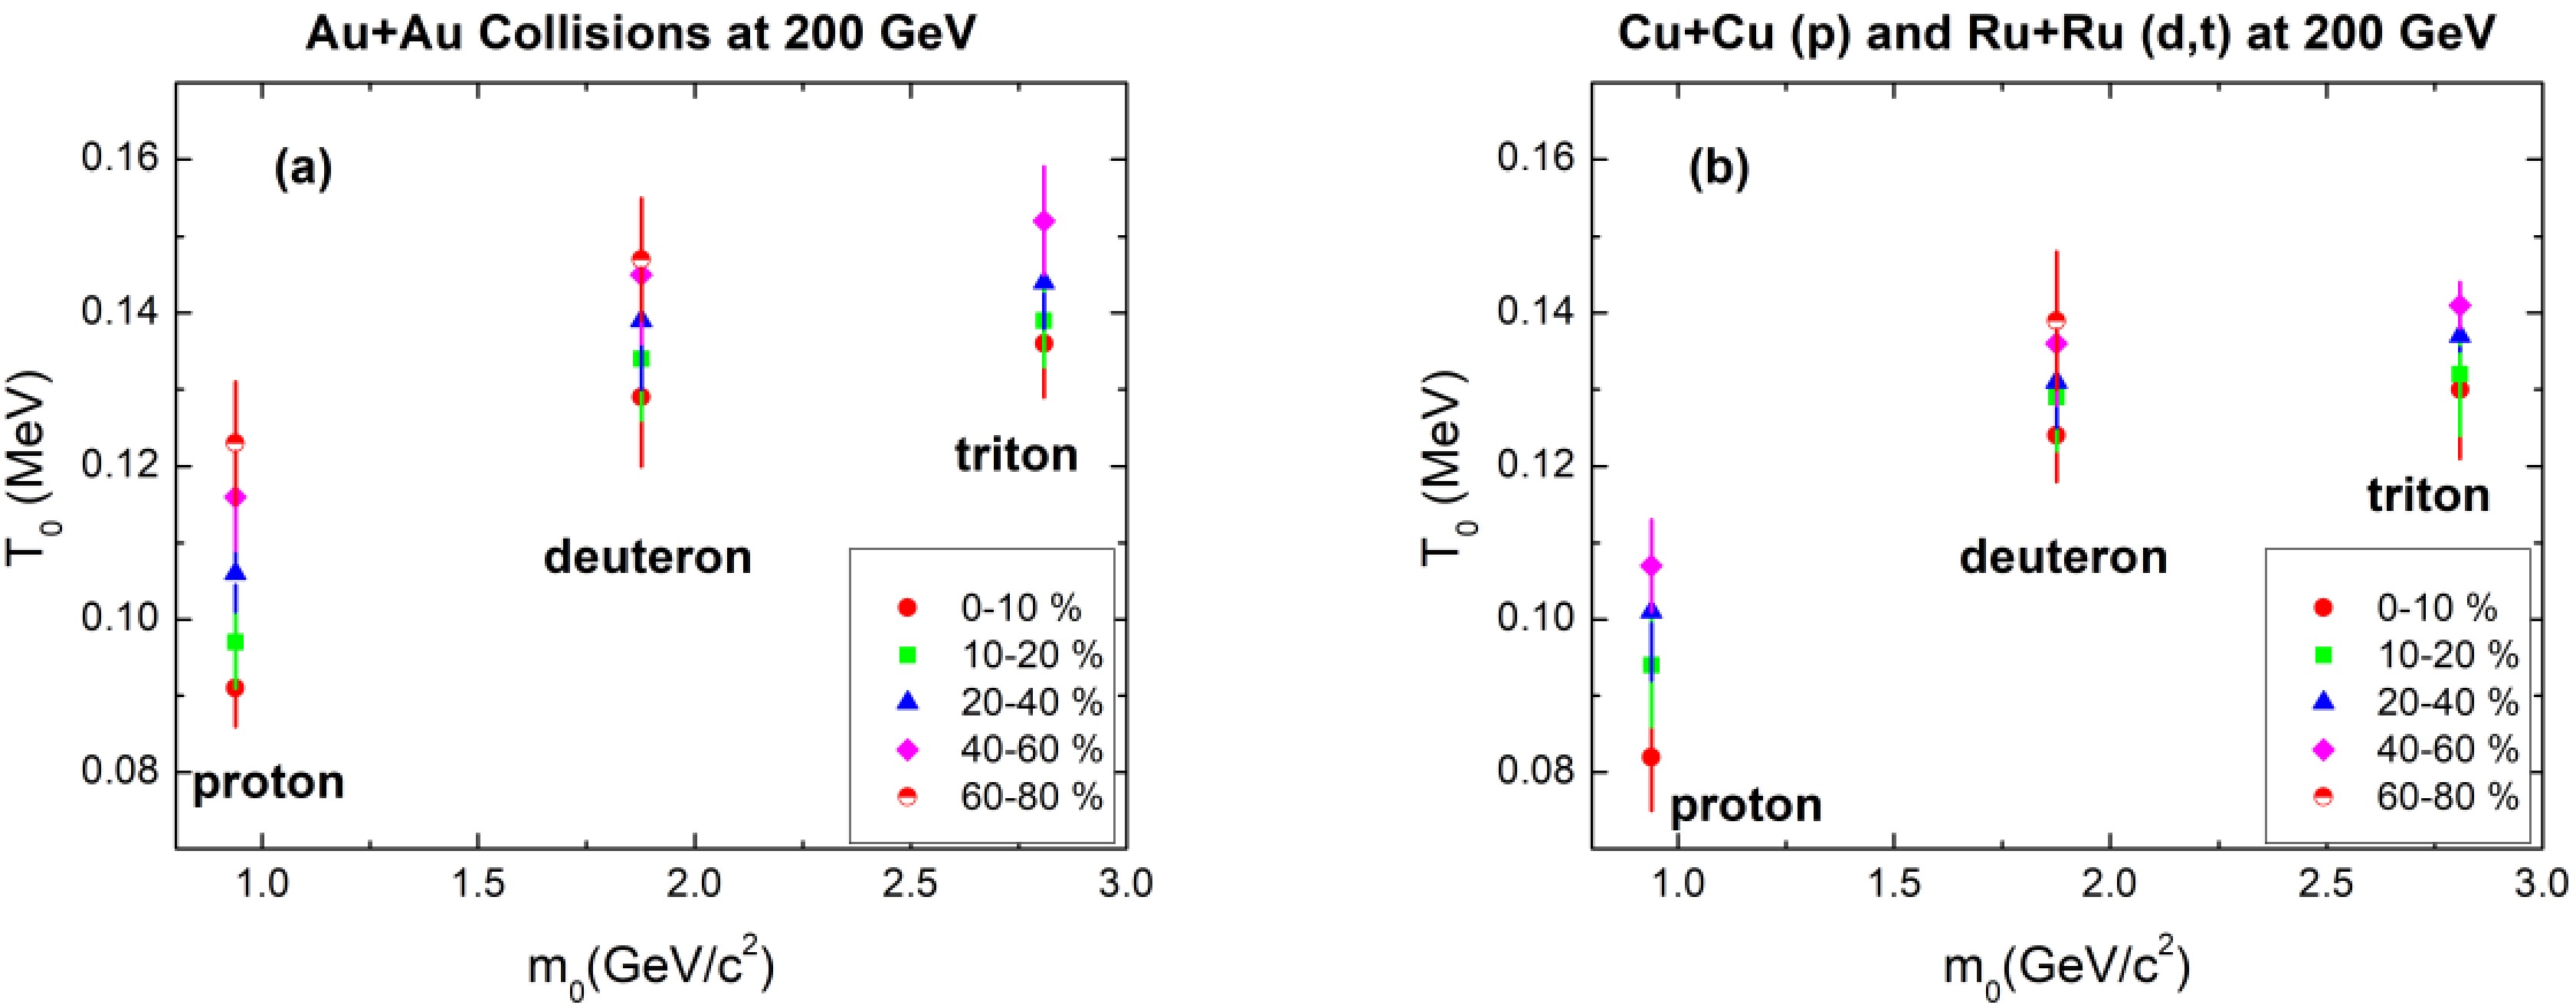
Furthermore, to check the mass dependency of hadrons with respect to the centrality of the collision systems at the same energy, Fig. 3 shows the centrality dependence of T0 of protons, deuterons, and tritons obtained via the BWTS function (Eq. (2)) in Au+Au collisions (a) and Cu+Cu and Ru+Ru collisions (b). As shown in Fig. 3 , a mass dependence of T0 is present, with tritons having the highest value, followed by deuterons, and then protons. This indicates that heavier particles, relative to lighter ones, enter the freeze-out stage earlier. Figure 3(c) shows curves of T0 with respect to centrality for all three hadrons in all colliding systems under study. Again, T0 of tritons obtained in Au+Au collisions have the highest values.

Figure 3. (color online) Centrality dependence of T0 of protons, deuterons, and tritons obtained in Au+Au collisions (a) as well as protons in Cu+Cu collisions and deuterons and tritons in Ru+Ru collisions (b) at 200 GeV, using the blast wave function with Tsallis statistics (BWTS) function (Eq. (2)). The curves of T0 against centrality for all three hadrons in all colliding systems are shown in panel (c).
This pattern can be explained by the following: as we move toward the most peripheral collisions, there is a decrease in overlap, because a sizable fraction of the colliding systems overlap extensively in the most central collisions. As a result, the nucleons in the colliding systems transmit less energy owing to this decrease in overlap. Observe that T0 and the mass of particles align with a mass differential scenario against centrality, which agrees with the observation in references [44−47]. Heavier particles detach from the system earlier than lighter ones owing to a higher temperature. Because they need more energy to produce, large particles have lower production rates, which accounts for their early freeze-out. Consequently, in comparison to lighter particles, they become less common and more prone to freeze-out at higher temperatures.
Furthermore, as shown in Fig. 3, the effect ''heavier particles, relative to lighter ones, enter the freeze-out stage earlier,'' is in agreement with the findings in references [46, 47]. The temperature (effective and kinetic freeze-out temperatures) of lighter particles is only weakly dependent on centrality, but this dependence increases with particle mass. This phenomenon may be explained by the following. The kinetic freeze out temperature of light particles is lower, suggesting that their interactions with the surrounding medium are weaker. Therefore, they are less sensitive to changes in centrality. Conversely, heavier particles have stronger interactions with the medium, which makes them more vulnerable to shifts in centrality.
Figure 4 shows the centrality dependence of the transverse flow velocity (βT) of protons (a), deuterons (b), and tritons (c) obtained via the BWTS function (Eq. (2)). As shown in Fig. 4(a), the transverse flow velocity of protons decreases with decreasing centrality for both Au+Au and Cu+Cu collisions at 200 GeV. The transverse flow velocity of protons for Cu+Cu collisions has smaller values than those for Au+Au collisions at the same colliding energy, because of the smaller colliding system of
${}_{29}^{64}{\rm Cu} + {}_{29}^{64}{\rm Cu}$ compared to the${}_{79}^{197}{\rm Au} + {}_{79}^{197}{\rm Au}$ system. However, both have the same descending slope with different slope values. The gap increases as we shift to the more peripheral collision regions owing to the peripheral nature of collision systems. Similarly, deuterons and tritons obtained in Ru+Ru and Au+Au collisions have approximately equal values of transverse flow velocity (βT) at the same colliding energy. This shows that the colliding system of${}_{44}^{101}{\rm Cu} + {}_{44}^{101}{\rm Cu}$ behaves like the${}_{79}^{197}{\rm Au} + {}_{79}^{197}{\rm Au}$ system at the same energy for transverse flow velocity βT. Both have the same descending slopes and agreed values of βT within uncertainty at each centrality bin.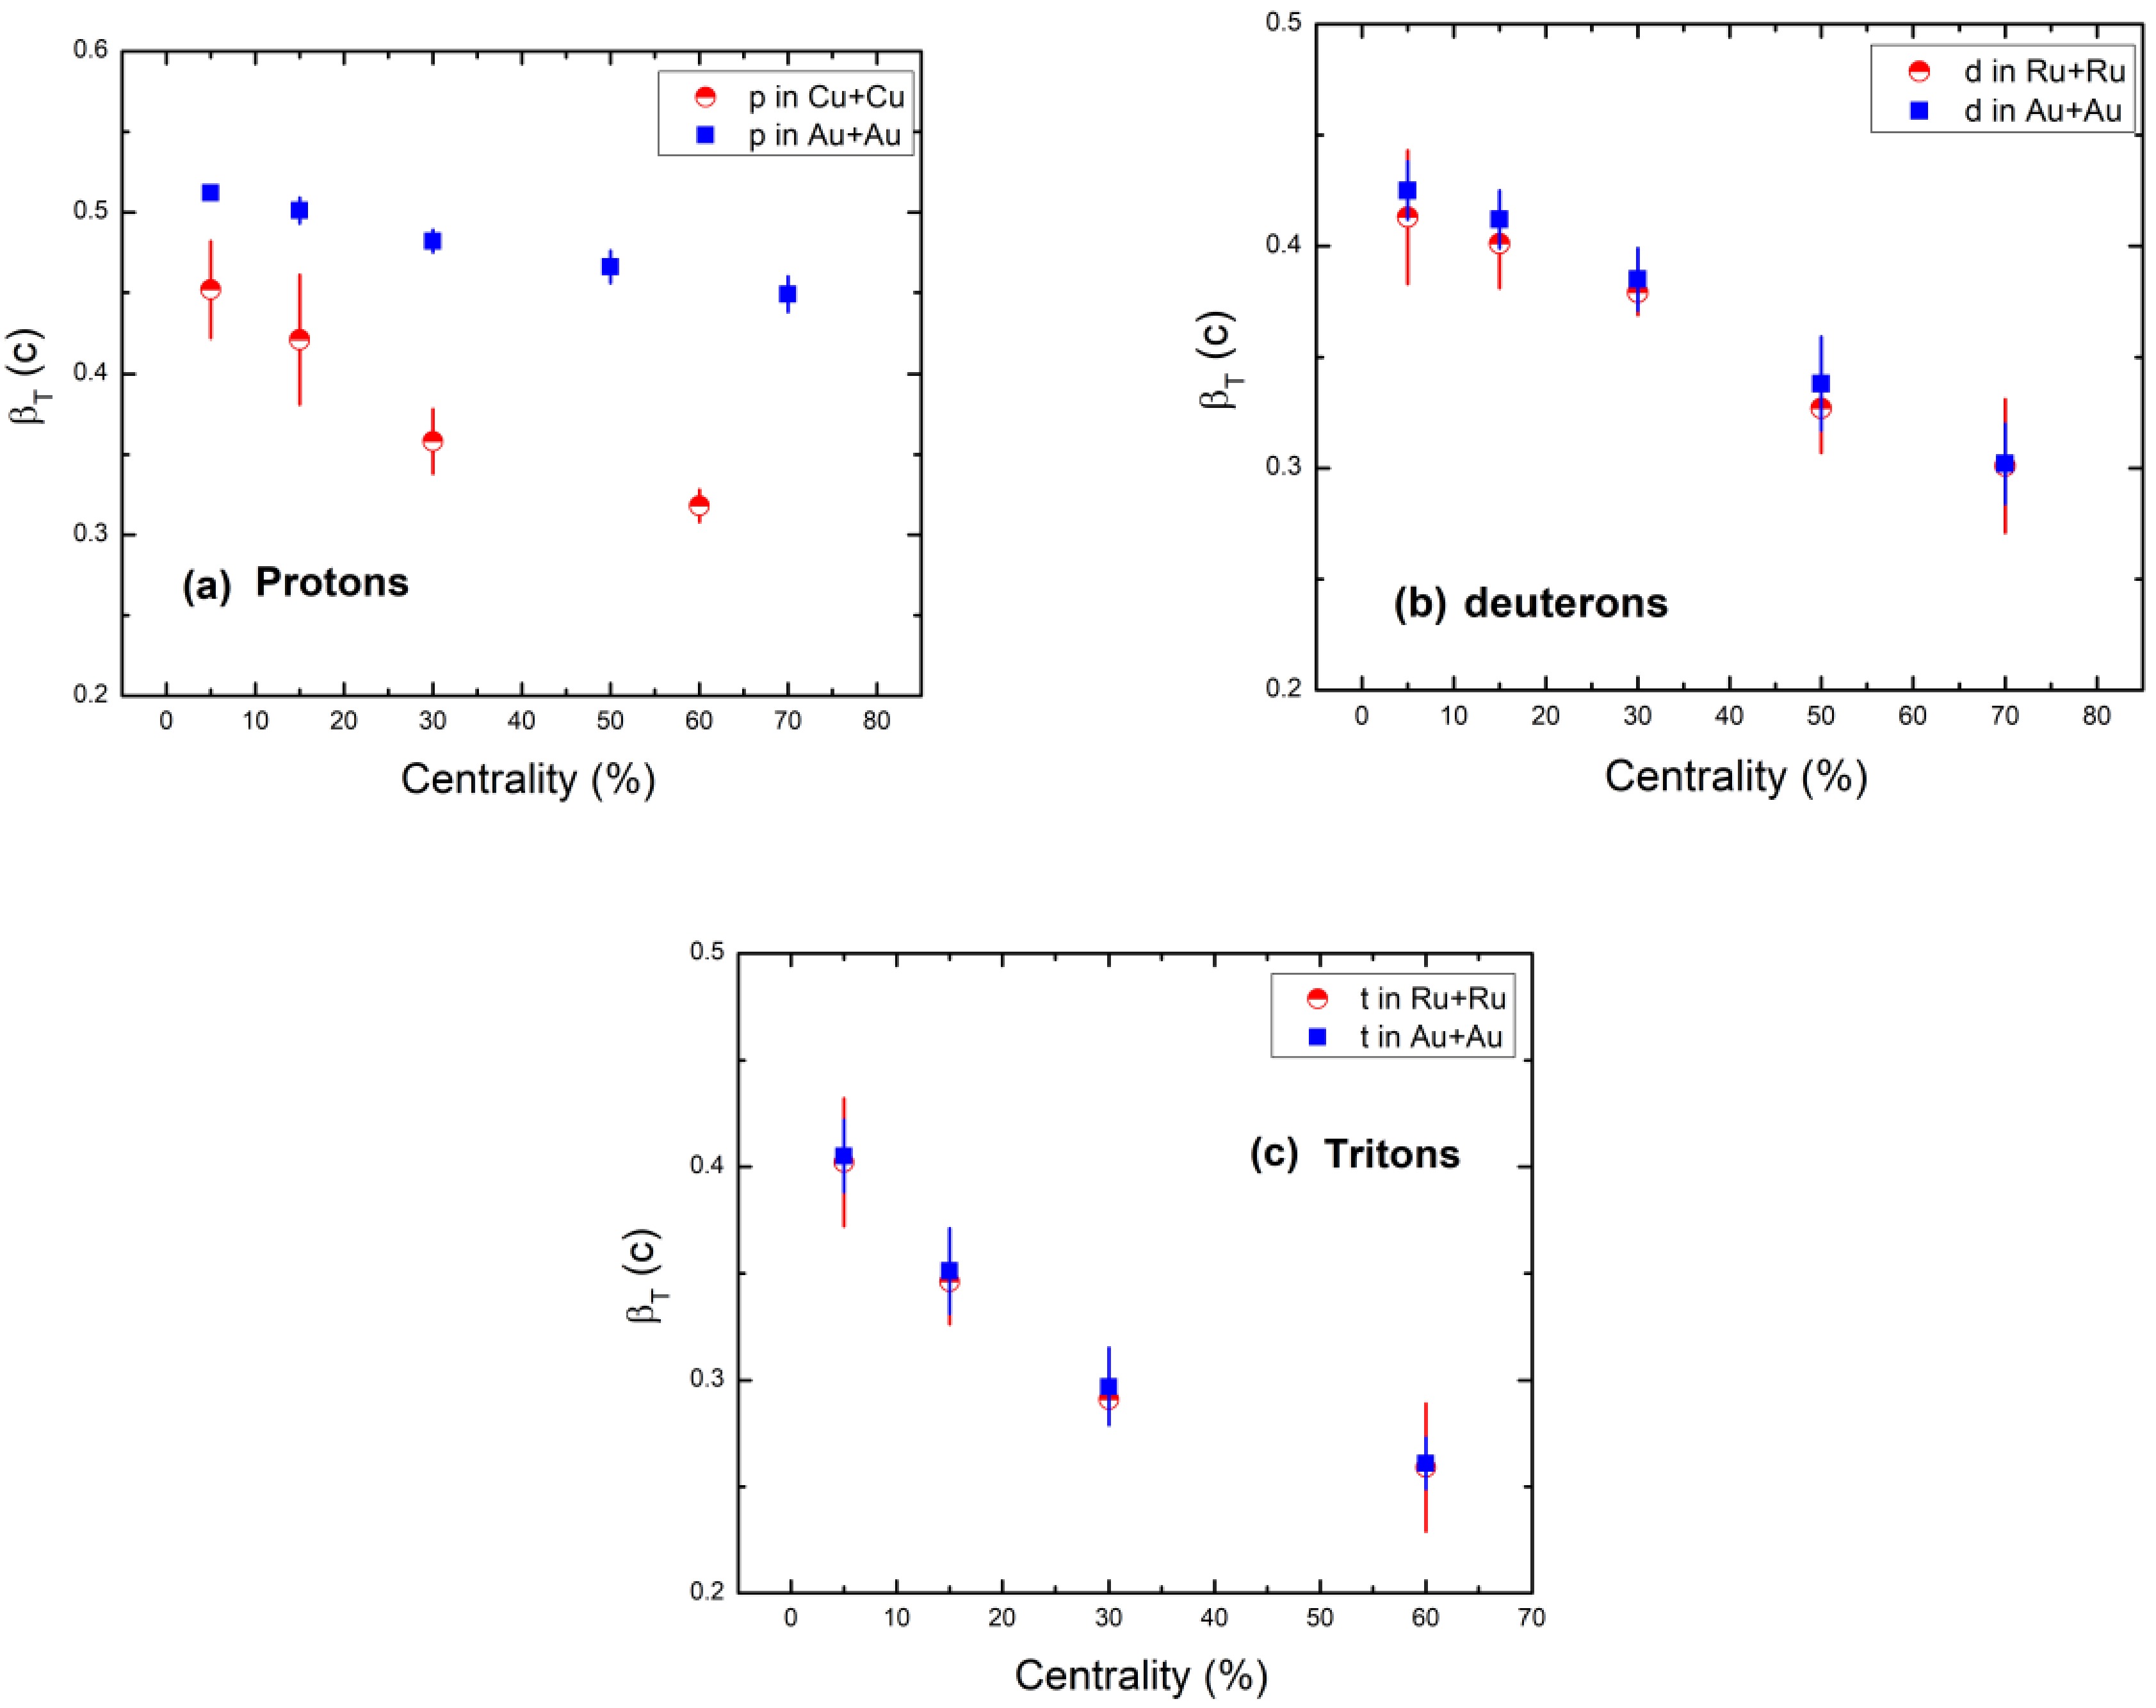
Figure 4. (color online) Centrality dependence of βT of protons (a), deuterons (b), and tritons (c) obtained via the blast wave function with Tsallis statistics (BWTS) function (Eq. (2)).
Figure 5 shows the centrality dependence of the transverse flow velocity βT of protons, deuterons, and tritons obtained in Au+Au collisions (a) as well as protons in Cu+Cu collisions and deuterons and tritons in Ru+Ru collisions (b) at 200 GeV, using Eq. (2). The curves of T0 against centrality for all three hadrons in all colliding systems are given in Fig. 5(c). The transverse flow velocity values in Fig. 5 are maximal at the greater centrality region and minimum for more peripheral collisions. The larger pressure gradient in the collision zone and the formation of a highly compressed system result from scenarios with more central collisions because more energy is delivered into the system. There is a significant amount of potential collision energy in this compressed system. As a result, the system expands with a noticeably high transverse flow velocity as it starts to grow. However, less energy is transferred into the system during peripheral impacts, which lessens the pressure gradient in the collision zone. Consequently, the system experiences less compression, which eventually lowers the transverse flow velocity of the expanding system.
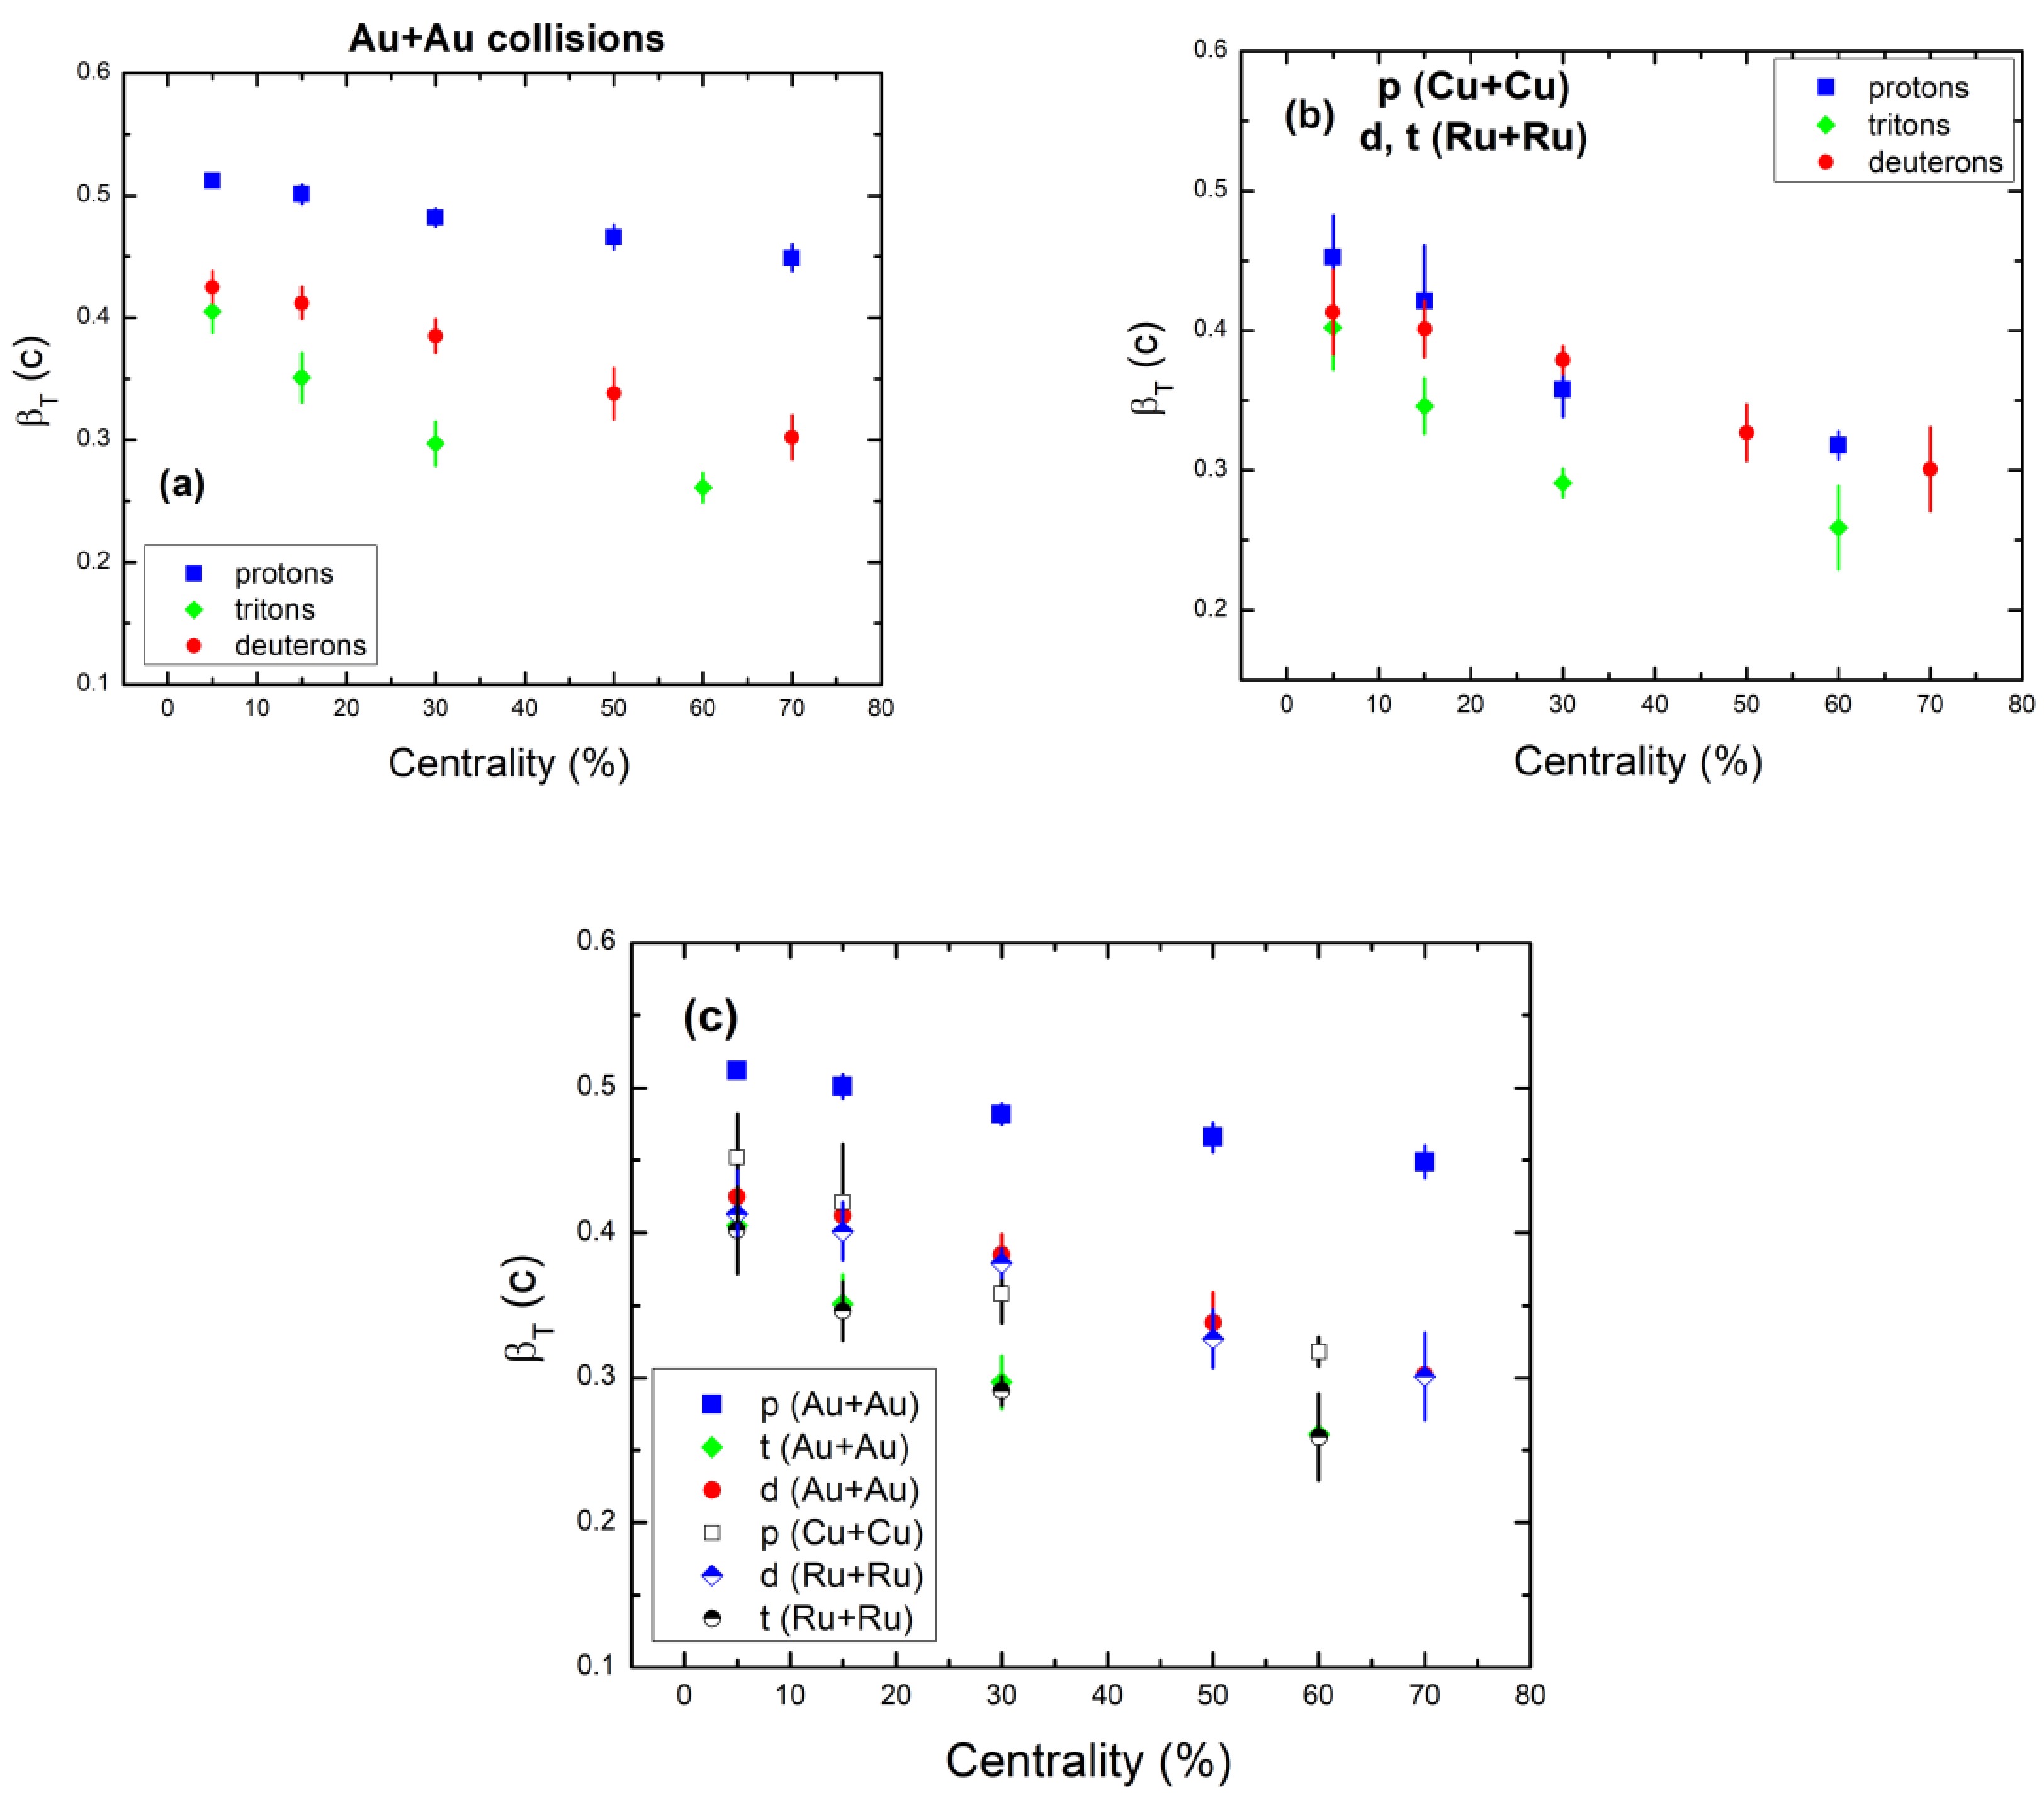
Figure 5. (color online) Centrality dependence of the transverse flow velocity βT of protons, deuterons, and tritons obtained in Au+Au collisions (a) as well as protons in Cu+Cu collisions and deuterons and tritons in Ru+Ru collisions (b) at 200 GeV, using Eq. (2). The curves of βT against centrality for all three hadrons in all colliding systems are given in Fig. 5(c).
The correlation between centrality and transverse flow velocity, as shown in Fig. 5, indicates that as centrality decreases, βT decreases. This effect is explained by the system experiencing more powerful interactions in central collisions, which causes a rapid growth. Furthermore, for heavier particles, βT is smaller than that for lighter particles, likely because heavy particles face more resistance while traversing the dense nuclear medium created in the collisions compared to lighter particles.
Additionally, at such high collision energies, the central region should be in the early stage QGP state. When inferring the temperature of QGP in central collisions based on the hadron spectrum, which is cooled from the QGP state, the phase transition involved must affect the inference of the temperature in the central collision region. This is because the temperature in the central collision region of a high-energy nuclear collision is inferred using a combination of methods, including statistical thermal models, analysis of direct photon and dilepton spectra, hydrodynamic simulations, and the study of heavy quarkonia suppression. Each of these methods provides complementary information about the temperature at different stages of the collision, from the formation of the QGP to its cooling and eventual hadronization. Together, they paint a detailed picture of the extreme conditions created in these collisions. However, we cannot go into detail just yet.
Figures 6 and 7 show the βT dependence on T0 of protons, deuterons, and tritons obtained using Eq. (2). With T, βT depends weakly on centrality for lighter particles and strongly on centrality for heavier particles. As shown in Fig. 6, a negative link between T and βT can be observed, which indicates that as T increases from central to peripheral collisions, βT decreases from central to peripheral collisions. The system's quick expansion and low temperature in central collisions are linked to this negative association. As a result, the above figures demonstrate that the region of the most central collisions quickly expands and has a lower temperature.
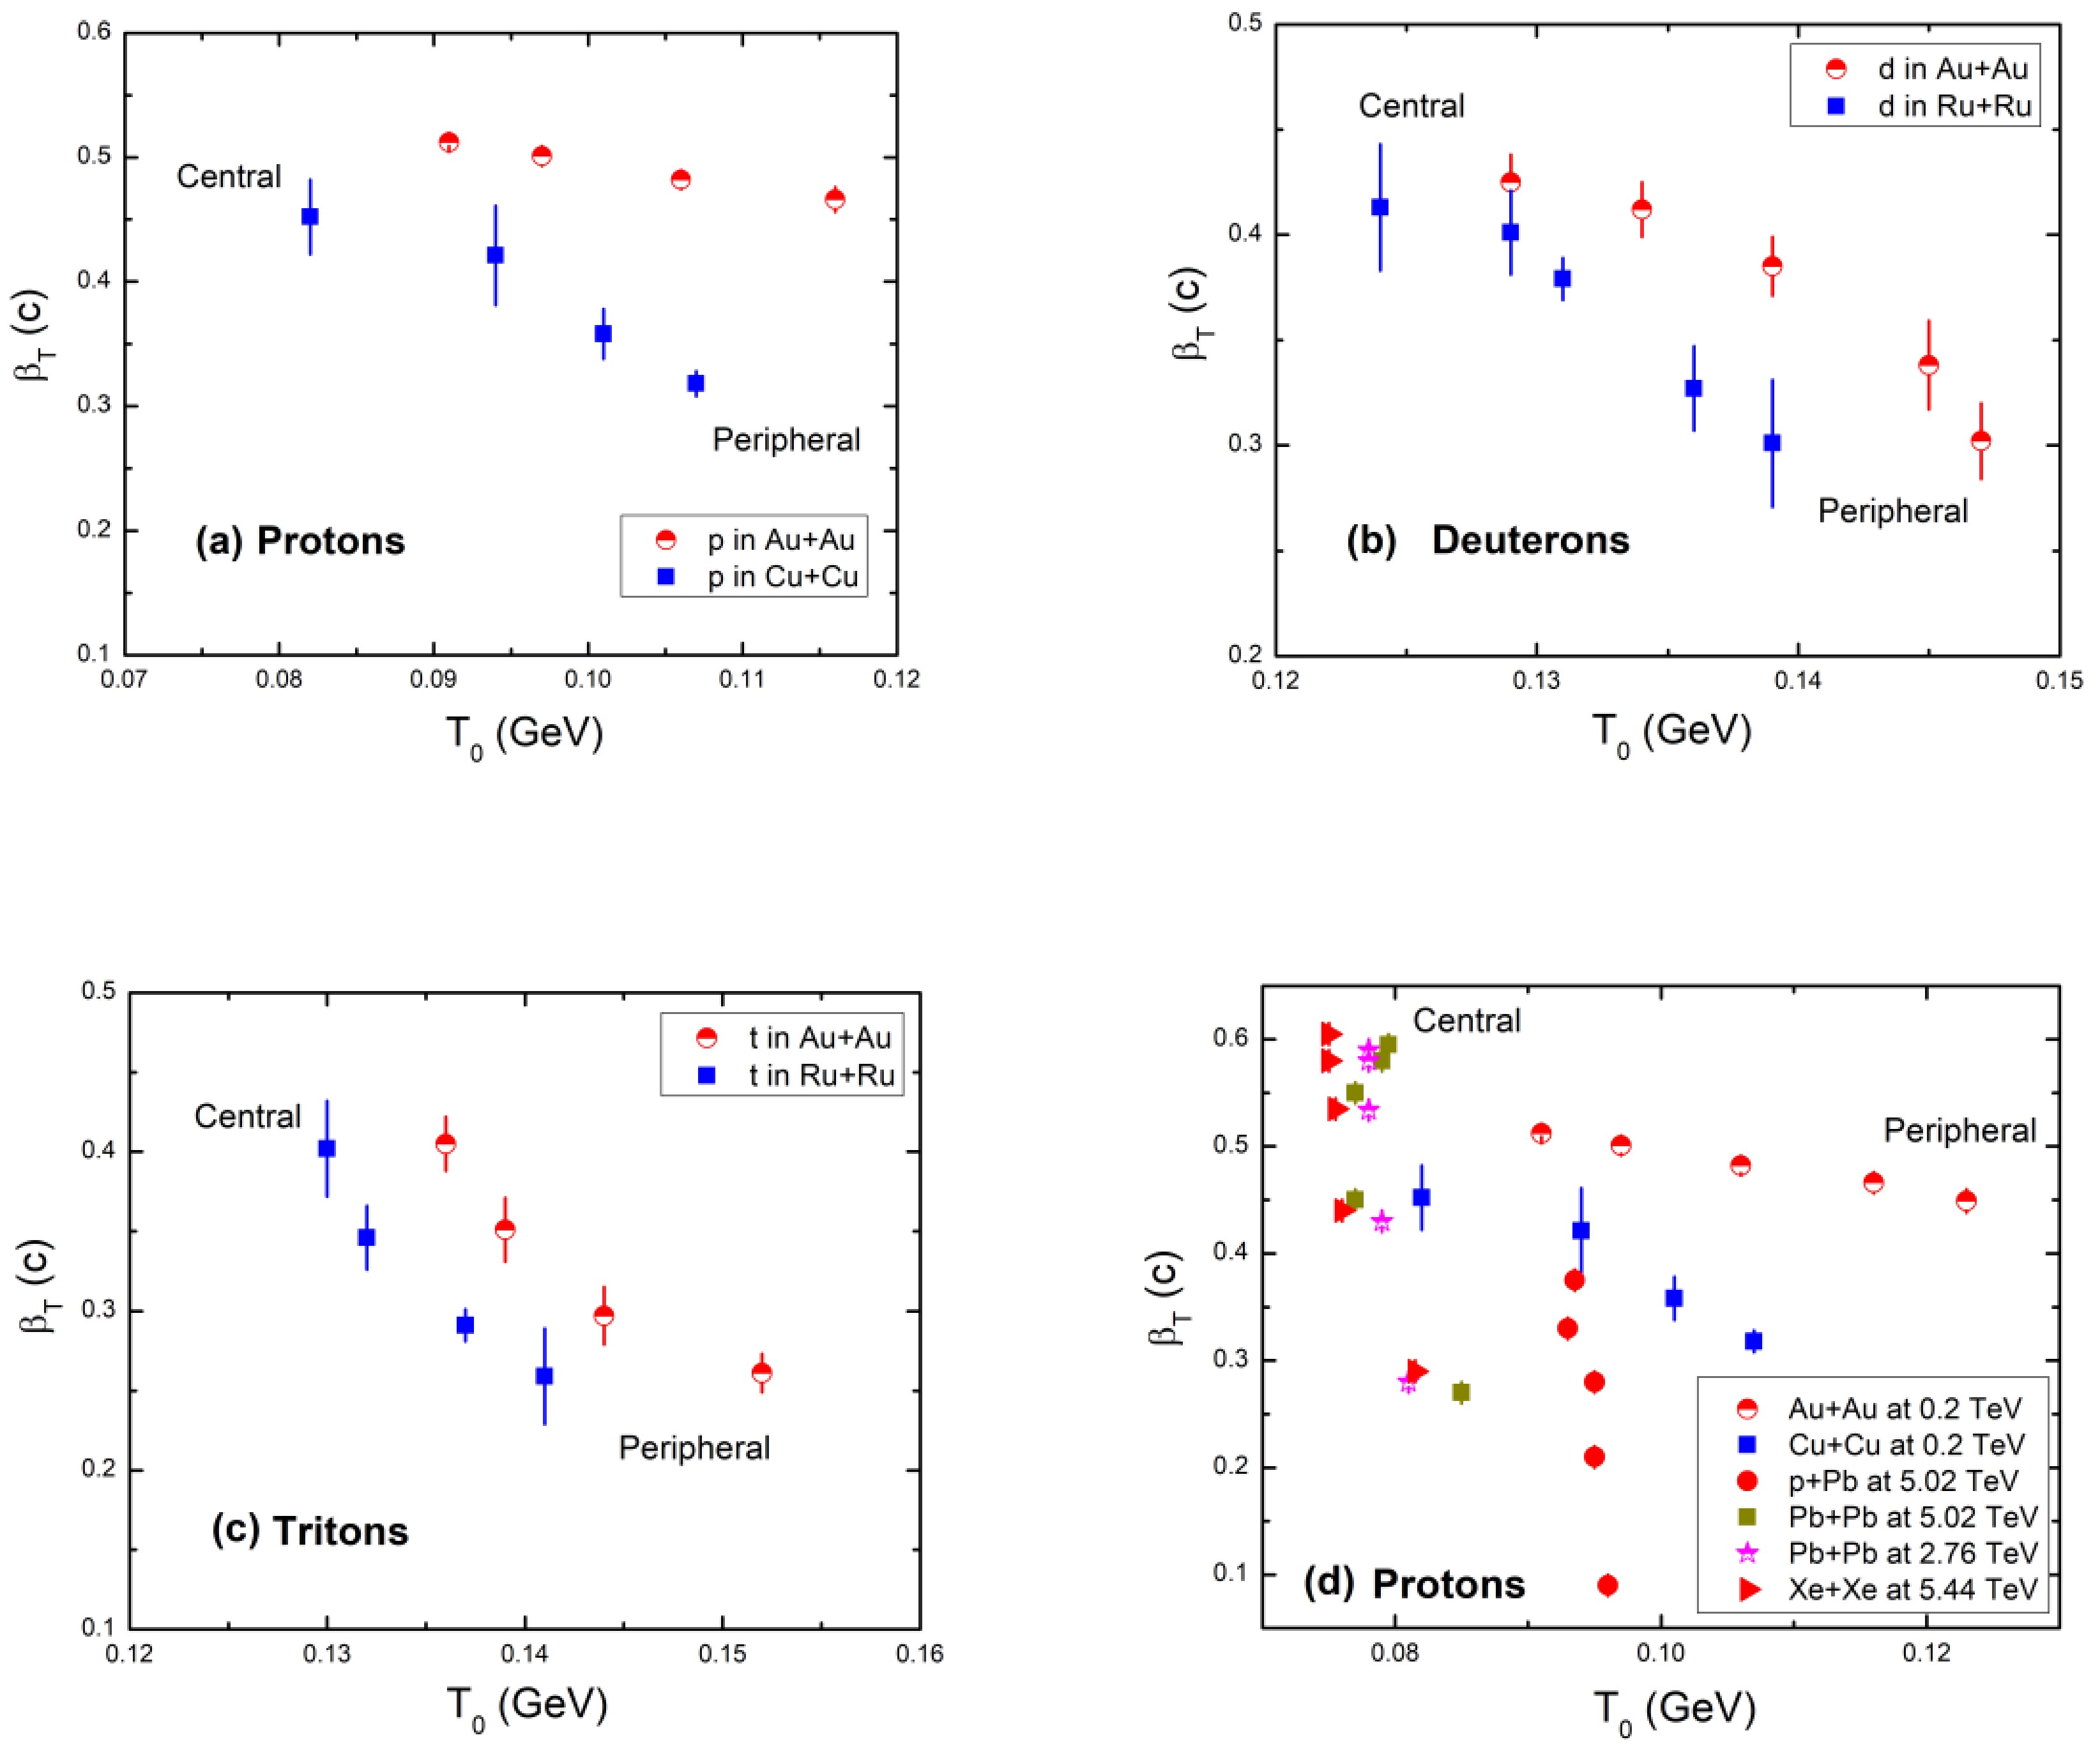
Figure 6. (color online) βT dependence on T0 of protons (a), deuterons (b), and tritons (c) obtained using the blast wave function with Tsallis statistics (BWTS) function (Eq. (2)). Protons (d) obtained in other collisions.
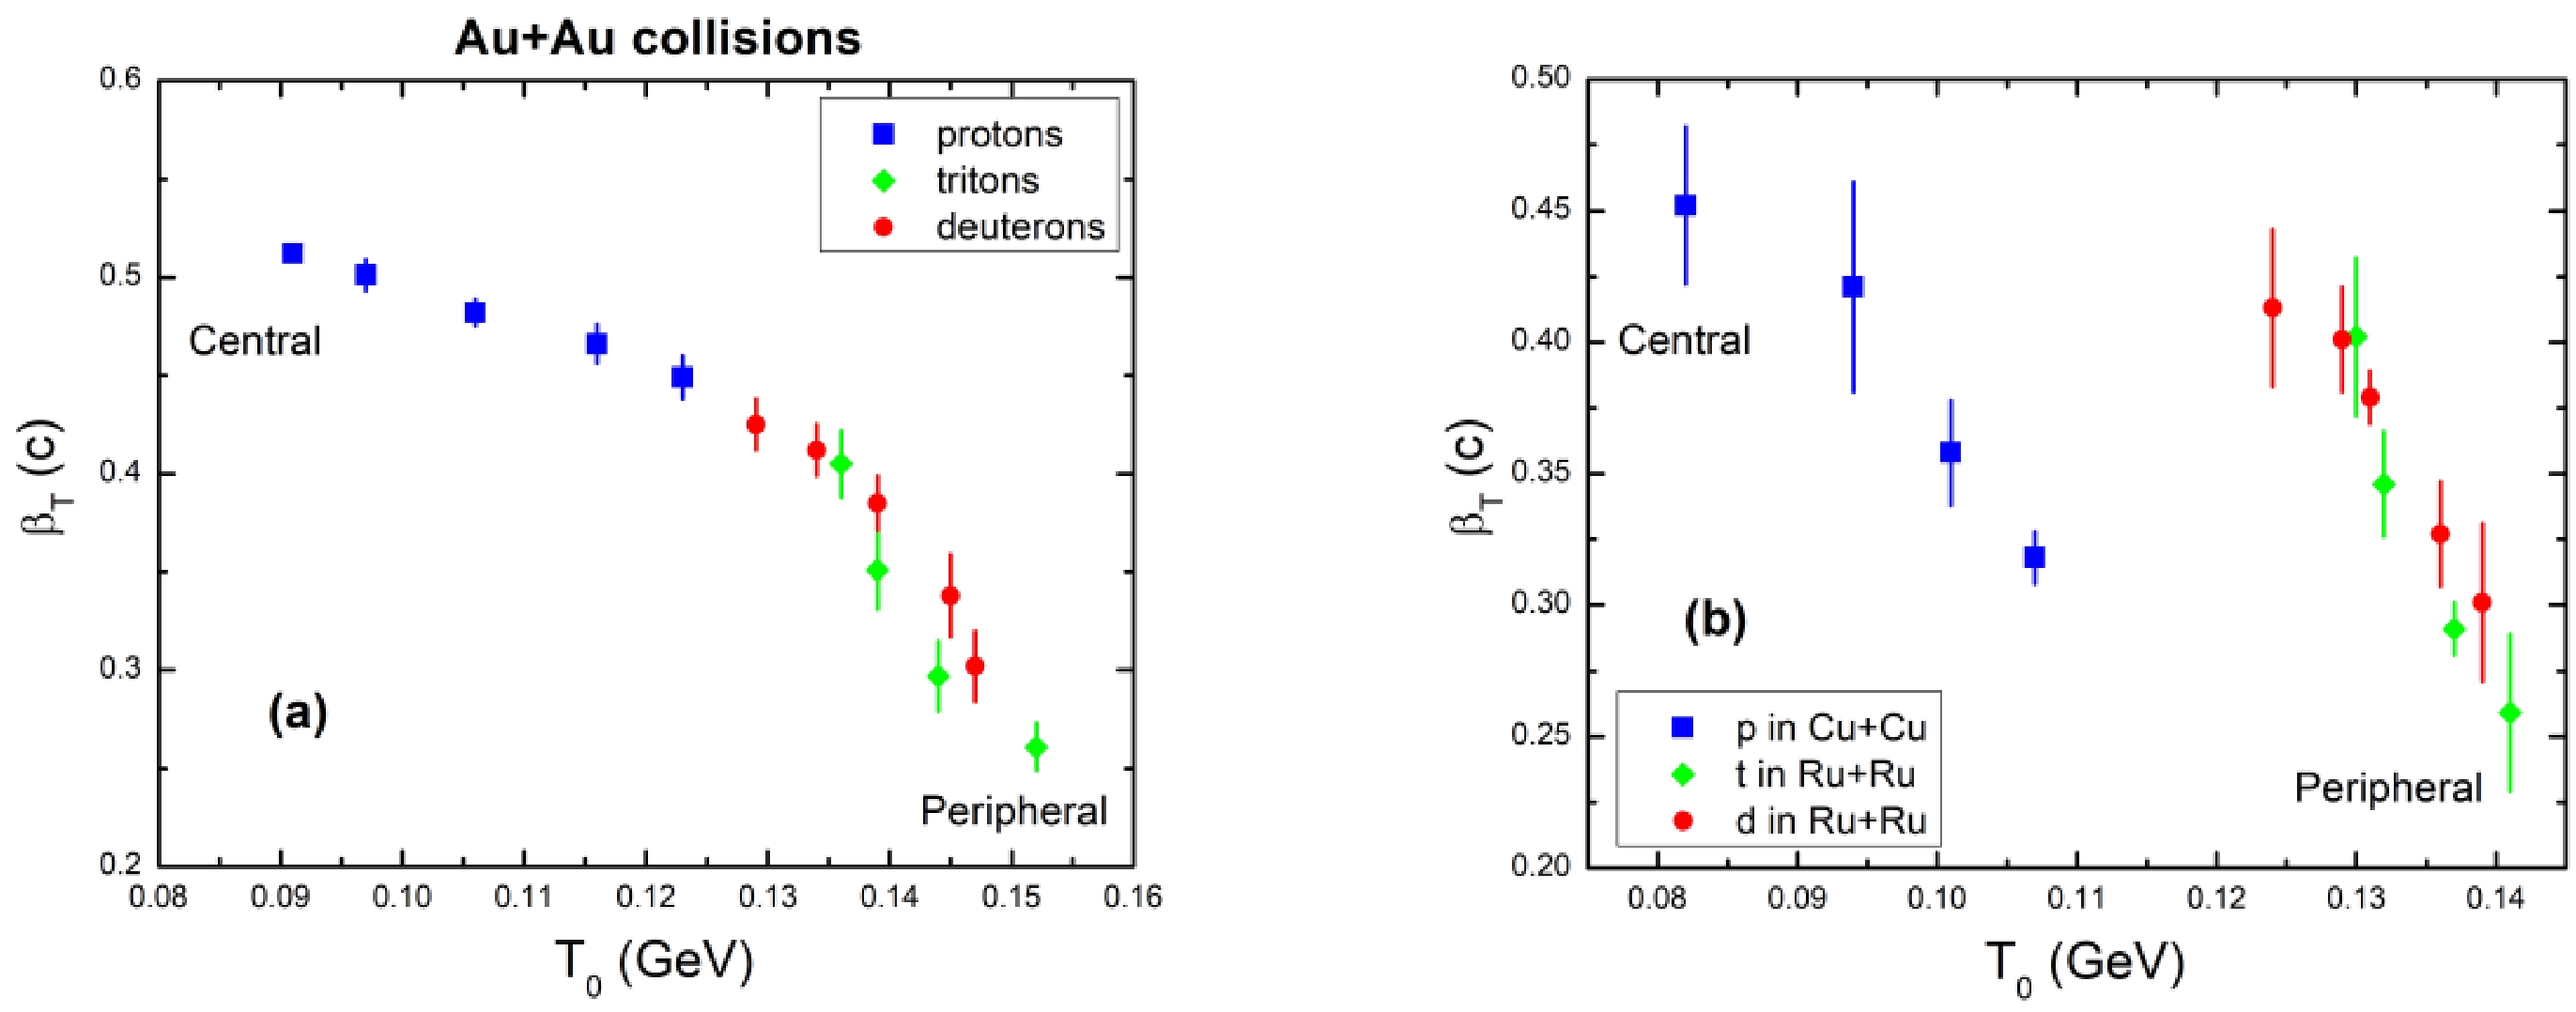
Figure 7. (color online) Dependence of transverse flow velocity βT on T0 of protons, deuterons, and tritons obtained in Au+Au collisions (a) as well as protons in Cu+Cu collisions and deuterons and tritons in Ru+Ru collisions (b) at 200 GeV, using Eq. (2).
In Refs. [48−51], two functions were used by the authors to obtain the temperature and transverse flow velocity: thermodynamically consistent Tsallis function and thermodynamically non-consistent Tsallis function. From the physics perspective, it is preferable to use the thermodynamically consistent Tsallis function with transverse flow velocity, as it satisfies all the thermodynamic relations (such as those for pressure, temperature, and particle and entropy densities) in accordance with the first and second laws of thermodynamics [48−51] . Consequently, the temperature parameter (T) in the thermodynamically consistent Tsallis function [48−51] can be regarded as a true thermodynamic quantity. This is why we use the data from references [48−51] obtained via the thermodynamically consistent Tsallis function for comparison with our analyzed datasets.
In Figs. 6(a)−(c) the negative correlation between the average transverse flow velocity, βT, and kinetic freeze-out temperature, T, is observed for all the three particles. The same negative correlation between βT and T (T0) was shown and proved by calculating the corresponding Pearson linear correlation coefficient between these two parameters in Pb+Pb collisions at
$\sqrt{{s}_{_{NN}}}$ = 2.76 and 5.02 TeV, Xe+Xe collisions at$\sqrt{{s}_{_{NN}}}$ =5.44 TeV, and in p+Pb collisions at$\sqrt{{s}_{_{NN}}}$ =5.02 TeV at the LHC, analyzing the transverse momentum spectra of particles using the Tsallis distribution with the embedded transverse flow used in references [48‒51]. Figure 6(d) shows a comparison of the correlation between the average transverse flow velocity, βT, and kinetic freeze-out temperature, T (T0), for protons from Au+Au and Cu+Cu collisions at$\sqrt{{s}_{_{NN}}}$ =200 GeV, from Pb+Pb collisions at$\sqrt{{s}_{_{NN}}}$ = 2.76 and 5.02 TeV, Xe+Xe collisions at$\sqrt{{s}_{_{NN}}}$ =5.44 TeV, and in p+Pb collisions at$\sqrt{{s}_{_{NN}}}$ =5.02 TeV at the LHC [48−51] .The following results are observed from the study of Fig. 6(d):
(a) The increase in T is not highly dependent on βT in cases of all collisions at LHC energies. Only slight changes are observed in the values of T compared to βT.
(b) The increase in T is also not highly dependent on centrality in cases of all collisions at LHC energies.
(c) The values of βT decrease and change rapidly as centrality changes from most central to most peripheral collisions in symmetric and asymmetric LHC collisions.
(d) The values of βT are lower in cases of p+Pb collisions at 5.02 TeV compared to other LHC collisions at each centrality bin. This indicates a non-equilibrium state of matter with lower βT values.
(e) The difference between the slopes of the plots of βT against T of protons at RHIC and LHC energies could be due to the energy ranges or the different functions used to extract the freeze-out parameters. For this, a detailed study is needed using both the equations to obtain the data and compare the results of q-parameters from both fittings.
Figure 7 shows the transverse flow velocity βT dependency on T0 of protons, deuterons, and tritons obtained in Au+Au collisions (a) as well as protons in Cu+Cu collisions and deuterons and tritons in Ru+Ru collisions (b) at 200 GeV, using Eq. (2). In Fig. 7(a) the association between T0 and βT of all three hadrons obtained in Au+Au collisions is given. It is clear that two-dimensional anti-correlation overlapping bands are present for protons, deuterons, and tritons, in cases of T0 and βT. The magnitude of βT decreases as T0 rises. Therefore, the connection between T and βT is found to be negative, as in earlier research [14]. However, it was also found to be positive in several studies [24, 47]. It is true that there are positive and negative correlations, and each has an explanation. In central collisions, a longer-lasting flame is linked to a negative correlation. The fact that the transverse flow velocity and kinetic freeze-out temperature are positively correlated suggests that in high energy collisions, particles with higher thermal energies also show stronger collective motion. Because of the increased energy transfer into the system caused by the peripheral collisions, the system's excitation function increases, which hadronizes highly thermalized particles. In contrast, the system squeezes and then expands quickly with greater force since the same higher energy is introduced into it at a higher centrality.
Figs. 8 and 9 show the q parameter dependence on centrality of protons, deuterons, and tritons obtained in Au+Au collisions (a) as well as protons in Cu+Cu collisions and deuterons and tritons in Ru+Ru collisions (b) at 200 GeV, using the BWTS function (Eq. (2)). As shown, q is lower in central collisions. However, q increases as we move from central to peripheral collisions. When it comes to particle mass, this parameter varies, with lighter particles having greater values of q. The closeness of q to 1 ensures that the system remains in an equilibrium state. Multiplicity of heavier particles is less compared to lighter particles, so the system seems more in equilibrium in heavier particles cases compared to light particle (proton) cases. This shows that the triton system was more in the equilibrium state than the deuteron and proton systems.
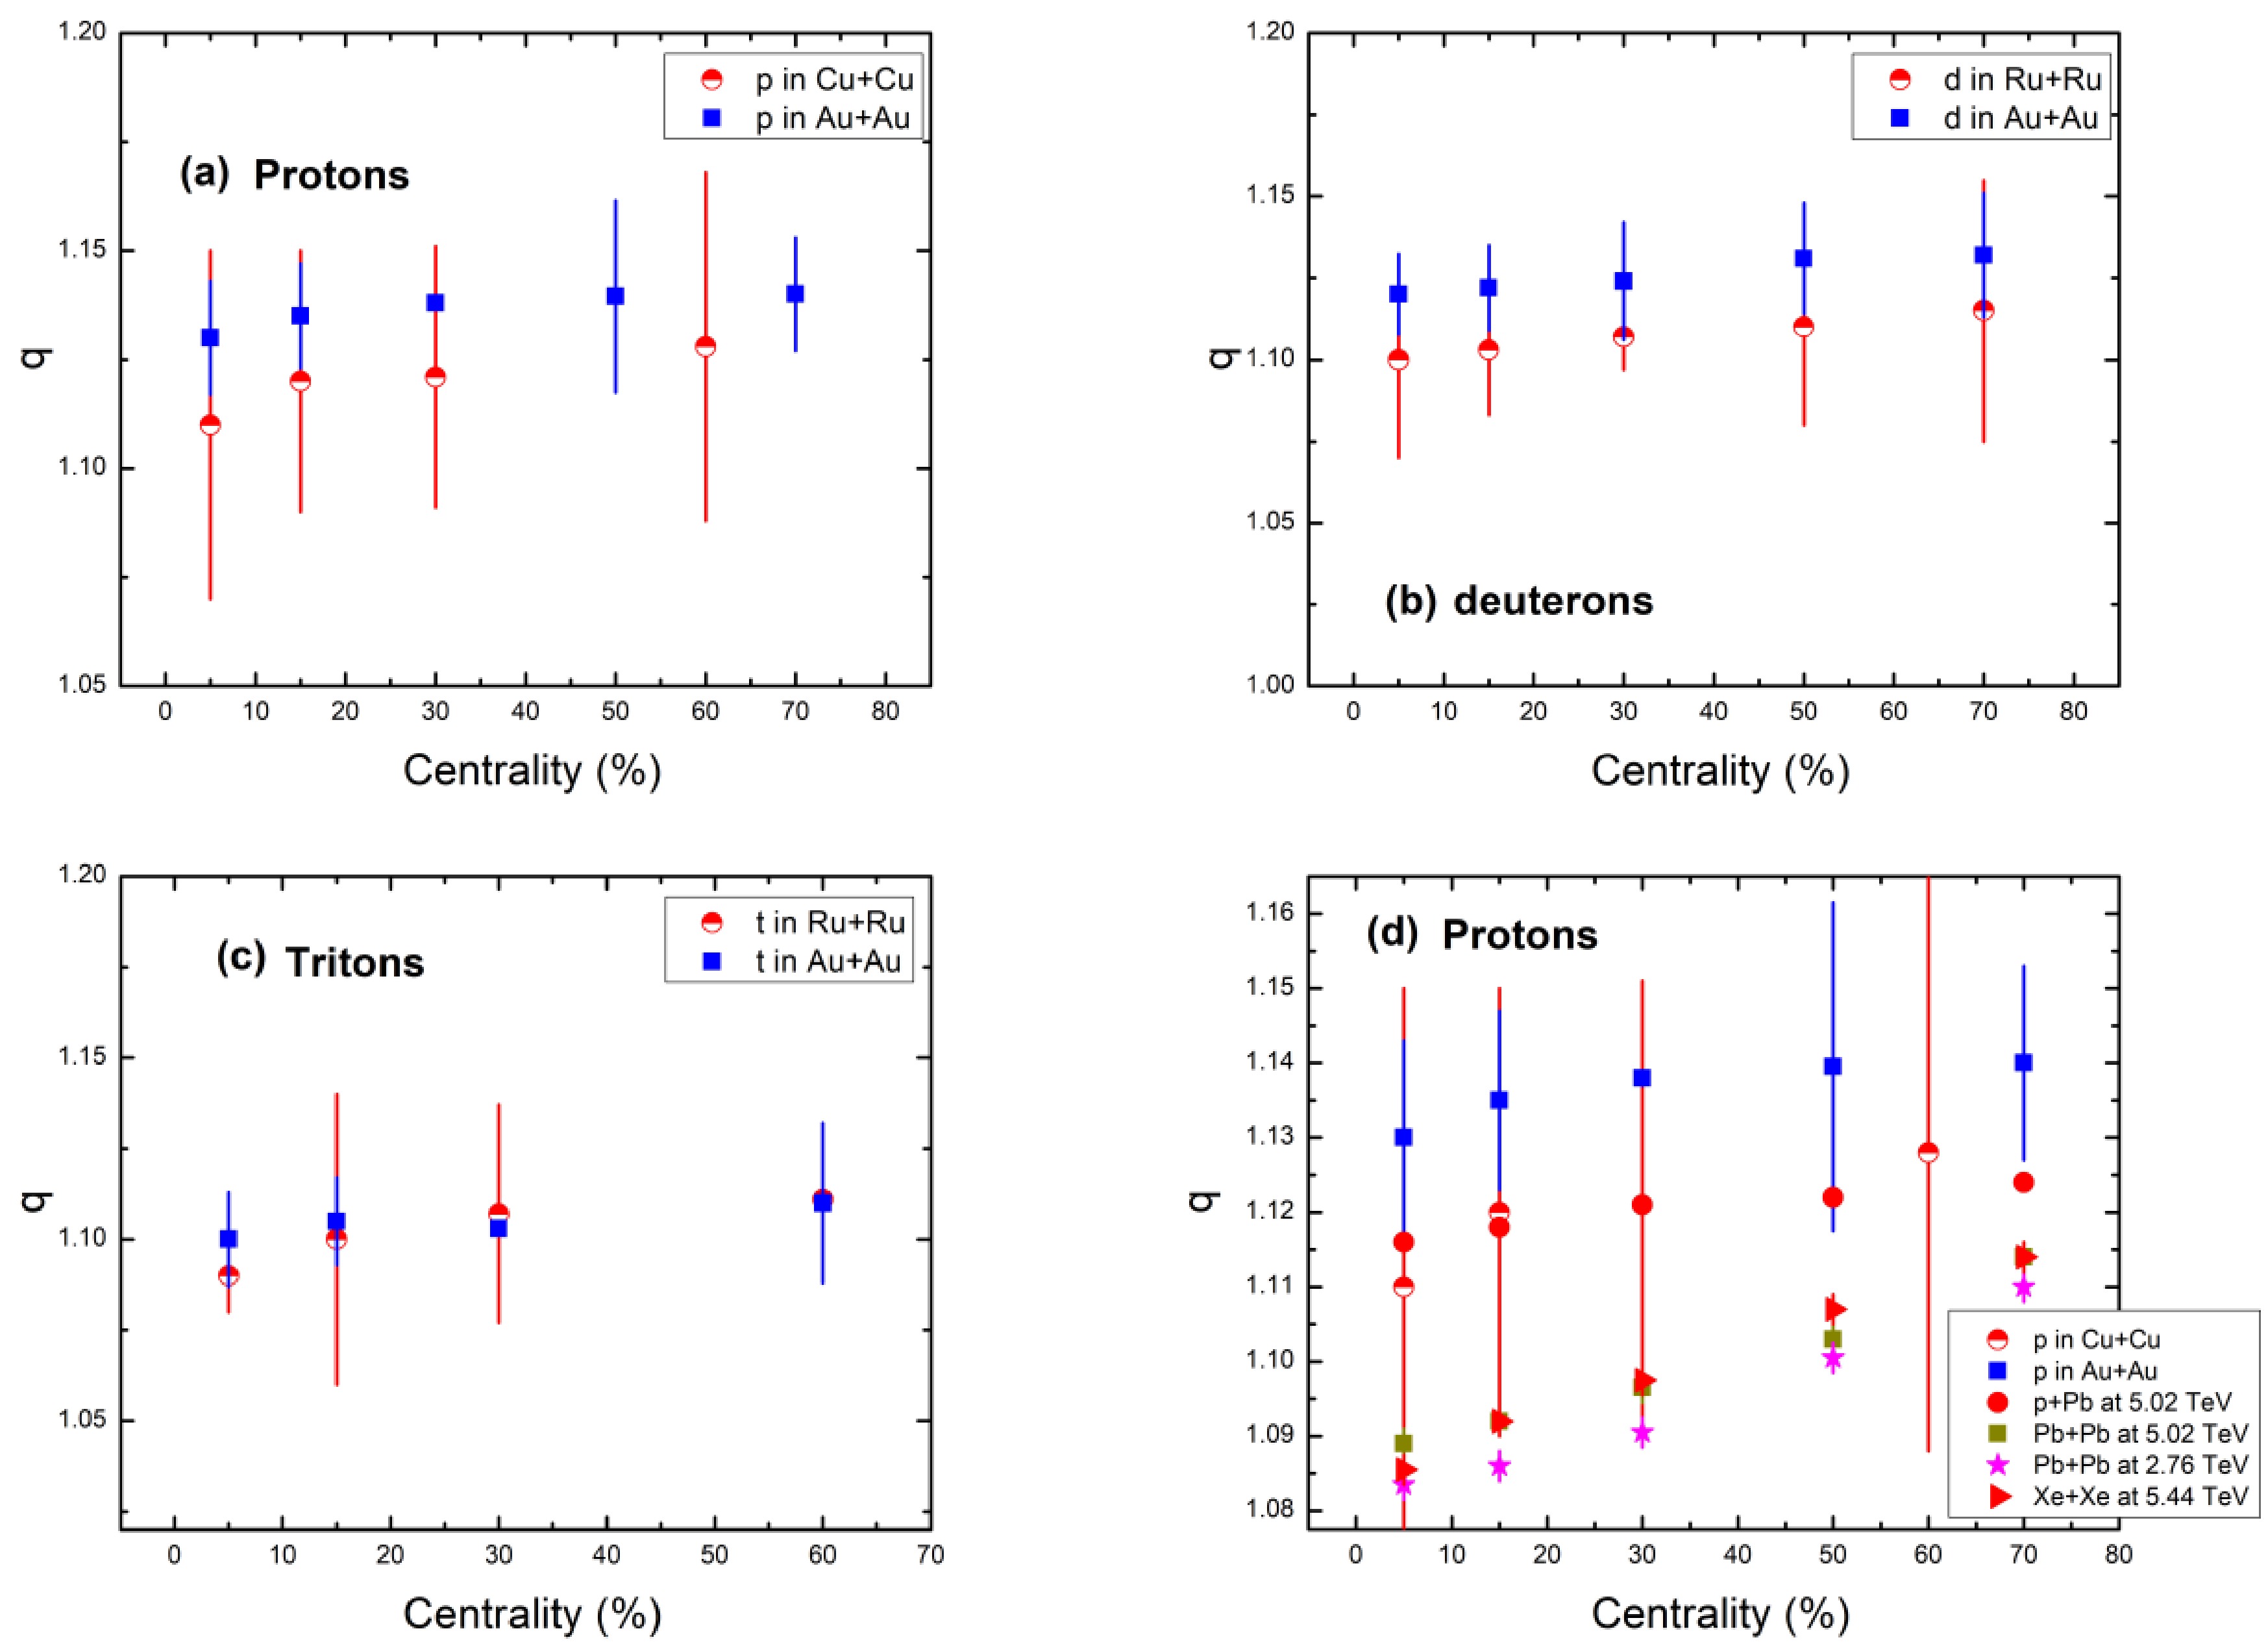
Figure 8. (color online) Dependence of q parameter on centrality of protons (a), deuterons (b), and tritons (c) obtained using Eq. (2). Protons in collisions at the LHC and RHIC (d).
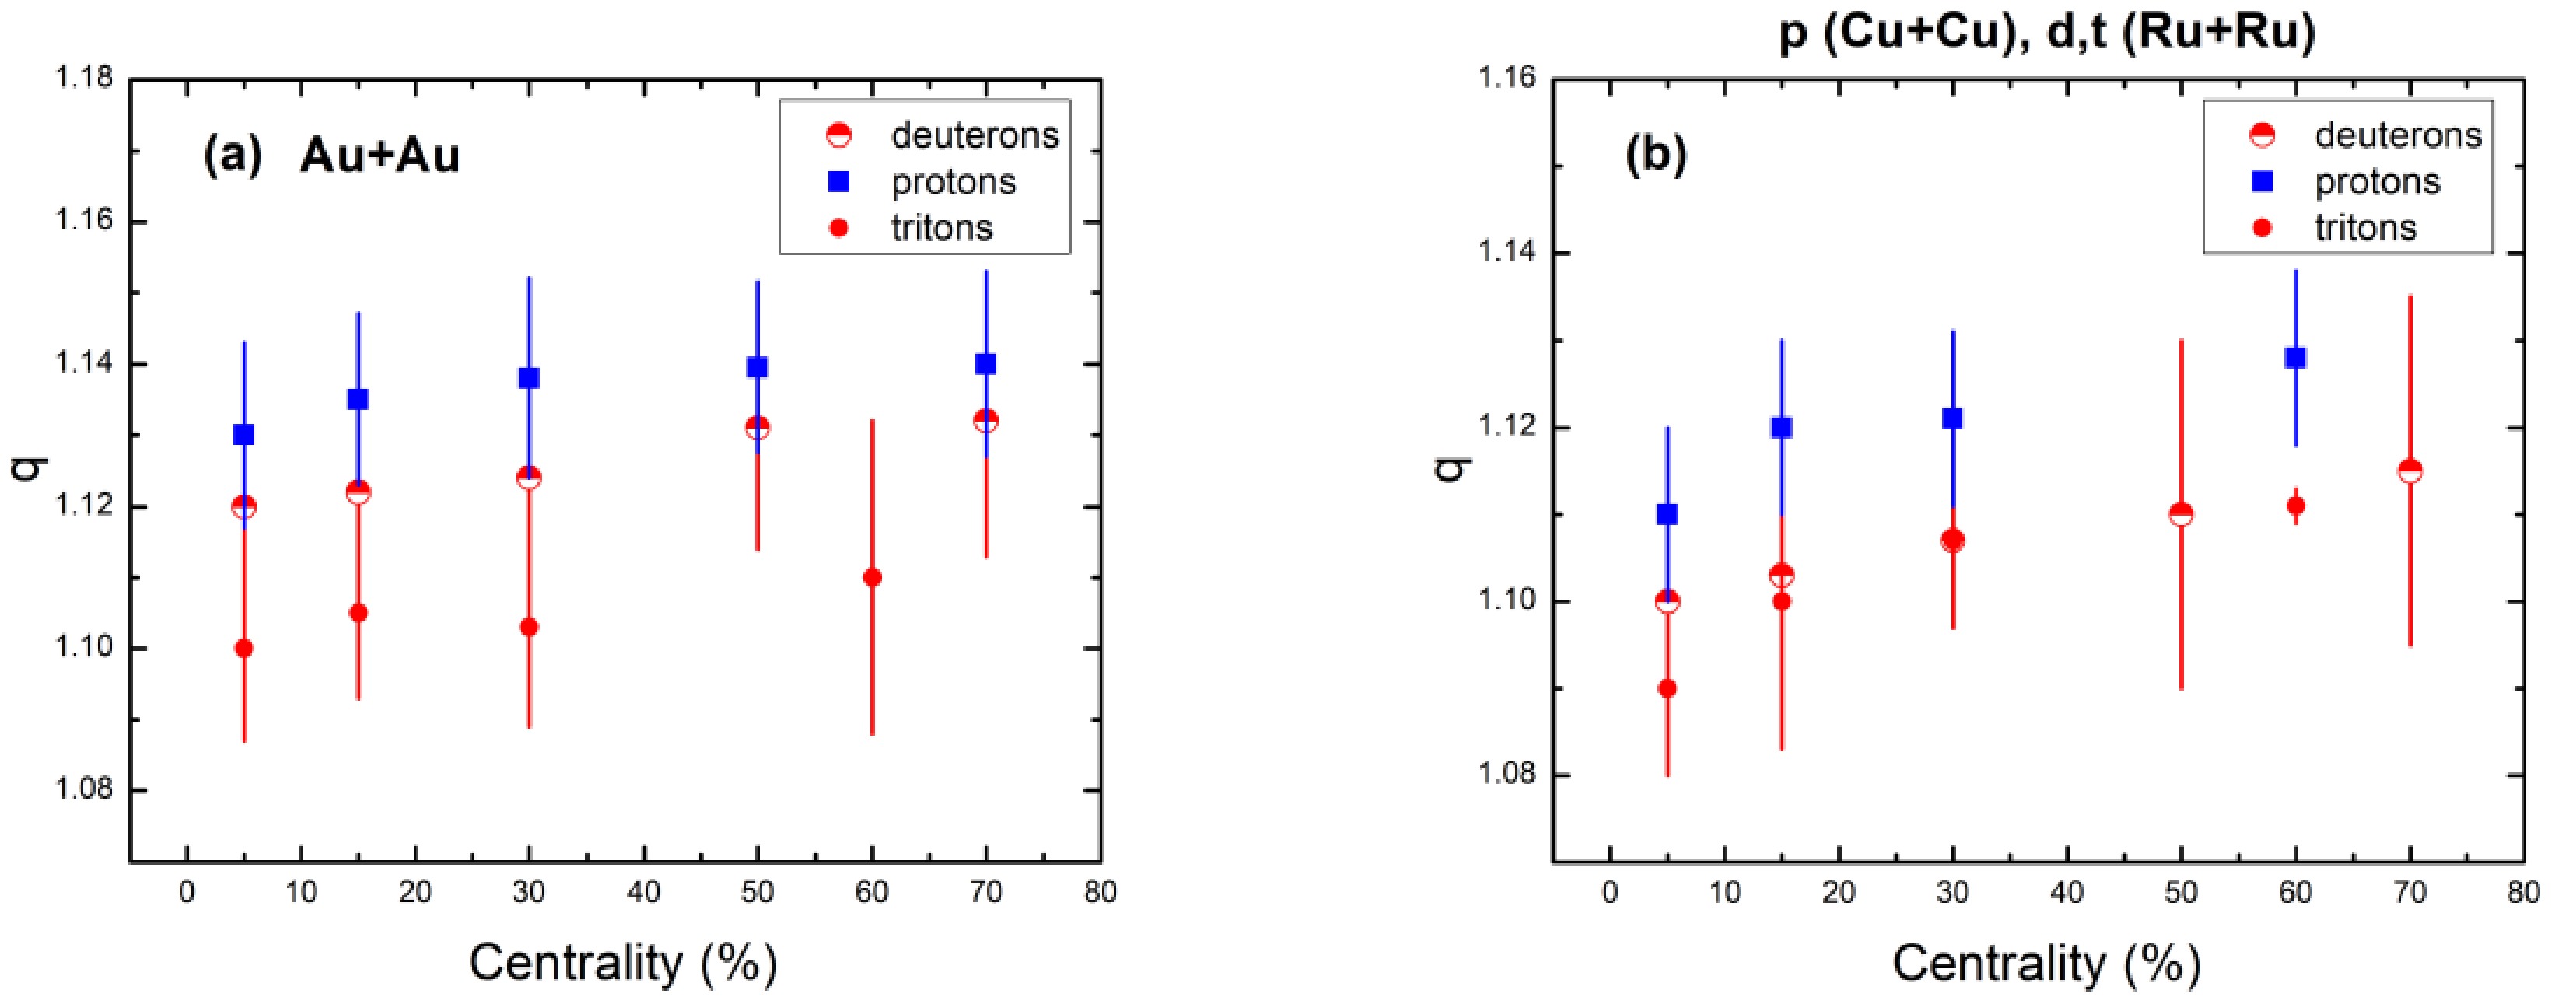
Figure 9. (color online) Dependence of q-parameter on centrality of protons, deuterons, and tritons obtained in Au+Au collisions (a) as well as protons in Cu+Cu collisions and deuterons and tritons in Ru+Ru collisions (b) at 200 GeV, using Eq. (2).
Overall, the non-extensivity parameter q decreases with increasing centrality of the studied heavy-ion collisions, and heavier mass particles have smaller values of q, which implies higher degrees of thermalization and equilibrium in more central collisions and for heavier particles. The same result - a decrease in q with an increase in centrality and that heavier particles have smaller q values - has been obtained recently from the analysis of the experimental pT spectra of identified particles in Pb+Pb, Xe+Xe, and p+Pb collisions at the TeV energy range at the LHC using the Tsallis distribution with the embedded transverse flow velocity [48‒51] .
We compare our correlation results between q and collision centrality with the results of the above four papers [48−51] , obtained from the analysis of the experimental pT spectra of protons in Pb+Pb, Xe+Xe, and p+Pb collisions at the TeV energy range at the LHC. It is important to mention that the correlations between various pairs of parameters of the Tsallis distribution with the embedded transverse flow in references [48−51] were achieved by plotting 1-sigma confidence ellipses and calculating the corresponding Pearson coefficients of the linear correlation between the parameters, which presents the justified quantitative results on the correlations between the obtained parameters. The Pearson correlation coefficient, ϒxy, quantifies the strength of the linear correlation between two parameter sets, ranging from −1 to +1. A ϒxy of −1 indicates a complete negative linear correlation (anti-correlation), +1 indicates a complete positive linear correlation, and (ϒ xy = 0 ) indicates no linear correlation between the datasets [48−51] .
The quanitatively justified results on the correlations between various parameters of the Tsallis function with the embedded transverse flow obtained in [48−51] for protons are compared with our obtained results in symmetric heavy-ion Au+Au and Cu+Cu collisions at 200 GeV at the RHIC.
Figure 8(d) shows the q parameter dependence on centrality of protons obtained in Au+Au, Cu+Cu at 200 GeV at the RHIC using the BWTS function, and Pb+Pb (2.76 and 5.02 TeV), Xe+Xe (5.44 TeV), and p+Pb (5.02 TeV) collisions at the LHC using the Tsallis distribution with the embedded transverse flow [48−51]. It reveals the dependence of the parameter q on centrality. As shown, q increases as we move from central to peripheral collisions for all the collisions sets. However, for protons obtained in Pb+Pb at 2.76 TeV, it has the lowest values among all. Parameter q values from Pb+Pb at 5.02 TeV collisions and Xe+Xe collisions at 5.44 TeV are slightly higher than those of Pb+Pb at 2.76 TeV but are in agreement with each other. This indicates that all three systems are very much near to their equilibrium states, owing to the symmetric nature of collision sets. It is also confirmed by the results of p+Pb collisions at 5.02 TeV, an asymmetric system, where q has larger values than the above discussed collisions set values. It shows a strong dependence of q parameter on the geometry of the colliding system as well as the energy of the system. Lower (near to one) and approximately equal values of q at the central region in Pb+Pb at 5.02 TeV and 2.76 TeV collisions Xe+Xe collisions at 5.44 TeV could also be attributed to the inner medium created in the collisions. Here, a large number of protons are produced along with a smaller portion of heavier particles owing to head on collisions of the same heavy ions with energies in the TeV range. Thus, the system seems to be in equilibrium as it is composed of approximately the same particles, i.e., protons.
Results from Au+Au and Cu+Cu at 200 GeV have much greater values of the q parameter than the other collision sets at various higher energies. This could be due to the lower energy of the Au+Au and Cu+Cu systems, which may have produced some protons in the system along other heavier particles and thus created a non-equilibrium state of the system, as we know that the proximity of q to 1 indicates that the system is in a state of equilibrium. Since the multiplicity of lighter particles is larger than that of heavier particles in the high energy symmetric collisions, the system appears to be more in equilibrium compared to the asymmetric system.
The centrality-dependent freeze-out volume is shown in Figs. 10 and 11. The decrease in centrality results in a decrease in the volume of the freeze-out, mostly because the number of participating nucleons is decreasing. Because parton re-scattering leads to more binary interactions in central collisions, the system with more players can quickly find equilibrium. The larger gap between volume versus centrality plots in the case of protons, as shown in Fig. 10(a), is also due to the number of participating nucleons. The number of participating nucleons in Au+Au collisions is greater than those present in Cu+Cu collisions at the same colliding energies; hence, the volume values of protons in Au+Au collisions are also greater than those obtained in case of Cu+Cu collisions.
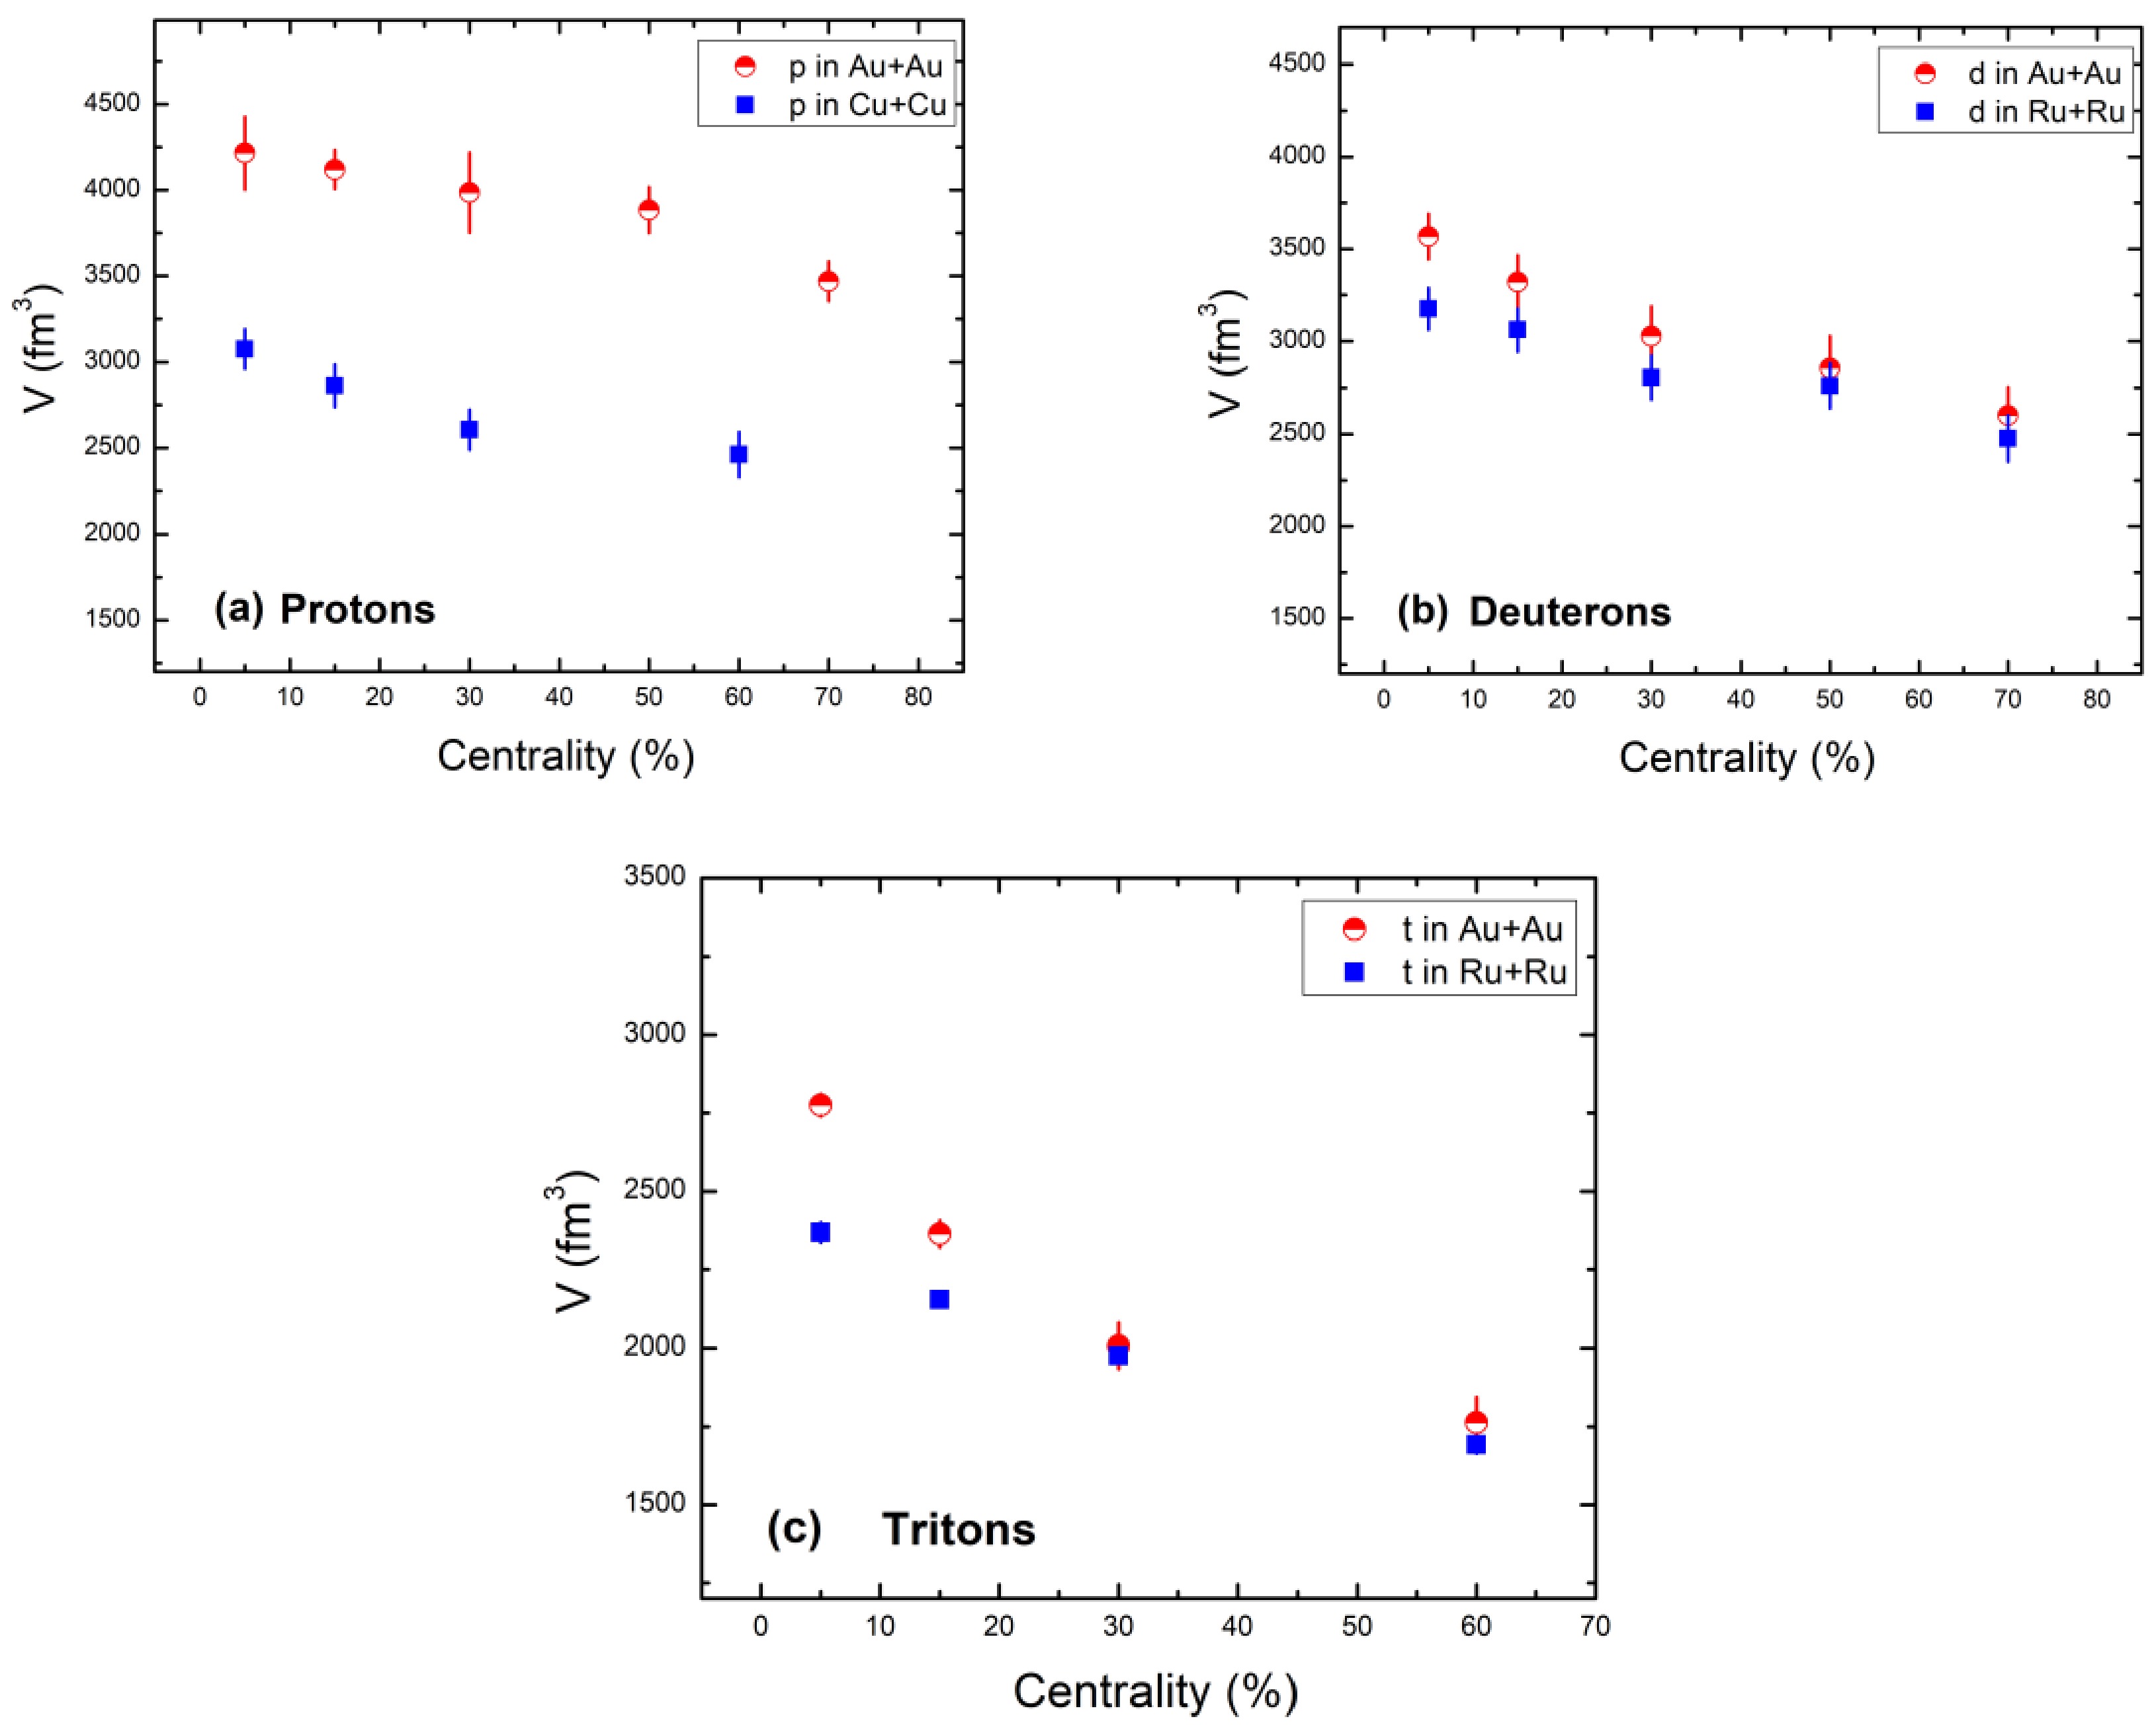
Figure 10. (color online) Dependence of freeze out volume (V) parameter on centrality of protons (a), deuterons (b), and tritons (c) obtained using Eq. (2).
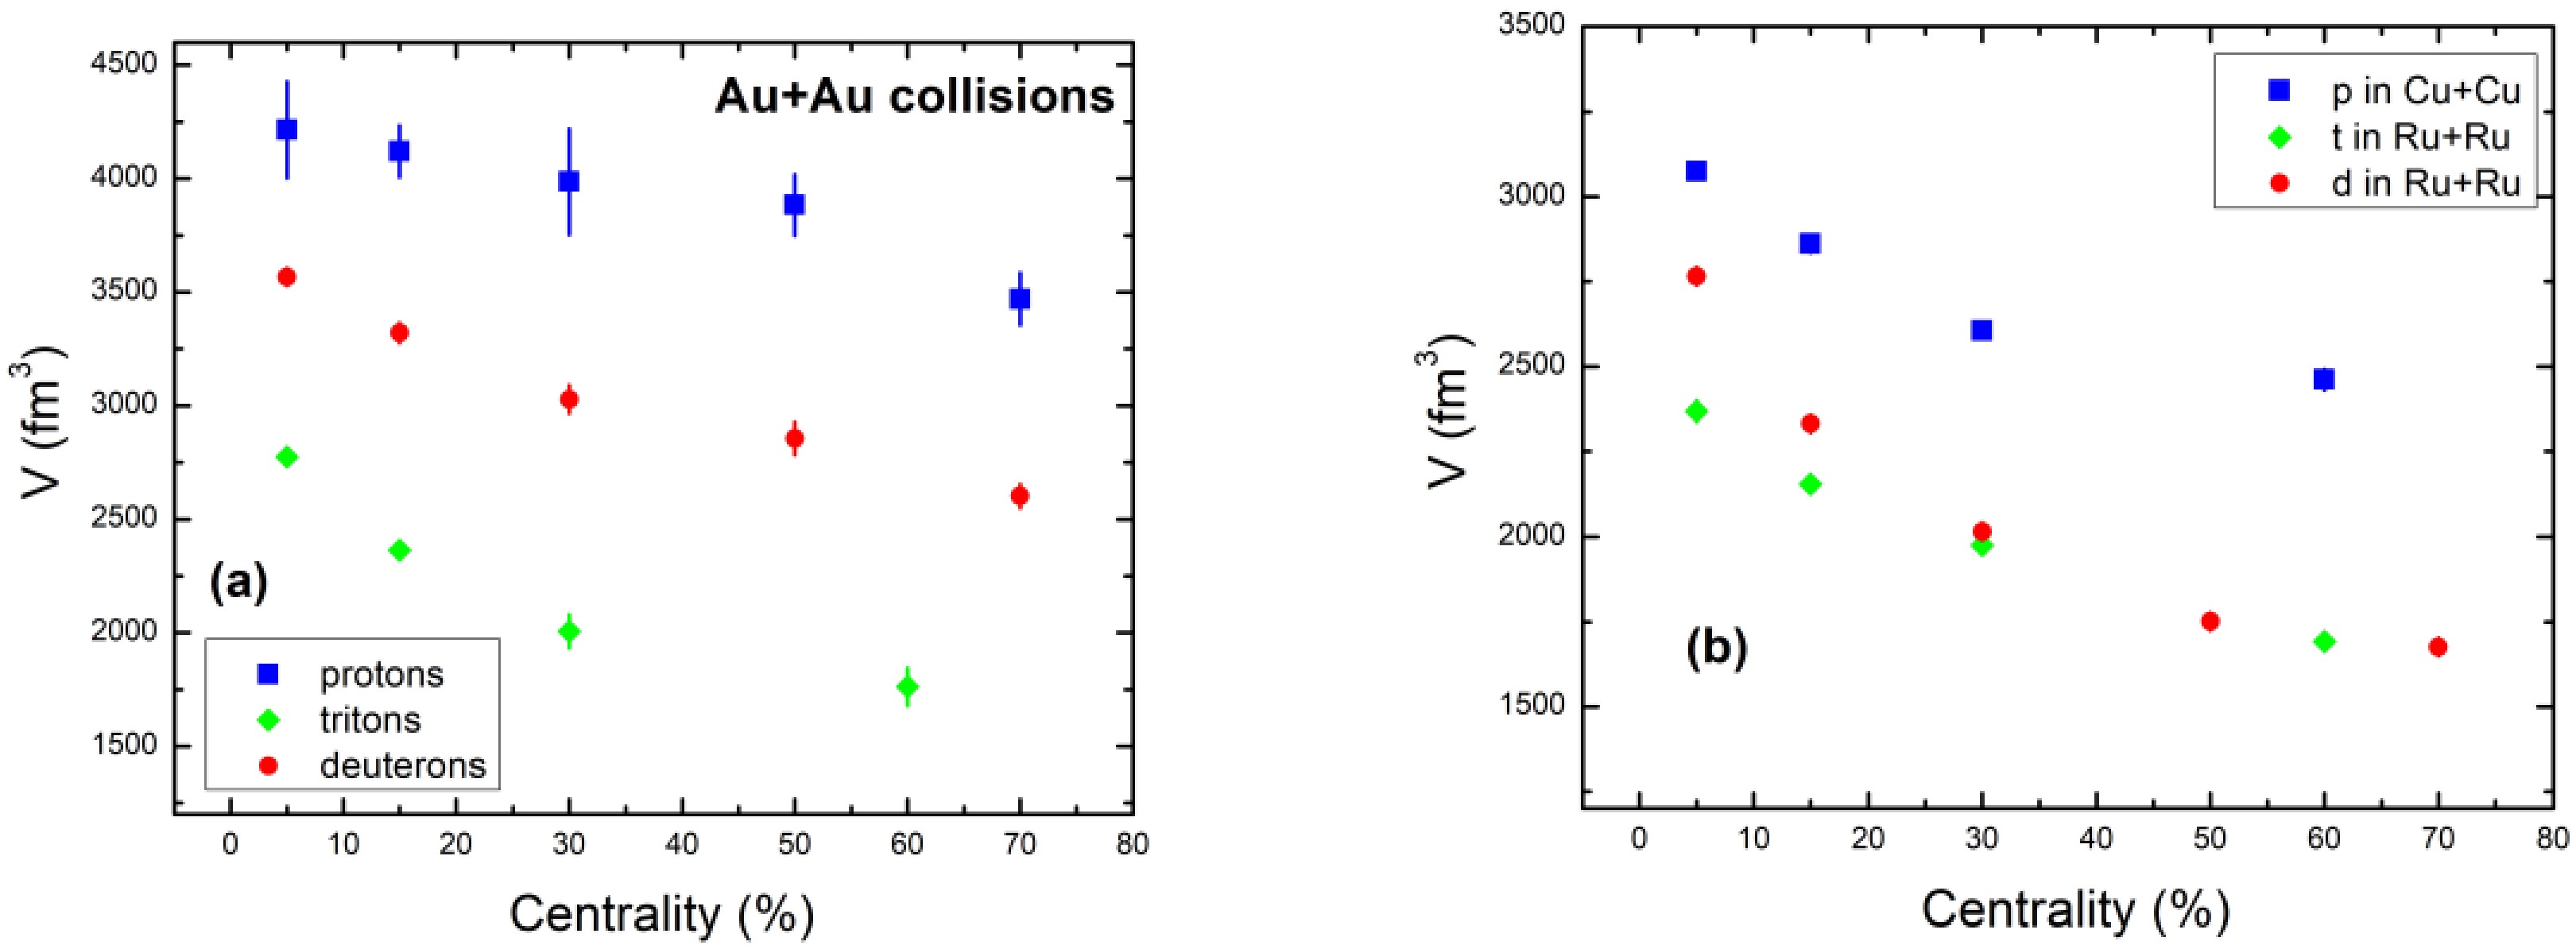
Figure 11. (color online) Dependence of freeze out volume (V) parameter on centrality of protons, deuterons, and tritons obtained in Au+Au (a) as well as protons in Cu+Cu and deuterons and tritons in Ru+Ru (b) at 200 GeV, using Eq. (2).
Additionally, as shown in Fig. 11, a differential volume scenario observation shows that heavy particles have an earlier freeze-out due to their lower freeze-out volume. Different freeze-out surfaces show this diversity in freeze-out for various particles.
Furthermore, from the association between T0 and V, as shown in Table 1, it is clear that two-dimensional anti-correlation overlapping bands are present for protons, deuterons, and tritons, in the case of T0 and V. The magnitude of V decreases as T0 rises from central to peripheral collisions.
Figure 12 shows that the parameter T0 increases as the particle mass increases. In essence, T0 (the temperature), is noticeably lower in core collisions and then increases toward the periphery.
The correlation diagram given in Fig. 13 illustrates the connection between the transverse flow velocity and kinetic freeze-out temperature (T). Together with our data, these parameters are derived using fitting approaches applied to the spectra of light-flavored hadrons produced in different collisions at various center-of-mass energies shown in figure legend [52]. The correlation diagram offers information about how T and βT interact. The results for light hadrons obtained from Au+Au, Cu+Cu, and Ru+Ru collsions at 200 GeV are shown in this figure, along with other results. It is found that these results from Au+Au, Cu+Cu, and Ru+Ru at 0.2 TeV have the same behavior as the results produced earlier for light particle at higher energy and/or heavy ion collisions such as p+p at 7 and 13 TeV, p+Pb at 5.02 TeV, Pb+Pb at 5.02 TeV, Pb+Pb at 2.76 TeV, and Xe+Xe at 5.44 TeV. However, values of T0 versus βT in cases of Au+Au, Cu+Cu, and Ru+Ru collsions at 200 GeV for light hadrons are at lower points compared to values of other results, which occur at much high energies. This could be due to the comparatively smaller collisions systems at smaller colliding energies.
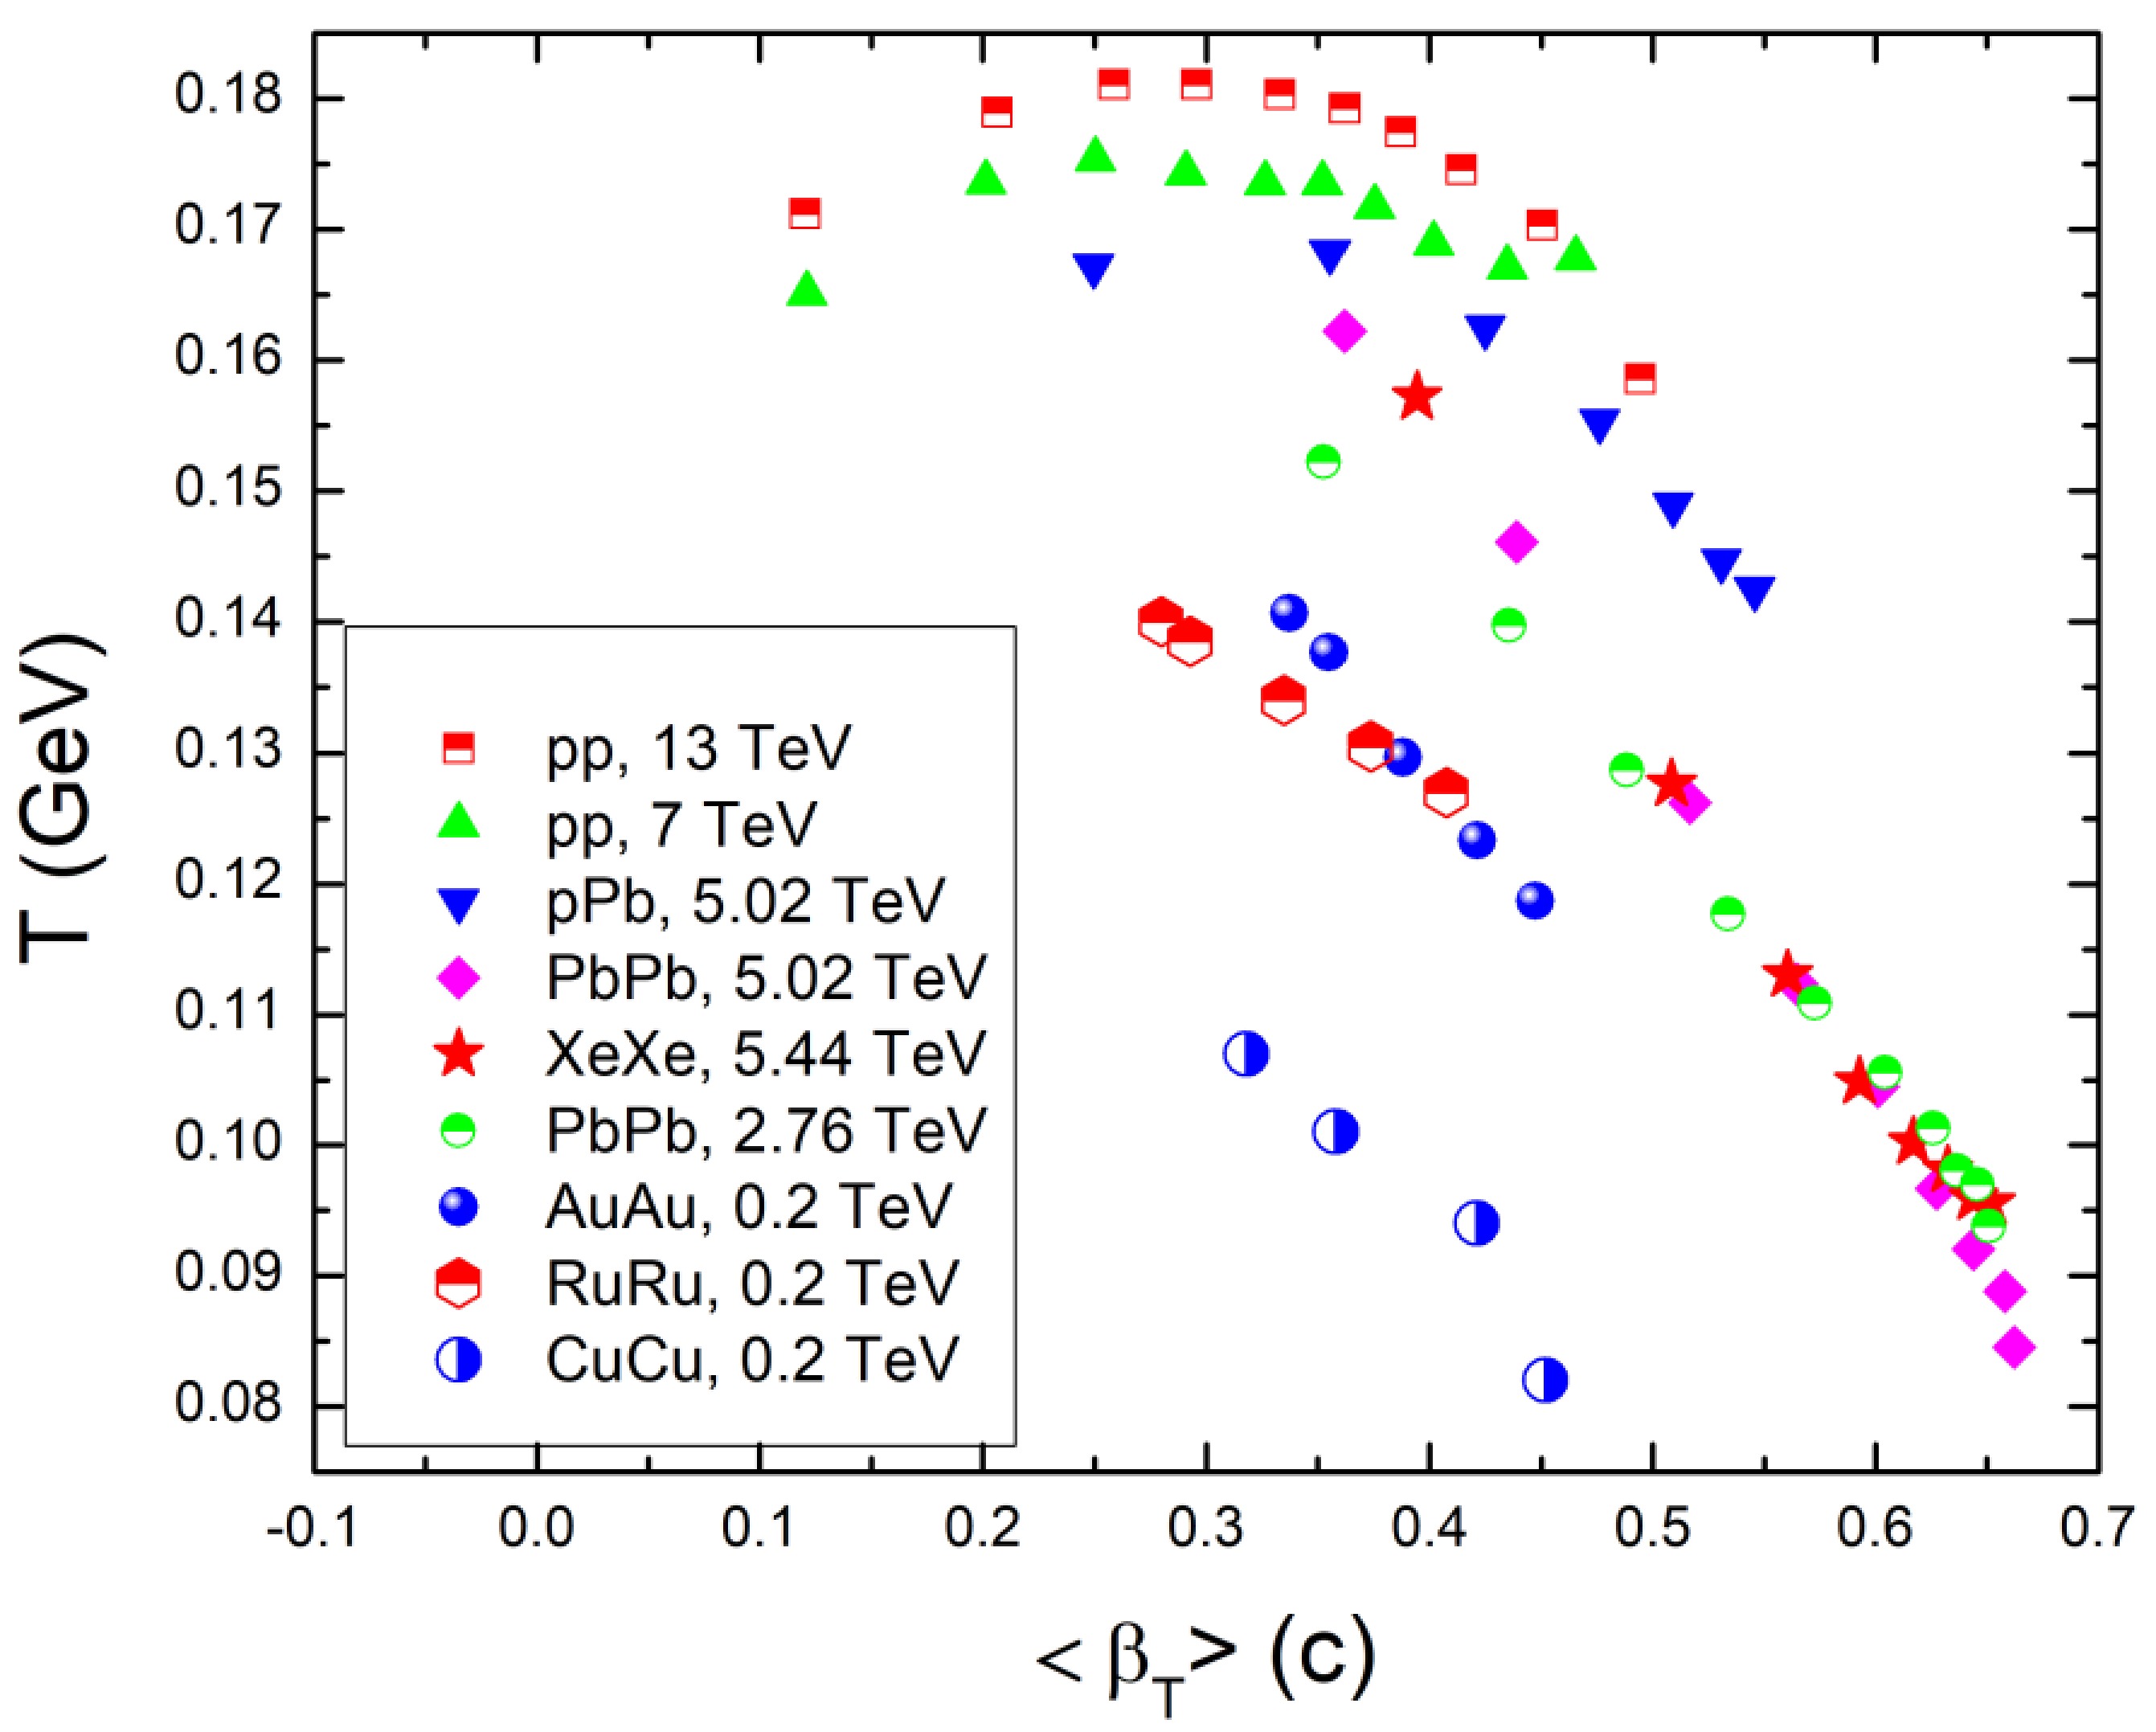
Figure 13. (color online) Correlation plot depicting the relationship between the kinetic freeze-out temperature and transverse flow velocity [52].
-
We analyze the transverse momentum spectra of p, d, and t obtained at RHIC energy using the BWTS function to derive the kinetic freeze-out temperature, transverse flow velocity, and kinetic freeze-out volume and their dependence on the centrality of collisions.
It is observed that, from central to peripheral collisions, T0 shows a rising trend. T0 of protons for Cu+Cu collisions has smaller values than that for Au+Au collisions at the same colliding energy. This could be due to the smaller size of the collision system of
${}_{29}^{64}{\rm Cu} + {}_{29}^{64}{\rm Cu}$ compared to the${}_{79}^{197}{\rm Au} + {}_{79}^{197}{\rm Au}$ system. A mass dependence of T0 is present, with tritons having the highest value, followed by deuterons, and then protons. This shows that heavier particles, relative to lighter ones, enter the freeze-out stage earlier. The kinetic freeze out temperature of light particles is lower, suggesting that their interactions with the surrounding medium are weaker. On the other hand, during this transition, transverse flow velocity and freeze-out volume show a falling pattern. The transverse flow velocity values are maximal at greater centrality regions and minimum for more peripheral collisions. A larger pressure gradient in the collision zone and the formation of a highly compressed system result from scenarios with more central collisions because more energy is delivered into the system. The system experiences more powerful interactions in central collisions, which causes a rapid growth. Furthermore, for heavier particles, βT is smaller compared to that of lighter particles. Heavy particles facing more resistance while traversing the dense nuclear medium created in the collisions may be the reason for this phenomenon.The entropy index q increases, with the system appearing more in equilibrium for heavier particles such as tritons compared to protons and deuterons. The transverse flow velocity and freeze-out volume decrease with increasing particle mass, indicating a volume- and mass-dependent kinetic freeze-out scenario. Additionally, as temperature T increases from central to peripheral collisions, the transverse flow velocity βT decreases, with higher kinetic freeze-out temperatures observed for heavier particles.
Similarly, q increases from central to peripheral collisions, with the lowest values observed in Pb+Pb at 2.76 TeV, indicating near-equilibrium states in symmetric collisions. Higher q values in asymmetric p+Pb collisions suggest a strong dependence on collision geometry and energy.
Analysis of transverse momentum spectra of protons, deuterons, and tritons in symmetric heavy-ion collisions at${ \sqrt {{\boldsymbol s_{_{\boldsymbol NN}}}} }$ = 200 GeV at the RHIC
- Received Date: 2024-05-29
- Available Online: 2025-01-15
Abstract: The blast wave model with Tsallis statistics is used to analyze the transverse momentum spectra of protons (p), deuterons (d), and tritons (t) in


 Abstract
 HTML
HTML Reference
 Related
 PDF
PDF





 DownLoad: