


 Abstract
 HTML
HTML Reference
 Related
 PDF
PDF


-
Recent advancements in gravitational physics have been propelled by a surge in high-precision experiments, notably spearheaded by collaborations such as the Event Horizon Telescope (EHT). They have yielded groundbreaking discoveries, including the detection of shadow-like features near supermassive black holes [1−14]. These experimental triumphs correspond closely with theoretical predictions, notably supporting the Kerr hypothesis [15], which posits that the endpoint of gravitational collapse in suitable astrophysical conditions results in the formation of rotating electrically neutral black holes [16, 17]. This convergence of theory and observation not only validates our understanding of black hole physics but also creates avenues for exploring unresolved questions about strong gravitational fields. Furthermore, physicists continue to refine simplified models to numerically explore black hole properties, including accretion disks and celestial spheres, to enhance our understanding of these enigmatic cosmic entities.
A defining characteristic of images captured by the EHT is a dark central region surrounded by a bright ring. This characteristic emerges from the bending of light by strong gravity near unstable photon orbits [18−25]. These observations correspond with the Kerr black hole model. However, the discovery of photon spheres around exotic compact objects (ECOs) has introduced complexities [26−35]. ECOs mimic black hole observations but predict unique signatures for further verification. Therefore, their observation has become a scientific target for the next-generation Event Horizon Telescope (ngEHT) [36].
Naked singularities, a type of ECO, have attracted significant interest. Despite the cosmic censorship conjecture forbidding naked singularities, they can theoretically form under specific conditions during the collapse of massive objects [37−44]. With photon spheres, naked singularities can closely resemble black holes optically. This has prompted investigations into their unique observational signatures [45−56]. Notably, research indicates that naked singularities in Reissner-Nordström (RN) geometries have an anti-photon sphere, reversing the inner image that does not match the observed shadow [45]. Therefore, investigating the distinct observational characteristics of RN naked singularities and RN black holes holds significant value.
Moreover, several general relativistic magnetohydrodynamics (GRMHD) simulations and semi-analytic models suggest that the interplay between magnetic reconnection and flux eruptions can lead to the formation of hot spots around supermassive black holes residing within magnetized accretion disks [57−59]. Interestingly, these hot spots have been repeatedly observed in the vicinity of Sgr A* [60−62]. Moreover, a remarkable instance involved the detection of an orbiting hot spot in unresolved light curve data at the EHT observing frequency [63]. Owing to their origin from a compact region very close to the innermost stable circular orbit (ISCO), these hot spots offer a promising avenue for probing central objects in the strong gravity regime [64−69]. This paper investigates the distinctive signatures of hot spots around different RN singularities and RN black holes to potentially distinguish them.
The subsequent sections of this paper are structured as follows: In Sec. II, we briefly introduce RN spacetime and discuss geodesic motion within these spacetimes. In Sec. III, we show the numerical results of the celestial model in RN spacetime. Section IV describes the hot spot model and examines time integrated images, temporal magnitudes, and centroids. Finally, Sec. V presents our conclusions. We adopt the convention
$ G=c=1 $ throughout the paper. -
This section commences with a concise overview of geodesic expressions within RN spacetime. To enhance the significance of the chosen orbit in our hot spot model, we also briefly introduce diverse stable circular orbits within the framework of RN spacetime.
The RN metric presents a static solution in Einstein and Maxwell equations, and it is given by
$ {\rm d}s^{2}=-f\left(r\right){\rm d}t^{2}+\frac{1}{f\left(r\right)}{\rm d}r^{2}+r^{2}\left({\rm d}\theta^{2}+\sin^{2}\theta {\rm d}\varphi^{2}\right), $

(1) with the metric function
$ f\left(r\right)=1-\frac{2M}{r}+\frac{Q^{2}}{r^{2}}. $

(2) Here, M and Q represent the mass and electric charge, respectively. The conditions
$ M<Q $ and$ M>Q $ correspond to the two scenarios of naked singularities and black holes, respectively. The trajectory of a test particle with four-momentum$ p^{\mu} $ is determined by the geodesic equations$ \frac{{\rm d}x^{\mu}}{{\rm d}\lambda}=p^{\mu},\quad\frac{{\rm d}p^{\mu}}{{\rm d}\lambda}=-\Gamma_{\rho\sigma}^{\mu}p^{\rho}p^{\sigma}, $

(3) where λ is the affine parameter, and
$ \Gamma_{\rho\sigma}^{\mu} $ indicates the Christoffel symbol. These geodesics are fully characterized by three conserved quantities:,$ \begin{array}{*{20}{l}} E=-p_{t},\quad L_{z}=p_{\varphi},\quad L^{2}=p_{\theta}^{2}+L_{z}^{2}\csc^{2}\theta. \end{array} $

(4) In the context of massless particles, the conserved quantities E,
$ L_{z} $ , and L represent the total energy, angular momentum parallel to the axis of symmetry, and total angular momentum, respectively. Additionally, the Hamiltonian constraint$ \mathcal{H}\equiv g_{\mu\nu}p^{\mu}p^{\nu}/2=0 $ yields the radial component of the null geodesic equations as$ \begin{array}{*{20}{l}} \dot{r}^{2}+V_{\text{eff}}\left(r\right)=0, \end{array} $

(5) where the dot signifies differentiation with respect to an affine parameter λ, and the introduced effective potential is given by
$ V_{\text{eff}}\left(r\right)=f\left(r\right)\left[\frac{L^{2}}{r^{2}}-\frac{E^{2}}{f\left(r\right)}\right]. $

(6) A circular null geodesic occurs at an extremum of the effective potential
$ V_{\text{eff}}(r) $ , and the radius$ r_{c} $ of this geodesic is determined by the conditions$ \begin{array}{*{20}{l}} V_{\text{eff}}\left(r_{c}\right)=0, \quad \text{ }V_{\text{eff}}^{\prime}\left(r_{c}\right)=0. \end{array} $

(7) Furthermore, local maxima and minima of the effective potential correspond to unstable and stable circular null geodesics, which constitute the photon and anti-photon spheres, respectively. When
$ Q/M\leq\sqrt{9/8} $ , a photon sphere exists at$ r=r_{ps}^{+} $ , and an anti-photon sphere exists at$ r=r_{ps}^{-}, $ as given by$ r_{ps}^{\pm}=\frac{3M\pm\sqrt{9M^{2}-8Q^{2}}}{2}. $

(8) For massive particles, E,
$ L_{z} $ , and L represent the total energy per unit mass, angular momentum per unit mass parallel to the axis of symmetry, and total angular momentum per unit mass, respectively, when the affine parameter λ is selected as the proper time per unit mass. Similarly, the Hamiltonian constraint$ \mathcal{H}=-1/2 $ leads to the effective potential$ V_{\text{eff}}\left(r\right)=f\left(r\right)\left[\frac{L^{2}}{r^{2}}-\frac{E^{2}}{f\left(r\right)}+1\right]. $

(9) Circular time-like geodesics satisfy
$ \begin{array}{*{20}{l}} V_{\text{eff}}\left(r\right)=0\text{, } \quad V_{\text{eff}}^{\prime}\left(r\right)=0. \end{array} $

(10) A comprehensive analysis of the circular motion of time-like particles was conducted in [70, 71]. In the presence of a photon sphere
$ (Q/M\leq\sqrt{9/8}) $ and ensuring the motion of the particle satisfies$ E>0 $ and$ L>0 $ , it is evident that circular time-like geodesics exist only when$ r>r_{ps}^{+} $ ,$ r<r_{ps}^{-} $ and$ r>r_*=Q^{2}/M. $ In contrast, as photon spheres do not exist$ (Q/M>\sqrt{9/8}) $ , circular time-like geodesics exist when$ r>r_*. $ Moreover, the existence of stable circular orbits is bounded by marginal stable circular orbits (MSCOs) with the additional condition$ \begin{array}{*{20}{l}} V_{\text{eff}}^{^{\prime\prime}}\left(r\right)=0. \end{array} $

(11) This condition
$ \left(11\right) $ yields a single solution$ r_{\text{msco}} $ , two solutions$ r_{\text{msco}}^{\pm} $ , and no solution for a RN black hole with$ Q/M<1 $ , a RN naked singularity with$ 1<Q/M<\sqrt{5}/2 $ , and a RN naked singularity with$ Q/M>\sqrt{5}/2 $ , respectively. Combining these findings with the results derived from Eq.$ \left(10\right) $ regarding the existence of circular orbits, we collate four parameter spaces with distinct regions of stable circular orbits, as outlined in Table 1.$Q/M$ Value

Region of stable circular orbit Photon Sphere $Q/M < 1$ 

$r>r_{\text{msco}}$ 

Existent $1 < Q/M < \sqrt{9/8}$ 

$r_{*} < r < r_{ps}^{-}$ and

$r>r_{{\rm{msco}}}^{+}$ 

$\sqrt{9/8} < Q/M < \sqrt{5}/2$ 

$r_{*} < r < r_{{\rm{msco}}}^{-}$ and

$r>r_{{\rm{msco}}}^{+}$ 

Non-Existent $Q/M>\sqrt{5}/2$ 

$r>r_{*}$ 

Table 1. Region of stable circular orbit and photon sphere. The analytical expressions for
$r_{{\rm{msco}}}$ and$r_{{\rm{msco}}}^{\pm}$ are given in [70].In the numerical simulation presented below, our primary focus is in comparing the simulation results for
$Q/M=0.9,\; 1.05$ , and$ 1.11 $ . These specific values are selected to represent distinct scenarios, namely, black holes, naked singularities with a photon sphere, and naked singularities without a photon sphere, respectively. -
This section describes a numerical simulation to visualize gravitational lensing around RN spacetime for an intuitive understanding of light propagation. We model a celestial sphere source, divided into four color-coded quadrants, with a white dot placed in front of the observer. Additionally, a grid of black lines, spaced at
$ \pi/18 $ intervals, overlays the image to indicate a constant longitude and latitude. To generate observational images, we vary the observer's viewing angle and numerically integrate$ 2000\times2000 $ photon trajectories until they intersect with the celestial sphere. For a detailed explanation of the numerical implementation, interested readers can refer to [52].Figure 1 depicts images of the celestial sphere in both RN black holes and singularities. The dashed circular lines depicted the critical curves, shaped by light rays escaping the photon spheres. The left panel shows the celestial sphere image for
$ Q/M=0.9 $ . It includes the black hole shadow rendered in gray, an Einstein ring, and some higher-order images visible outside the critical curve.
Figure 1. (color online) Images of a celestial sphere located at
$ r=25M $ in the RN metric for$ Q/M=0.9 $ (Left),$ 1.05 $ (Middle), and$ 1.1 $ (Right). The observer's location is$ x_{\text{o}}^{\mu}=(0,10M,\pi/2,\pi) $ , and the field of view spans$ 2\pi/5 $ . Dashed lines represent the critical curve, formed by light rays emitted from the photon sphere. The left panel exhibits one Einstein ring, whereas the middle and right panels exhibit three Einstein rings. For$ Q/M=0.9 $ , corresponding to a black hole, the image encompasses the black hole shadow portrayed as a gray area in the left panel. The middle panel depicts the image of a naked singularity with a photon sphere, where the region outside the critical curve has a slight deviation from the left panel. However, within the critical curve, additional celestial images are also present. Moreover, infinitely high-order images exist near the critical curve. For the right panel, lacking a critical curve owing to the absence of a photon sphere, the overall pattern is similar to the middle panel. Nevertheless, finite high-order images are observed near the second Einstein ring.The middle panel of Fig. 1 depicts the celestial sphere image for a RN naked singularity of
$ Q/M=1.05 $ with a photon sphere. The region outside the critical curve exhibits a comparable appearance to the$ Q/M=0.9 $ case. However, light ray refraction within the photon sphere causes additional celestial images appearing inside the critical curve. Furthermore, compression and color alternation near the critical curve indicate the generation of numerous higher-order terms in its vicinity.The right panel of Fig. 1 shows the celestial sphere image for a RN naked singularity of
$ Q/M=1.1 $ devoid of photon spheres. This image resembles the middle panel at a distance from the critical curve. However, the infinitely higher-order images converging near the critical curve are replaced by a finite number of higher-order images.To understand the finite number of higher-order images for
$ Q/M=1.1 $ , we analyze the deflection angle as a function of the impact parameter b, depicted Fig. 2. In this figure, the deflection angle is defined as$ \alpha(b)=I(b)- \pi $ , where$ I(b) $ is numerically integrated (details in [56, 72]). Notably, as the impact parameter b varies from$ 0 $ to infinity, the deflection angle exhibits a maximum$ \alpha_{\rm max} $ at$ b_{m} $ , leading to the absence of infinitely higher-order images.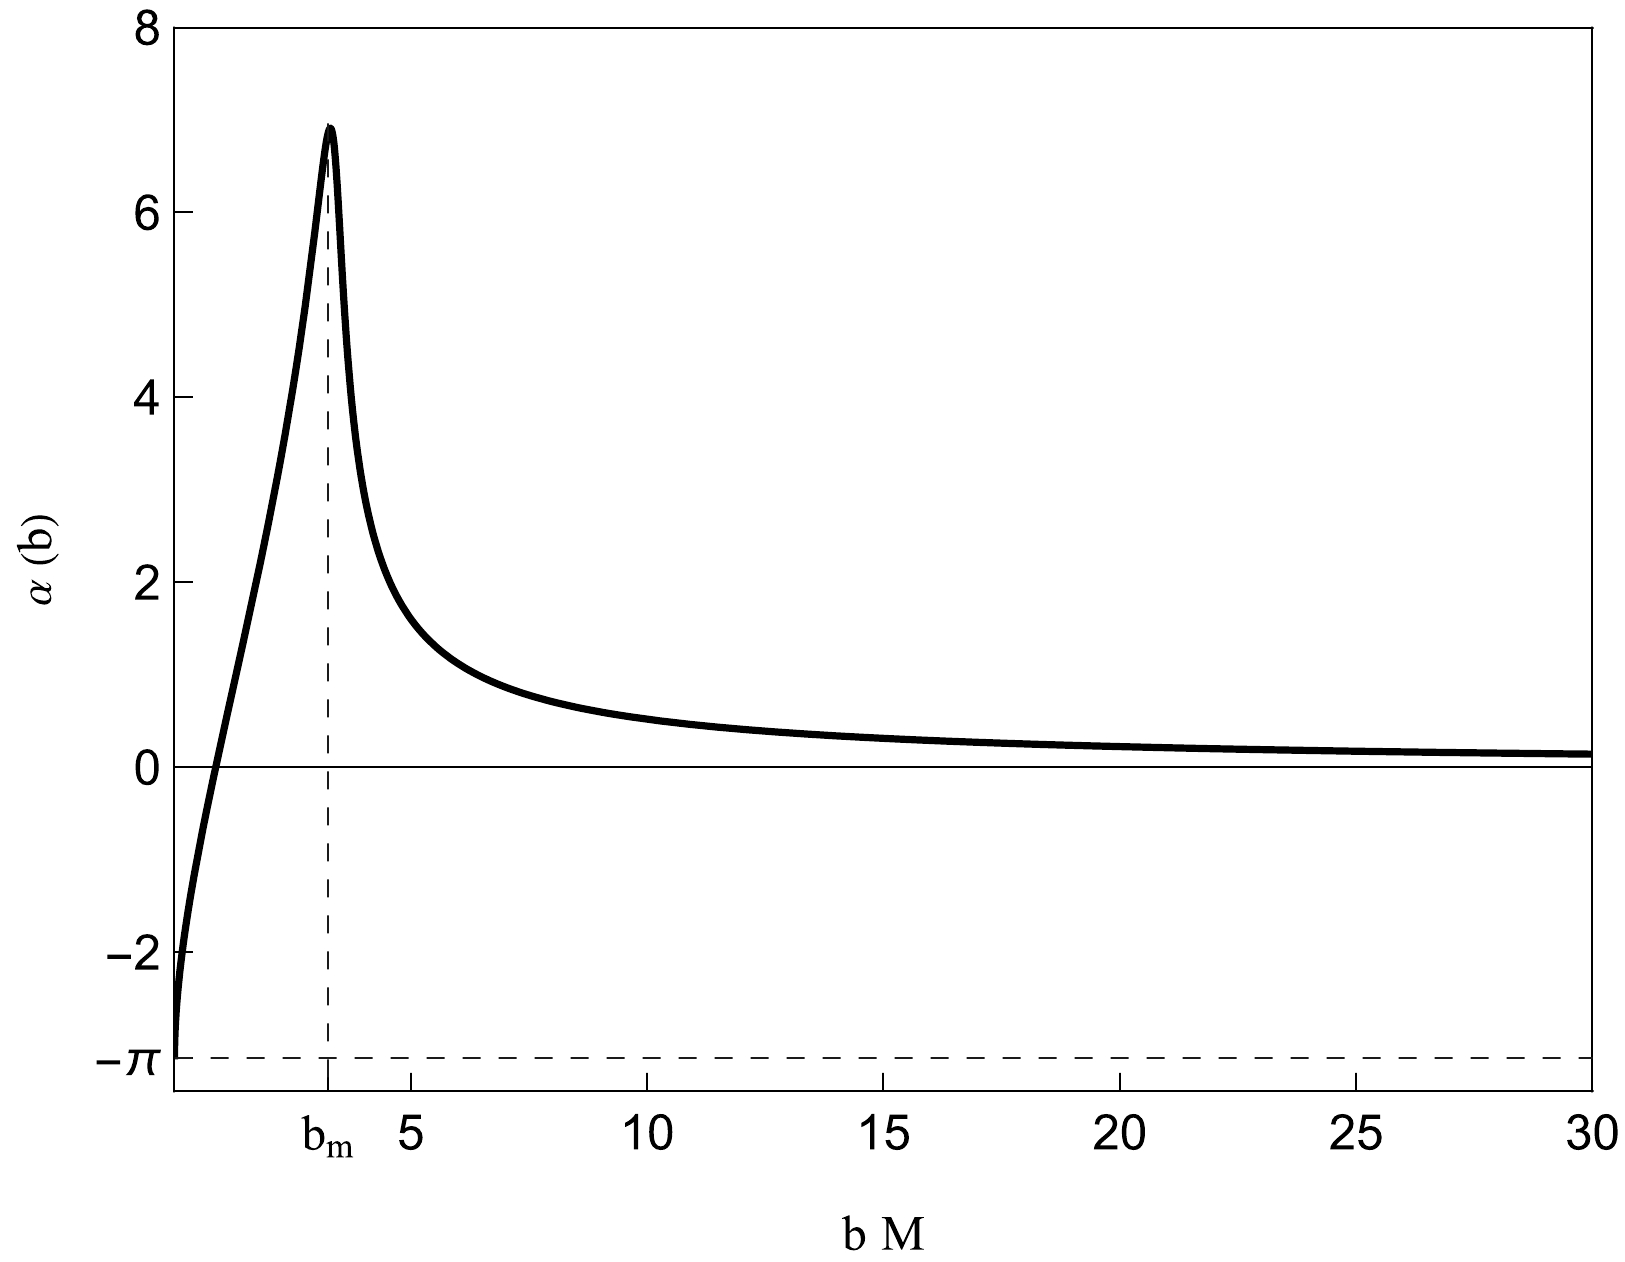
Figure 2. Deflection angle
$ \alpha(b) $ as a function of the impact parameter b for$ Q/M=1.1 $ . The deflection angle reaches its maximum at$ b=b_{m} $ . -
This section addresses the observational characteristics exhibited by hot spots surrounding RN black holes and naked singularities. Consistent with available data and theoretical analyses, flares likely originate from synchrotron radiation emitted by matter near the innermost stable circular orbit (ISCO) [64, 73, 74]. To simplify calculations, we model the hot spot as an isotropically emitting sphere and utilize our computational framework described in [64, 66, 67, 75]. Within this framework, the observer is positioned at
$ \left(t_{o},r_{o},\theta_{o},\varphi_{o}\right)=\left(t_{o},100M,\theta_{o},\pi\right) $ . The hot spot, characterized by a radius of$ 0.25M $ , undergoes counterclockwise orbital motion. To accurately predict flare properties, we maintain hot spot orbits close to the ISCO. For the RN black hole with$ Q/M=0.9 $ , a single stable orbit region exists; therefore, the MSCO with radius of$ r_{\text{msco}} $ is chosen. Conversely, RN naked singularities with$ Q/M=1.05 $ and$ 1.1 $ exhibit two distinct stable orbit regions (discussed in Sec. II). We investigate hot spots in both outer and inner regions. In the outer region, the outer MSCO with radius$ r_{{\rm{msco}}}^{+} $ is adopted as the orbit of the hot spot. For$ Q/M=0.9,1.05 $ , and$ 1.1 $ , the outer orbits are at$r=4.47M,~3.64M$ , and$ 3.08M $ , respectively. In the inner region, an orbit near radius$ r^* $ is selected, as$ r=r^* $ implies a geodesic with zero angular momentum. Specifically, for$ Q/M=1.05 $ and$ 1.1 $ , inner orbits at$ r= 1.11M $ and$ 1.22M $ , respectively, are designated for the hot spots.The selection of
$ r_{o}=100M $ as the observer distance for studying supermassive black holes such as Sgr A* and M87* might raise concerns because of the vast distances separating these objects from actual observers. However, for sufficiently large$ r_{o} $ , the discrepancies between observations at$ r=r_{o} $ and those at infinity are approximately of the order of$ \mathcal{O}(M/r_{o}) $ . Consequently, using$ r_{o}=100M $ yields observations that closely resemble those an infinitely distant observer would record, with an acceptable error margin of around$ 1 $ %. For computational efficiency and precision, we use a$ 1000\times1000 $ pixel grid for each snapshot and generate$ 500 $ snapshots for a period of the orbit, ensuring smooth image evolution throughout period$ T_{e} $ . At a specific time$ t_{k} $ , each pixel in the image plane receives an intensity$ I_{klm} $ , collectively forming lensed hot spot images. Subsequently, we analyze the following image properties based on [66, 67],● Time integrated image:
$ \langle I\rangle _{lm}=\sum\limits _{k}I_{klm}. $

(12) ● Total temporal flux:
$ F_{k}=\sum\limits _{l}\sum\limits _{m}\Delta\Omega I_{klm}, $

(13) where
$ \Delta\Omega $ corresponds to the solid angle of a pixel.● Temporal magnitude:
$ m_{k}=-2.5\lg\left(\frac{F_{k}}{\min\left(F_{k}\right)}\right). $

(14) ● Temporal centroid:
$ \overrightarrow{c_{k}}=F_{k}^{-1}\sum\limits _{l}\sum\limits _{m}\Delta\Omega I_{klm}\overrightarrow{r_{lm}}, $

(15) where
$ \overrightarrow{r_{lm}} $ represents the position relative to the image center. -
Figure 3 reveals the time integrated images for hot spots orbiting around a RN black hole at
$ r=r_{\text{msco}} $ and RN naked singularities at$ r=r_{\text{msco}}^{+} $ . The upper and lower panels show images observed at inclination angles of$ \theta_{o}=80^{\circ} $ and$ 50^{\circ} $ , respectively. These images depict several image tracks revealing the orbit of hot spots. To comprehend the origin of these tracks, we use the integer n to indicate the number of times light rays intersect the equatorial plane. Furthermore, in the presence of a photon sphere for the RN black hole with$ Q/M=0.9 $ and the RN naked singularity with$ Q/M=1.05 $ , image tracks are separated by the critical curve, shaped by light rays with the critical impact parameter$ b_{c} $ . In the absence of a photon sphere ($ Q/M=1.1 $ ), the deflection angle reaches a maximum value$ b_{m} $ as the impact parameter b varies. Therefore, we introduce superscripts$ > $ and$ < $ to distinguish light rays with$ b>b_{c}\left(b_{m}\right) $ and$ b<b_{c}\left(b_{m}\right) $ , respectively.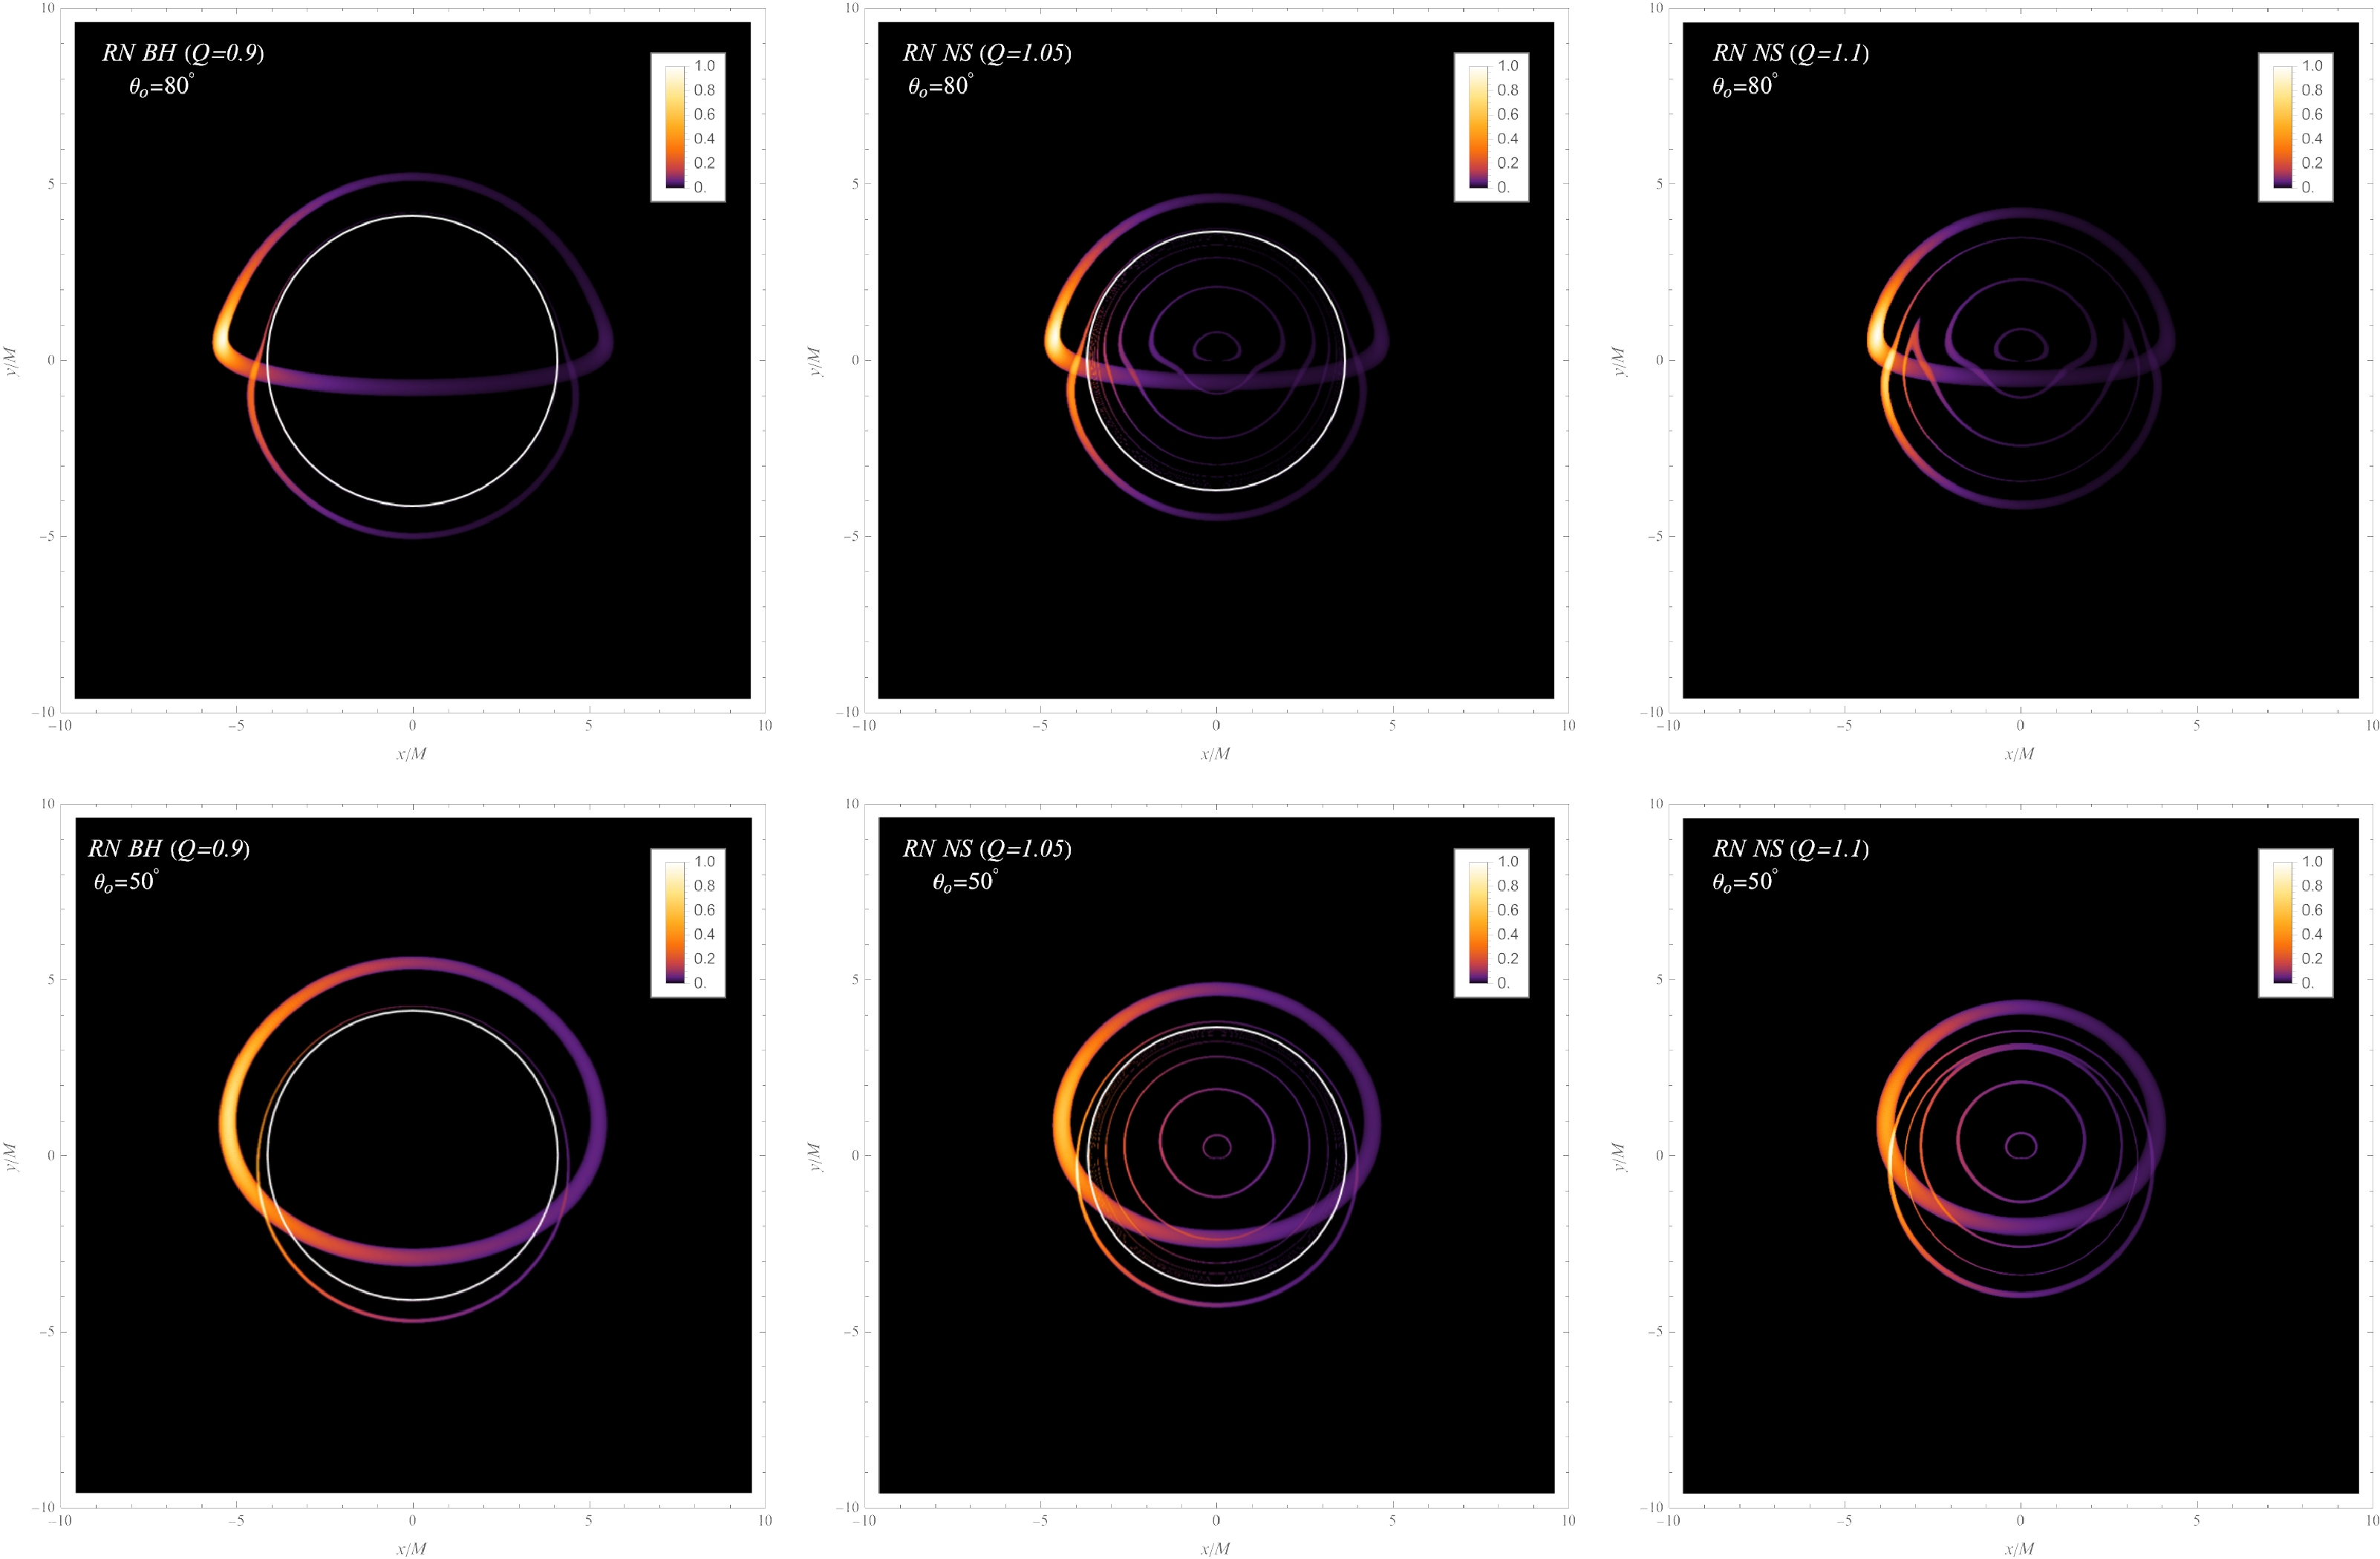
Figure 3. (color online) Time integrated images depicting a full orbit of the hot spot obtained from an observational inclination angle of
$ \theta_{o}=80^{\circ} $ (Upper Row) and$ \theta_{o}=50^{\circ} $ (Lower Row). Note that the intensities are normalized with respect to their maximum value. The white lines delineate the critical curves, shaped by light rays escaping from the photon spheres. Left Column: RN black hole with$ Q/M=0.9 $ , and the hot spot is located at$ r=r_{{\rm{msco}}} $ . This image shows the primary and secondary lensed image tracks positioned outside the critical curve, resulting from the$ n=0^{>} $ and$ 1^{>} $ light rays emitted by the hot spot, respectively. Middle Column: RN singularity with$ Q/M=1.05 $ , and the hot spot is located at$ r=r_{{\rm{msco}}}^{+} $ . The image reveals two image tracks located outside the critical curve, akin to the black hole case. Owing to the reflection of light rays entering the photon sphere, additional tracks emerge within the critical curve. Right Column: RN singularity with$ Q/M=1.1 $ , and the hot spot is located at$ r=r_{{\rm{msco}}}^{+} $ . This image depicts finite image tracks owing to the absence of a photon sphere. Moreover, the two tracks of$ 2^{<} $ and$ 2^{>} $ merge.The left column of Fig. 3 shows time integrated images of a hot spot orbiting an RN black hole with
$ Q/M= $ 0.9 at$ r=r_{{\rm{msco}}} $ . These images reveal a central shadow surrounded by a critical curve. For an observer's inclination angle of$ \theta_{o}=80^{\circ} $ , the primary image$ \left(n=0^{>}\right) $ exhibits a closed semicircular track. Its upper and lower segments correspond to the hot spot behind and in front of the black hole, respectively. In contrast, the secondary image with$ n=1^{>} $ follows a smaller and fainter track. Moreover, images of higher orders have significantly reduced luminosity and adhere closely to the critical curve. Additionally, these images exhibit a distinctive brightness asymmetry due to Doppler effects.The image obtained at an observation inclination of
$ \theta_{o}=50^{\circ} $ resembles the one at$ \theta_{o}=80^{\circ} $ but with a lower level of brightness asymmetry observed at the lower inclination. Furthermore, the image tracks are more circular at the lower inclination.The middle column of Fig. 3 shows the time integrated image of a hot spot orbiting the RN singularity with
$ Q/M=1.05 $ at$ r=r_{{\rm{msco}}}^{+} $ . There are two tracks outside the critical curve, resembling the scenario of the black hole at both observation inclinations of$ \theta_{o}=50^{\circ} $ and$ 80^{\circ} $ . In contrast, four distinct tracks ($ n=0^{<} $ ,$ 1^{<}, \;\; 2^{<} $ , and$ 3^{<} $ ) appear within the critical curve, generated by light rays refracted around the naked singularity. Similarly, as the order n increases, the track becomes progressively more circular, exhibits significantly reduced luminosity, and closely follows the critical curve.Unlike the previous cases, the absence of a photon sphere in the RN singularity with
$ Q/M=1.1 $ results in no critical curve within the time-integrated images for a hot spot orbiting at$ r=r_{{\rm{msco}}}^{+} $ (Fig. 3, right column). Instead, six distinct tracks are visible, denoted as$ n=0^{<} $ ,$ 1^{<} $ ,$ 2^{<} $ ,$ 2^{>} $ ,$ 1^{>} $ , and$ 0^{>} $ . Figure 2 shows a maximum deflection angle$\alpha_{\rm max}$ under specific spacetime; therefore, light rays exceeding this deflection angle cannot be observed, resulting in the incomplete tracks in the time integrated images. Notably, the$ 2^{<} $ and$ 2^{>} $ tracks appear incomplete and converge when observed at$ \theta_{o}=80^{\circ} $ , where their deflection angles$ \alpha(b) $ reach$\alpha_{\rm max}$ . Comparing the scenario at$ \theta_{o}=80{^\circ} $ with that at$ \theta_{o}=50{^\circ} $ , a greater number of light rays emitted from the hot spot exhibit deflection angles smaller than$\alpha_{\rm max}$ . Consequently, more light rays can propagate to the observer, resulting in a more complete time integrated image tracks than case$ \theta_{o}=80^{\circ} $ .Figure 4 depicts integrated images of RN singularities with
$ Q/M=1.05 $ and$ Q/M=1.1 $ , where the hot spots are orbiting at$ r=1.11M $ and$ 1.22M $ , respectively. Owing to their close proximity to the center, the light rays experience a significant gravitational influence, leading to the overlapping of final image tracks, making them challenging to differentiate. For$ Q/M=1.05 $ , the orbit of the hot spot lies within the photon sphere, resulting in images bounded by the critical curve. Moreover, higher-order images are dimly discerned near the critical curve, overlapped with the primary image. Conversely, for$ Q/M= 1.1$ , finite image tracks are observable owing to the absence of a photon sphere.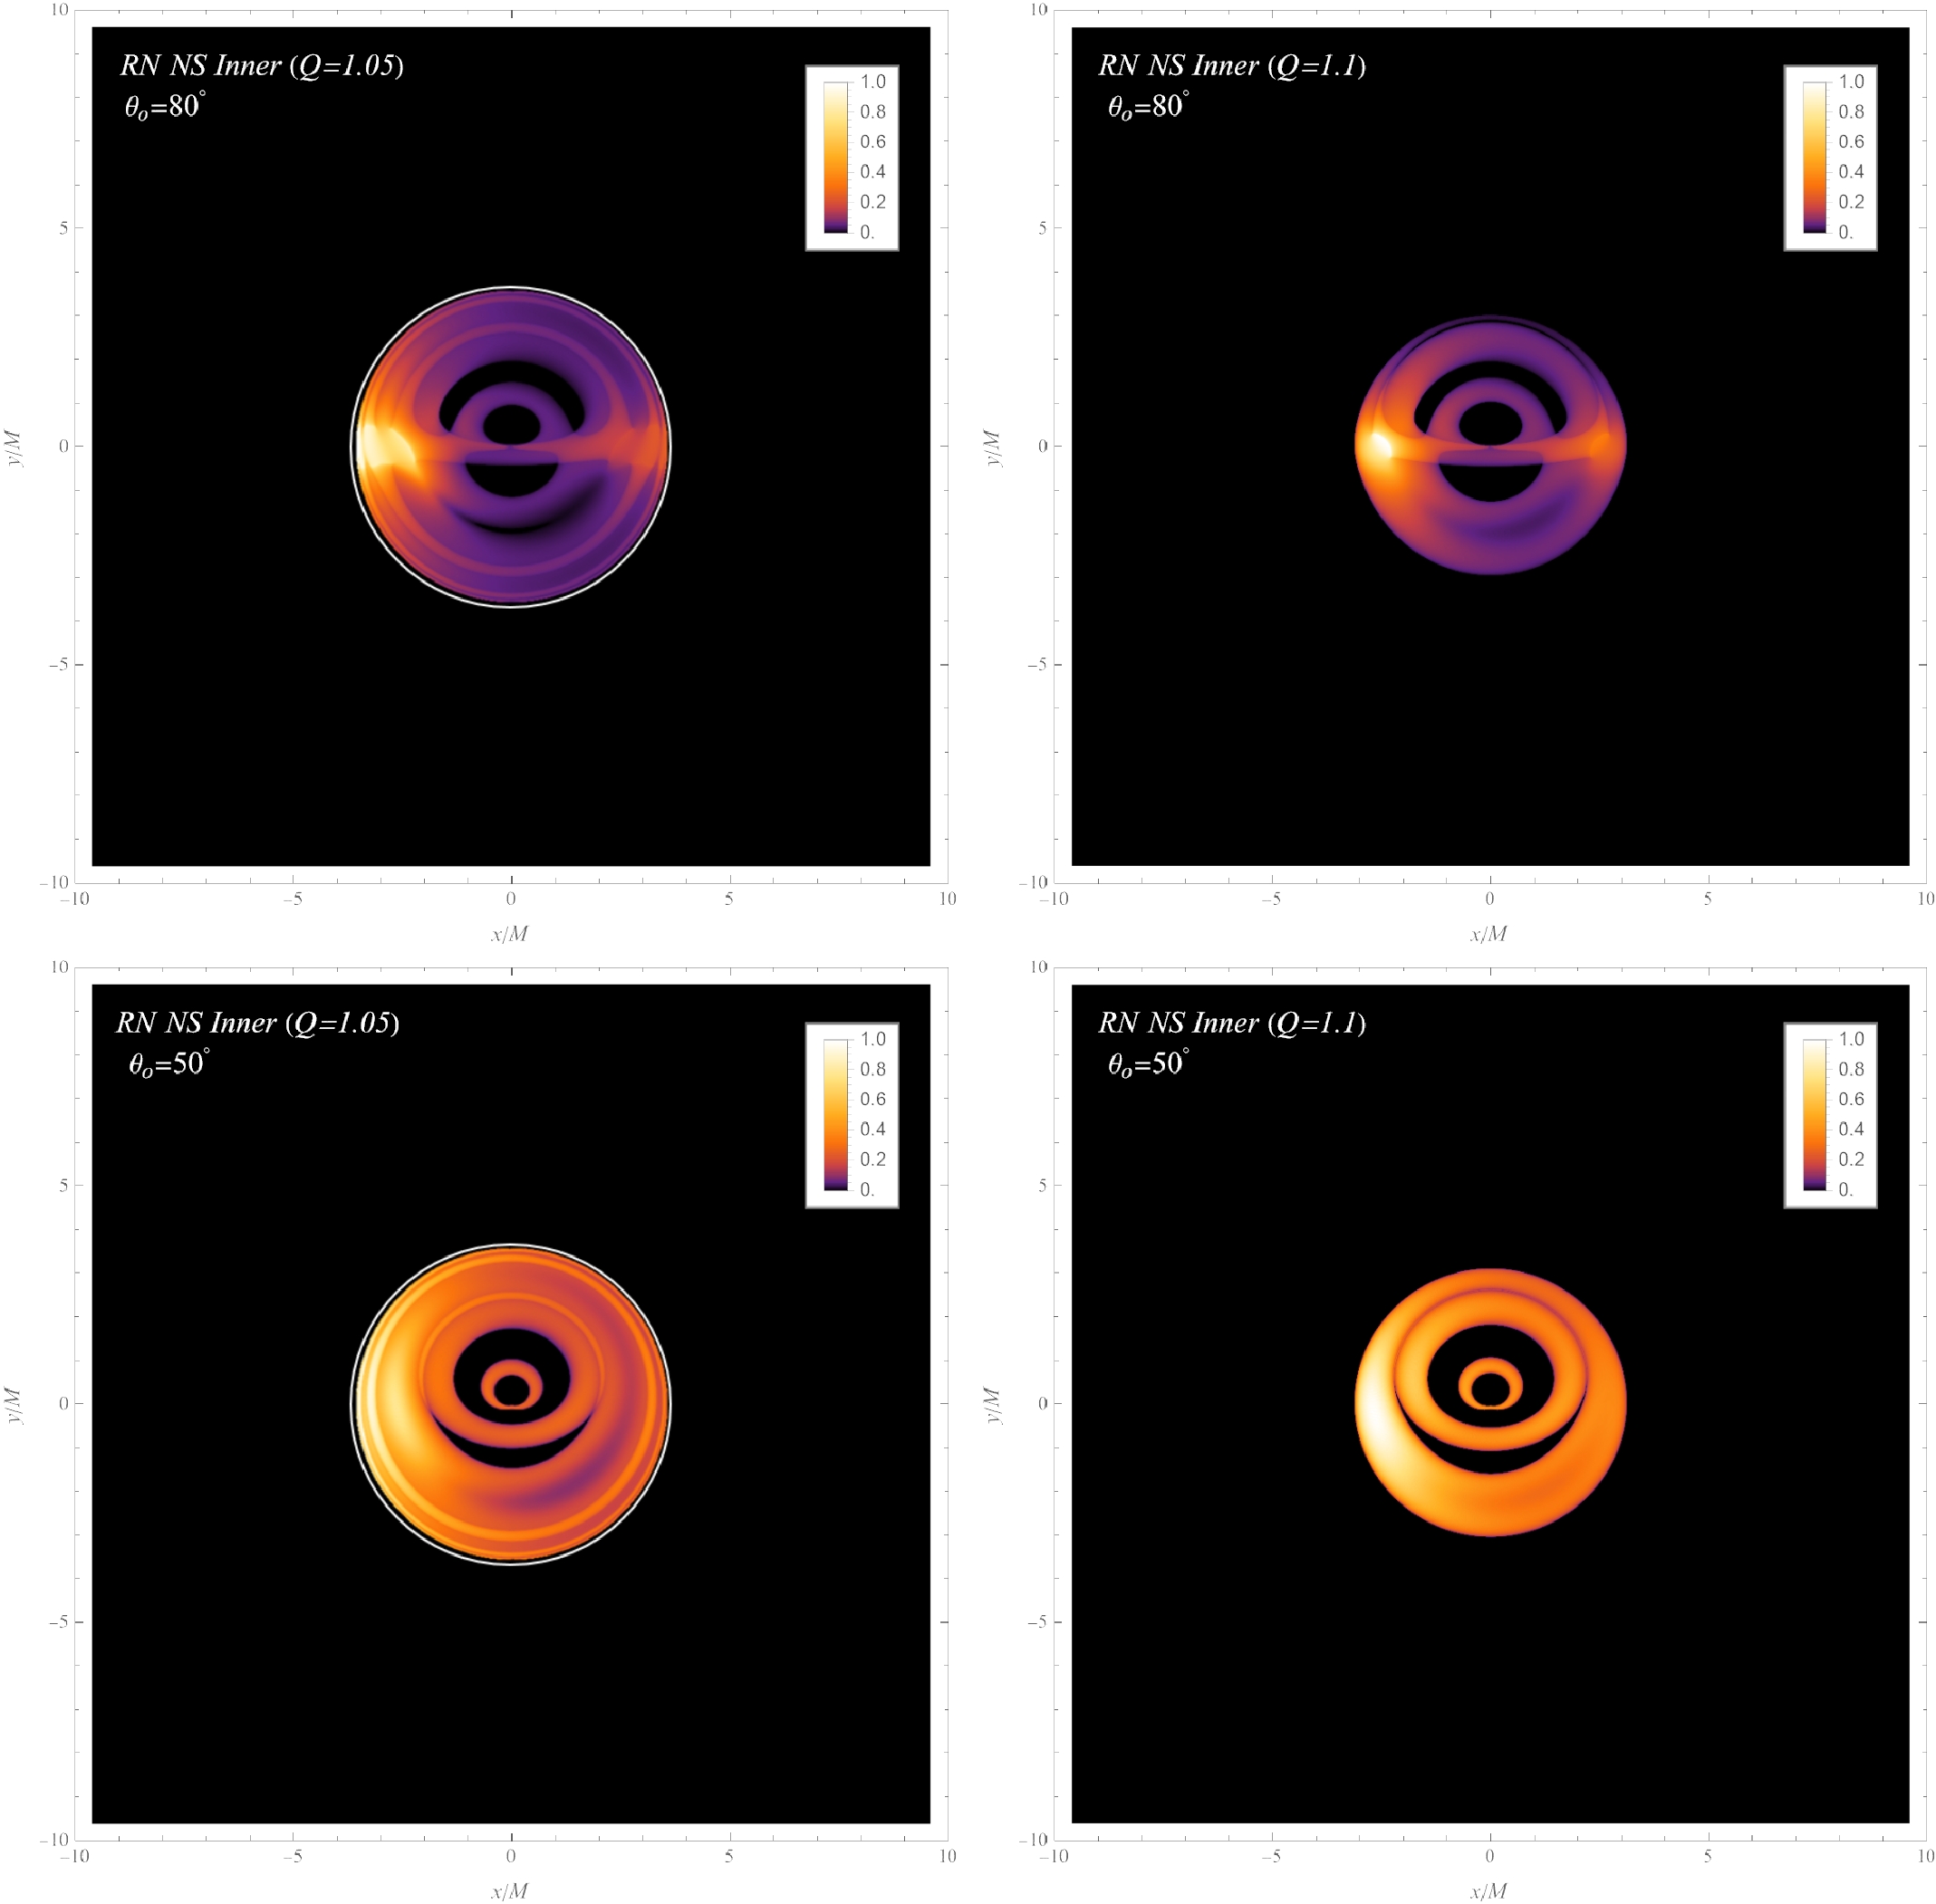
Figure 4. (color online) Time integrated images depicting a full orbit of the hot spot positioned near
$ r=r^* $ in the RN singularity with$ Q/M=1.05 $ (Left Column) and$ 1.1 $ (Right Column). These images are obtained from observational inclination angles of$ \theta_{o}=80^{\circ} $ (Upper Row) and$ \theta_{o}=50^{\circ} $ (Lower Row). Owing to the reduced orbit radius, the resulting images are displayed in a smaller field of view. The tracks in the images appear overlapped and are challenging to distinguish. -
To achieve a more profound comprehension of the alterations in integrated images, this part studys the temporal magnitudes
$ m_{k} $ and centroids$ c_{k} $ observed at an inclination angle of$ \theta_{o}=80^{\circ} $ for each cases. Figures 5 and 6 highlight two significant peaks in the temporal magnitude for each cases, labeled as ① and ②. Additionally, corresponding snapshot images at these specific moments are provided for further examination.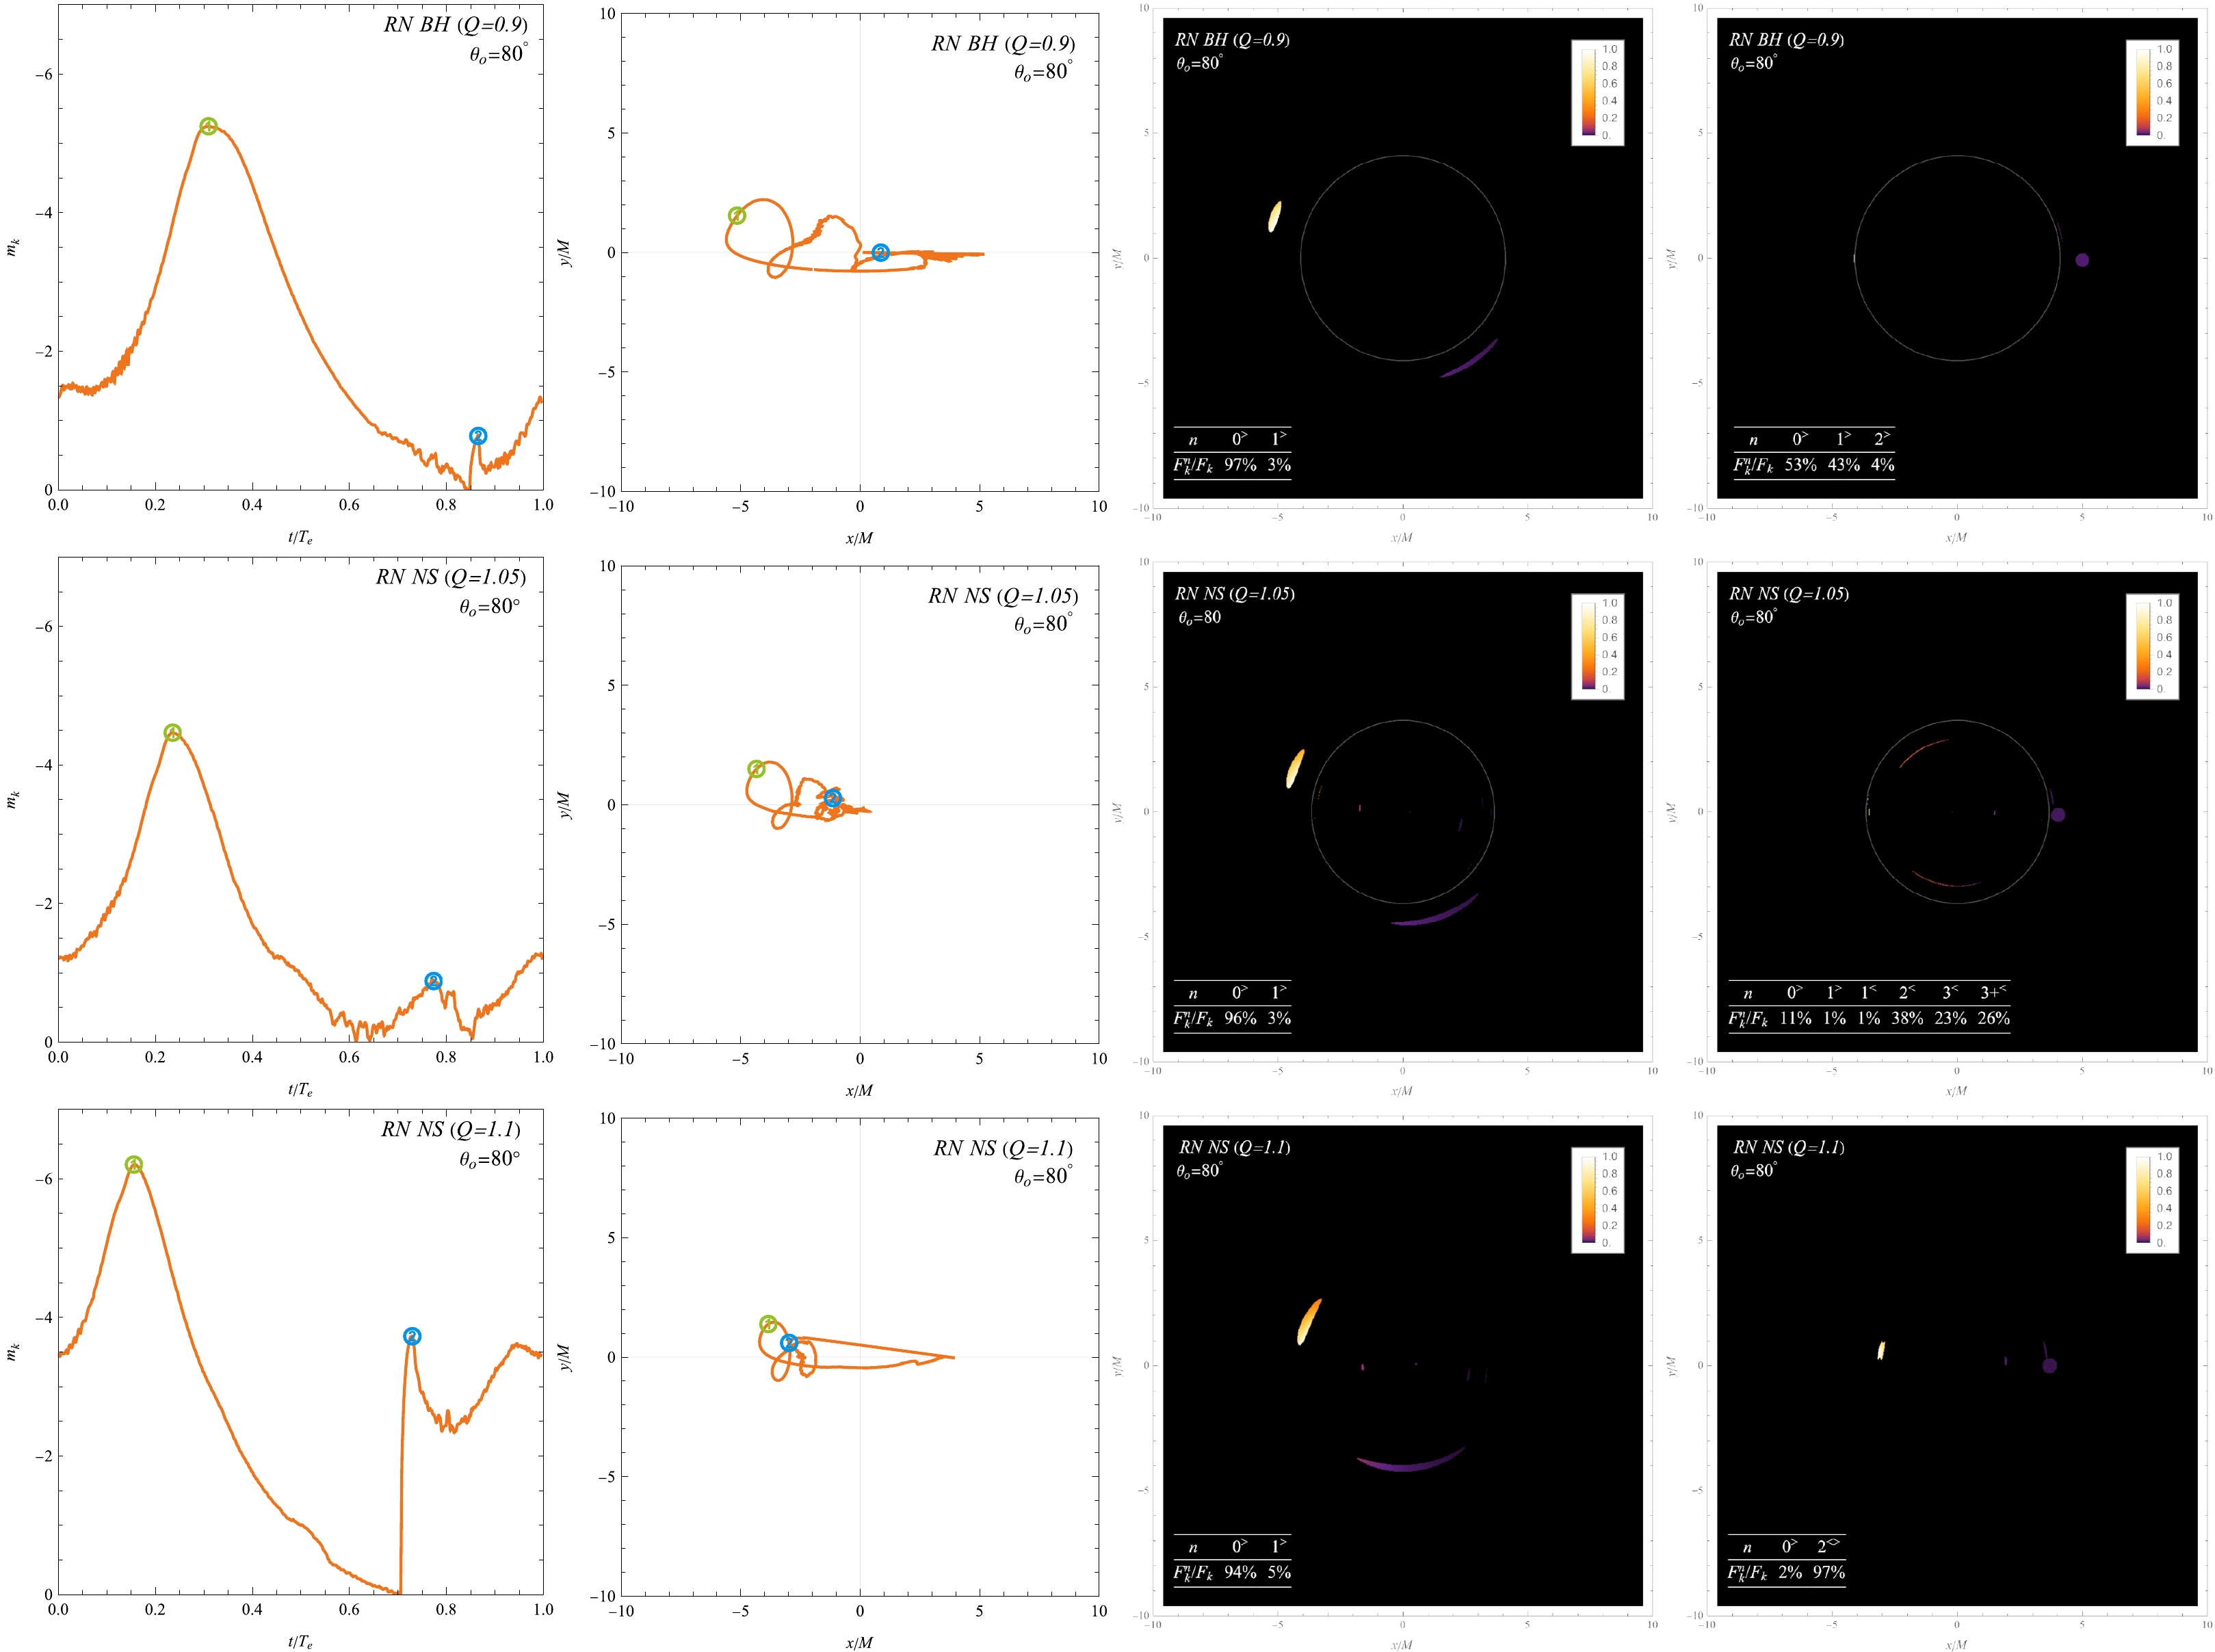
Figure 5. (color online) Temporal magnitudes
$ m_{k} $ (First Column) and centroids$ c_{k} $ (Second Column) as functions of$ t/T_{e} $ for cases$ Q/M=0.9 $ with the orbit at$ r_{\text{msco}} $ (Top Row),$ Q/M=1.05 $ (Middle Row) and$ Q/M=1.1 $ with the orbit at$ r_{\text{msco}}^{+} $ (Bottom Row). The inclination is$ \theta_{o}=80^{\circ} $ . The highest and second-highest peaks of the temporal magnitude are indicated by ① and ②, respectively. The centroids of the flux at these peaks are identified with corresponding numbers. The snapshots for each case, when the temporal magnitude reaches its highest peak and second-highest peak, are presented in the third and fourth columns, respectively. The contribution from the$ n^{\text{th}} $ -order image to the total flux is quantified by$ F_{k}^{n}/F_{k} $ , where$ F_{k}^{n} $ represents the temporal flux of the$ n^{\text{th}} $ -order image at$ t=t_{k} $ .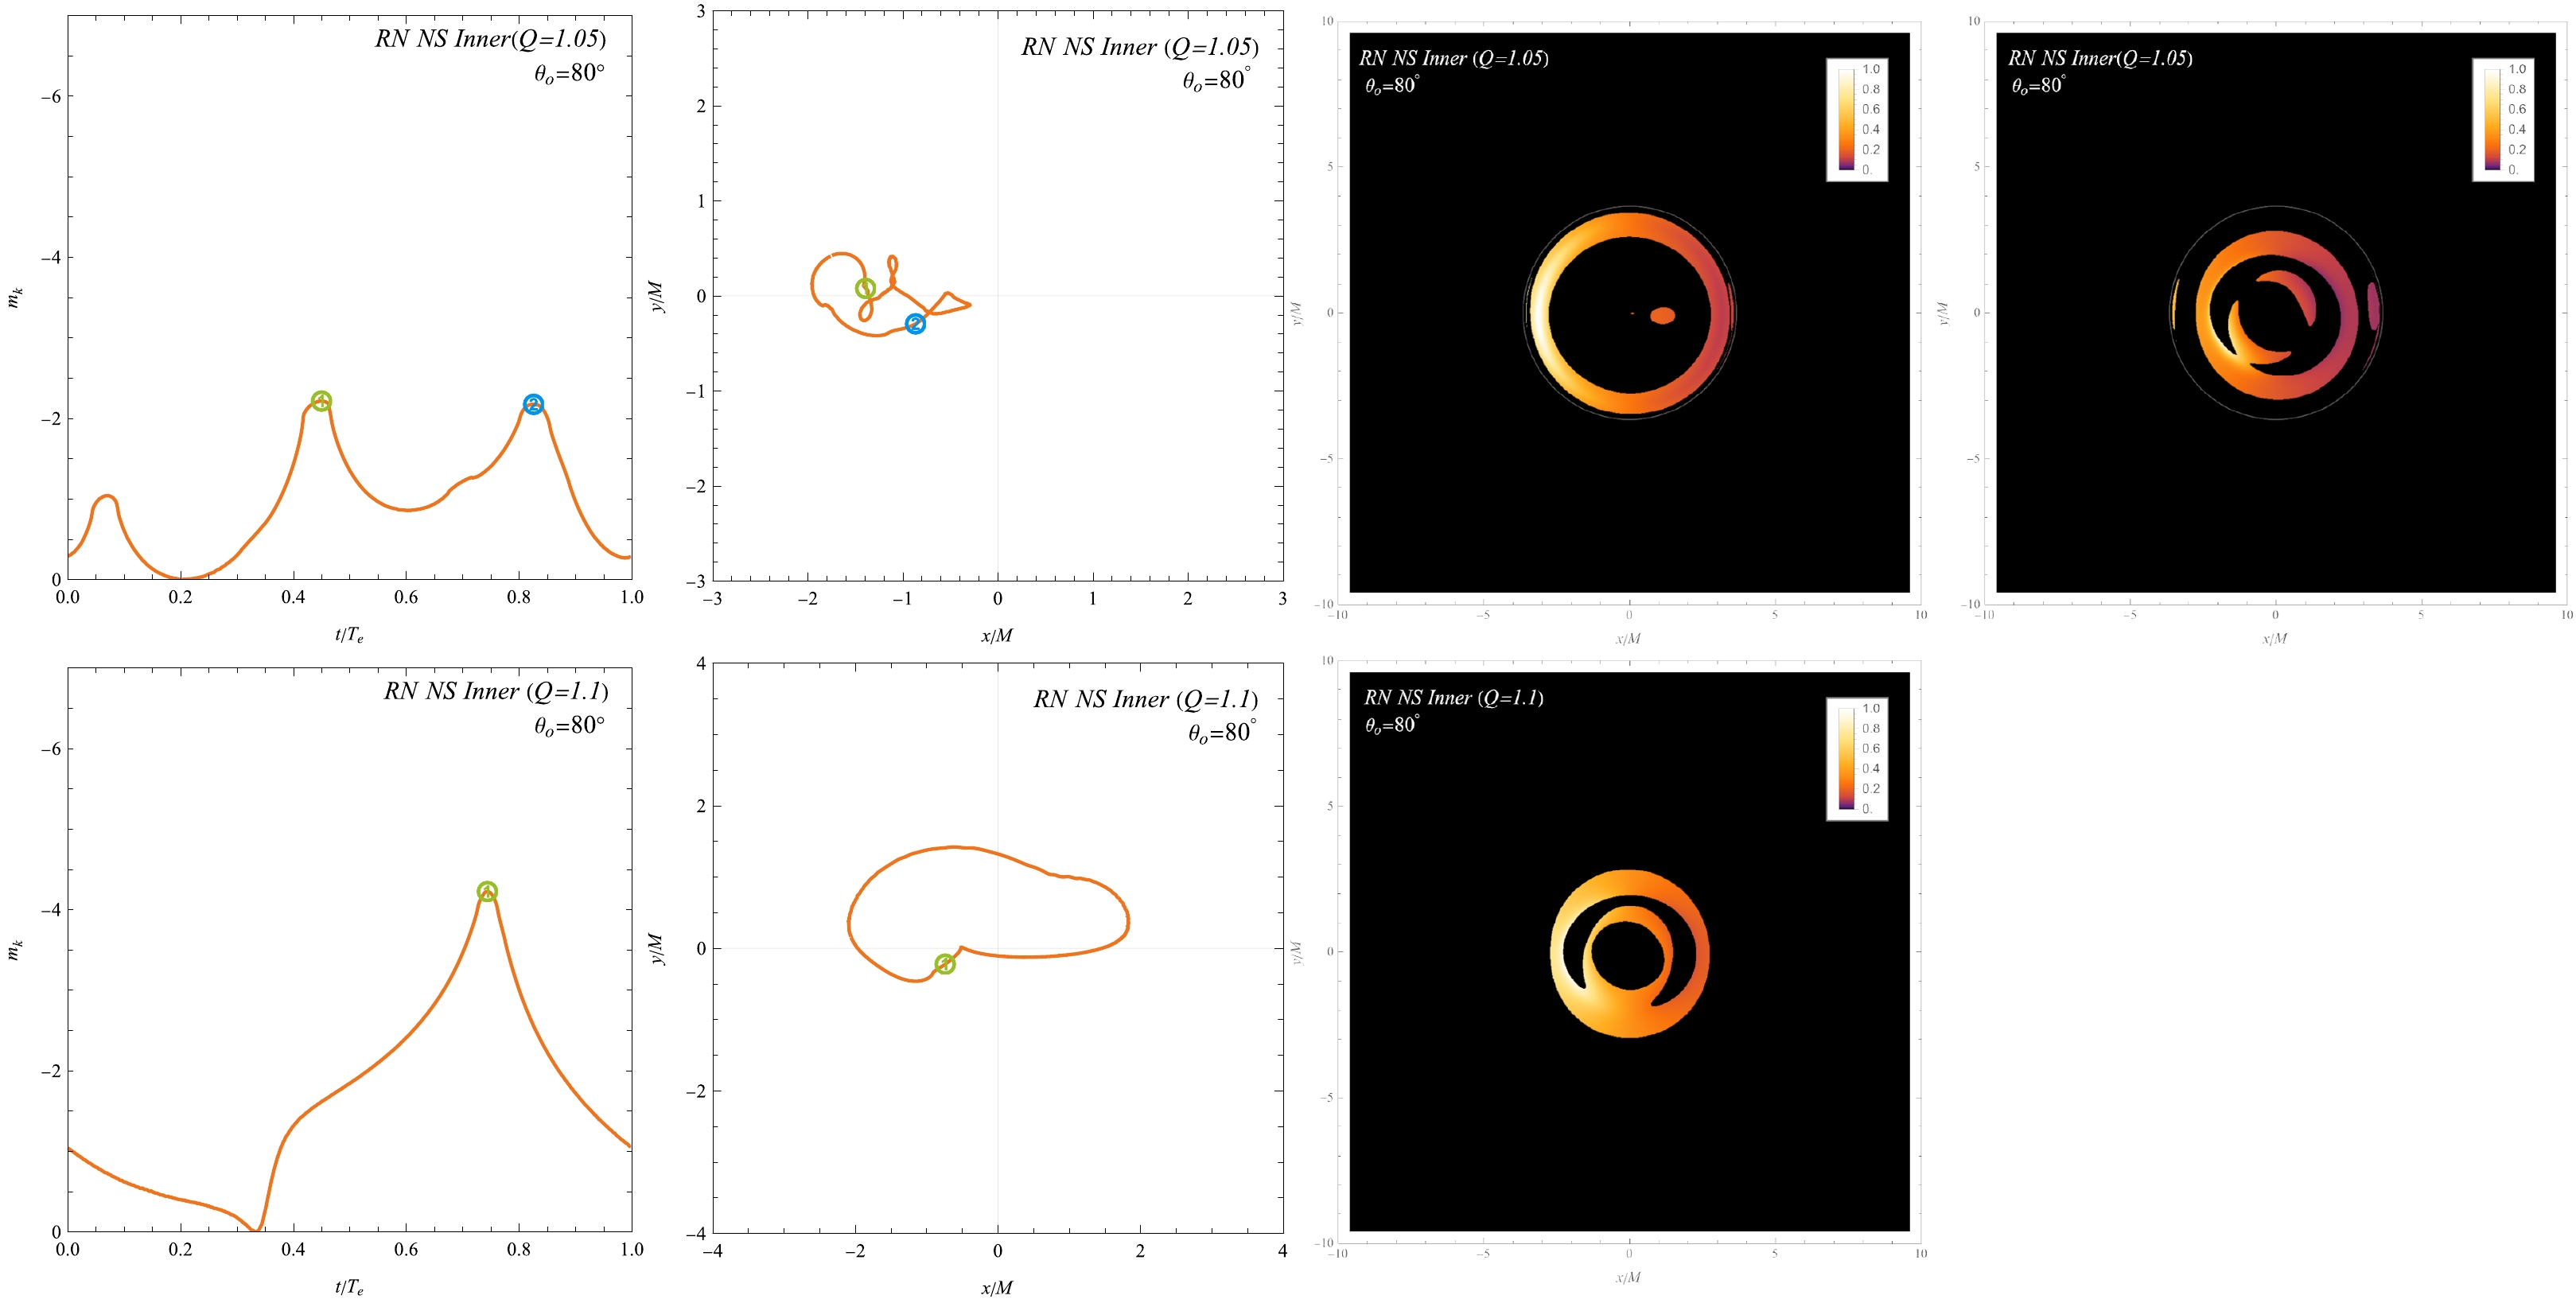
Figure 6. (color online) Temporal magnitudes
$ m_{k} $ (First Column) and centroids$ c_{k} $ (Second Column) as functions of$ t/T_{e} $ for cases$ Q/M=1.05 $ (Top Row) and$ Q/M=1.1 $ with the orbit near$ r^* $ (Bottom Row). The inclination is$ \theta_{o}=80^{\circ} $ . The highest and second-highest peaks of the temporal magnitude are indicated by ① and ②, respectively. The centroids of the flux at these peaks are identified with corresponding numbers. We also provide snapshots for the each cases, when the temporal magnitude reaches its highest peak (Third Column) and second-highest peak (Fourth Column). Note that only a single peak appears in the case of$ Q/M=1.1 $ .Figure 5 presents the results for three cases: the hot spot orbiting the RN black hole with
$ Q/M=0.9 $ at$ r_{\text{msco}} $ (top row), the hot spot orbiting the RN singularity with$ Q/M=1.05 $ at$ r_{\text{msco}} $ (middle row), and the hot spot orbiting the RN singularity with$ Q/M=1.1 $ at$ r_{\text{msco}}^{+} $ (bottom row). In all cases, the primary image ($ n=0^{>} $ ) generated by the hot spot close to the leftmost portion of its orbit dominates the flux at the highest peak (as shown in third column). This corresponds with our expectations based on the Doppler effect, as the hot spot approaching the observer on the left side experiences a blue shift, leading to a noticeable increase in the observed flux.Conversely, as the hot spot moves away from the observer, the primary image undergoes a phase of diminished flux, reducing its dominant contribution and enabling higher-order images to generate localized flux peaks. Notably, the secondary peak in each scenario reveals distinct contributors:
● For
$ Q/M=0.9 $ , the$ n=1^{>} $ image becomes a significant contributor to the total flux, leading to the secondary peak.● For
$ Q/M=1.05 $ , the$ n=2^{<} $ ,$ n=3^{<} $ and higher-order images within critical curve collectively contribute to the secondary peak.● For
$ Q/M=1.1 $ , the absence of a critical curve enables the$ n=2^{<} $ and$ 2^{>} $ images to emerge as dominant contributors at the secondary peak.These distinct contributions to the secondary peak in each case provide valuable characteristics for differentiating between them.
The corresponding centroids are presented in the second column of Fig. 5. When the primary image exhibits relative dominance, the temporal centroid coincides with the primary image's center. Doppler-induced flux reduction in the primary image, coupled with the presence of higher-order images, can significantly displace the centroid from the center of the primary image's orbit, resulting in the observed intricate trajectory in the vicinity of the center. Thus, the centroids correspondingly serve as a quantitative indicator of this asymmetry due to Doppler effects. As the influence of the Doppler effect on brightness increases, the asymmetry becomes more pronounced, leading to a greater shift in the corresponding centroids. This point has also been mentioned in previous studies and numerical simulations [66, 67, 75]. For
$ Q/M=1.05 $ , the presence of inner images further accentuates this intricacy of the centroid. Additionally, for$ Q/M=1.1 $ , the finite number of higher-order images leads to a smoother centroid.Figure 6 shows the results for two cases: the hot spots orbiting the RN black hole with
$ Q/M=1.05 $ (top row) and$ Q/M=1.1 $ (bottom row) at$ r=1.11M $ and$ 1.22M $ , respectively. Owing to the small radius of the orbit, the hot spot appears proximate to the observer-singularity line. Notably, the structural symmetry facilitates the formation of a circular ring in the snapshot image. Furthermore, the high imaging symmetry contributes to a centroid position situated closer to the center.Finally, we present the temporal magnitudes and centroids for an inclination angle of
$ \theta_{o}=50^{\circ} $ in Fig. 7. In contrast to the inclination of$ \theta_{o}=80^{\circ} $ , the temporal magnitudes at$ \theta_{o}=50^{\circ} $ exhibit a single peak. This difference results from the reduced influence of the Doppler effect at the lower inclination angle, which also indicates a decrease in the brightness asymmetry. Consequently, the flux becomes less frequency-dependent, enabling the primary image to dominate the total flux for a larger portion of the observation period. This minimizes the impact of higher-order images on the centroids, leading to a smoother and less intricate trajectory.
Figure 7. (color online) Temporal magnitudes
$ m_{k} $ (Upper Row) and centroids$ c_{k} $ (Lower Row) as a function of$ t/T_{e} $ for each cases. The inclination is$ \theta_{o}=50^{\circ} $ .This study utilizes mass M as the unit for angles of images, with a field of view of
$ 20M $ . However, interpreting image features requires considering actual physical sources such as Sgr A* and M87*. Their respective distances from Earth ($ 3.80\times10^{10} $ M and$ 5.39\times10^{10} \;\; M $ ) translate to angular sizes of approximately 108.52 and 76.52 μas, respectively, for ground-based observers. Consequently, the current angular resolution of the EHT at 25 μas limits the discernible detail in these images. However, the development of the ngEHT and space-based Very Long Baseline Interferometry (VLBI) are anticipated with projected resolutions of 15 and 1 μas, respectively [36, 76–78]. These technological advancements will represent remarkable milestones, providing an opportunity to enhance the resolution and capture additional details in these images. -
This study investigates the observational signatures of RN black holes and singularities, focusing on the hot spots orbiting celestial bodies. Interestingly, the presence or absence of a photon sphere, which significantly impacts the observed features of the orbiting hot spots, surrounding a RN singularity depends on the charge parameter
$ Q/M $ . To disentangle the diverse manifestations resulting from different scenarios within RN spacetime, we compare the observational signatures of RN black holes, RN singularities with a photon sphere, and RN singularities without photon spheres. The main discrepancy is expected to be more pronounced at an observational inclination angle of$ \theta_{o}=80^{\circ} $ . We summarize these differences as follows:● For the RN black hole, the observed features closely resemble those of Schwarzschild black holes: two distinct lensing image tracks emerge in time-integrated images capturing a complete hot spot orbit.
● In contrast, for the RN naked singularity with a photon sphere, images outside the critical curve mirror those of black holes. However, unlike black holes, RN naked singularities can exhibit additional images within the critical curve, leading to a distinct second peak in the magnitude profiles.
● Intriguingly, the RN naked singularity without photon spheres exhibit a finite number of tracks in the time-integrated image. Notably, incomplete and converging tracks appear. This merging and decomposition of tracks results in a rapid increase and decrease in magnitudes, forming a pronounced second peak.
The analysis of these image characteristics serves as an effective aid in distinguishing between RN black holes and singularities. It also contributes to exploring the nature of naked singularities and further assessing their potential as alternatives to black holes. With the advent of the next-generation Very Long Baseline Interferometry (VLBI), the ability to observe finer features is significantly enhanced. This will facilitate a wider range of potential avenues for detecting the aforementioned characteristics.
-
We are grateful to Guangzhou Guo and Xin Jiang for useful discussions and valuable comments.
Distinguishing the observational signatures of hot spots orbiting Reissner-Nordström spacetime
- Received Date: 2024-02-14
- Available Online: 2024-07-15
Abstract: This paper investigates observable signatures of hot spots orbiting Reissner-Nordström (RN) black holes and naked singularities. For an RN black hole, we find two discernible lensing image tracks in time integrated images, capturing a complete orbit of hot spots and a image shadow within the critical curve where photons with a small impact parameter fall into the event horizon. Conversely, in RN singularities, additional image tracks can be found within the critical curve, originating from photons reflected by the infinitely high effective potential well. Moreover, we find incomplete and converging tracks from the time integrated images of hot spot orbiting RN singularities that have no photon sphere. The presence of these additional image tracks significantly influences temporal magnitudes at their local maxima, enabling us to differentiate between RN black holes and RN naked singularities.


 DownLoad: