-
Experimental investigation of heavy and superheavy nuclei (so-called transfermium nuclei with
$ Z>100 $ ) is an advanced task owing to the small production cross-sections and short half-lives of these nuclei. The study of structural properties on the nanobarn and subnanobarn scales requires longer irradiation times followed by effective separation and detection methods. A systematic study of the decay properties of these exotic nuclei will bring us closer to answering the question regarding the limit of nuclear existence in terms of mass and charge.Most known nuclei in the transfermium region decay via α-decay or spontaneous fission (SF). SF is one of the most complex processes in nuclear physics, mainly owing to the variety of possible output configurations. In the SF process, it is a frequent practice to divide the entire process into two parts. The first consists of the mother nucleus overcoming multiple fission barriers by quantum tunneling, which determines the SF half-life of the nucleus. The second is the evolution of a fission system on the potential energy surface (PES) from the penetration to the fission point. It defines the properties of fission fragments such as the kinetic and excitation energies.
Our experimental investigation involves studying the multiplicity distribution of prompt neutrons emitted by excited fission fragments in the SF process. The average number of neutrons per SF event helps to describe the static part of the process, i.e., the configuration of the statistical equilibrium. In addition, it was previously shown [1, 2] that an asymmetrical shape of the neutron multiplicity distribution could indicate the existence of additional SF modes.
The classical approach to describing the SF process considers fission from the ground state. At the same time, the existence of long-lived K-isomeric states is a common feature [3] and the question regarding the possibility of observing SF directly from high-K states is rising in popularity. However, theoretical investigations predict high hindrances for such events [4, 5], mostly owing to wider fission barriers for the isomeric state in comparison with the ground state.
The existence of a long-lived K-isomeric state in combination with a large neutron deficit makes 250No an interesting candidate for research. An SF activity of 36 μs was first reported for 250No in [6]. Subsequently, two activities (5.6 μs and 54 μs) were observed in [7], but the longer-lived activity was wrongly attributed to 249No. Later, using the mass analyzer FMA [8], it was confirmed that both activities belonged to 250No. An interesting result was then reported in [9], in which the average multiplicities of prompt neutron emission in the SF corresponding to each activity were measured for the first time. The difference between the average number of neutrons per SF for the short- and long-lived states was found to be large (4.38
$ \pm $ 0.13 and 3.9$ \pm $ 0.2) but still statistically insignificant (the difference$ \approx 2\sigma $ ). Nevertheless, this result strongly hinted at possible SF direct from the isomeric state. In [10], the internal decay branch from the isomer was observed for the first time, allowing for a first estimate of the excitation energy of the high-K isomer and indicating that the longer-lived SF activity could be due to delayed SF of the ground state. The dependence of the isomer population probability on the excitation energy was first shown in [11], and finally, experimental evidence for the existence of a second isomeric state in 250No as well as arguments against SF of the lower-lying isomer were given in [12].The main aim of this study was to verify the experimental results of [9] using a more advanced experimental setup and larger sample size to clarify whether there is evidence of K-isomer fission due to differences in the prompt neutron multiplicity distributions.
-
The complete fusion reaction 204Pb(48Ca, 2n)250No was used to produce nuclei of interest. A beam of 48Ca ions was delivered from the U-400 cyclotron with an energy of (
$ 226.5\pm 2.0 $ ) MeV at the FLNR of JINR. Isotopically enriched 204PbS targets (450 μg/cm2 thickness, 99.94% enrichment and with 1.5 μm thick Ti backing) were used. The estimated energy at the middle of the target was (215$ \pm $ 2) MeV. The desired evaporation residues (ERs) were separated from other reaction products, and the primary beam moved out of the target using the velocity filter SHELS (Separator for Heavy ELement Spectroscopy) [13].The ERs passed the time-of-flight (TOF) system placed just after the separator. The TOF system consisted of mylar foils covered in a
$ 30-40 $ ${\rm {\text μ} g / cm^2} $ thick gold layer and micro-channel plates (MCPs) [14]. An external magnetic field was used to guide the emitted electrons to the sensitive part of the MCPs. The TOF signals helped to distinguish whether the signal in the main detection system was caused by ER implantation or decay inside the detector.The detection system SFiNx [15] was used in the experiment. It consists of a box-like assembly of double-sided silicon strip detectors (DSSDs) surrounded by 116 neutron counters filled with
$ ^3{\rm He} $ at$ 7 $ atm pressure. The high granularity of the neutron detector allows it to detect multiple neutrons simultaneously. The average neutron lifetime in the setup was$ (19.0\pm 0.1)~{\rm {\text μ} s} $ . Single neutron detection efficiency calibration was carried out using the source 248Cm. It was assumed that the energy spectrum of prompt SF neutrons of 250No does not differ significantly from that of 248Cm [16]. The rapid dependence between the single neutron detection efficiency and the geometry of the fission fragment emission was noted. In the case where only one fission fragment was detected in the DSSD box, the efficiency was reduced, which could easily be described by a correlation between neutron emission direction and the axis of SF in the laboratory frame. To achieve higher detection efficiency with smaller uncertainty, only SF events for which both fragments were detected in the DSSD box were considered during the calibration. The single neutron detection efficiency was$ (56\pm 1) $ %.The DSSD placed at the focal plane of SHELS consisted of
$ 128\times 128 $ strips, and its area was$ 100\times 100 $ $ {\rm mm^2} $ . Eight side$ 16\times 16 $ DSSDs of$ 50\times 60 $ ${\rm mm^2} $ were located around the focal plane DSSD in the backward direction. DSSD energy calibration at α-particle energies was performed using the 174Yb(48Ca, xn)222-xTh reaction. -
The search for SF events was conducted through the identification of time-correlated
$ ER\to SF $ chains. The energy of implanted recoils detected at the focal plane, coinciding with the TOF signal, is required to be in the range$ (1-20) $ MeV. After an ER implantation, fission events exhibiting energies exceeding$ 40 $ MeV were examined in the same detector pixel in the time window of$ 500~{\rm {\text μ} s} $ . The analysis yielded 1357 ER-SF correlations, which equates to an approximate total of$ 6\times 10^{17} $ incident 48Ca ions passed through the 204Pb target.The
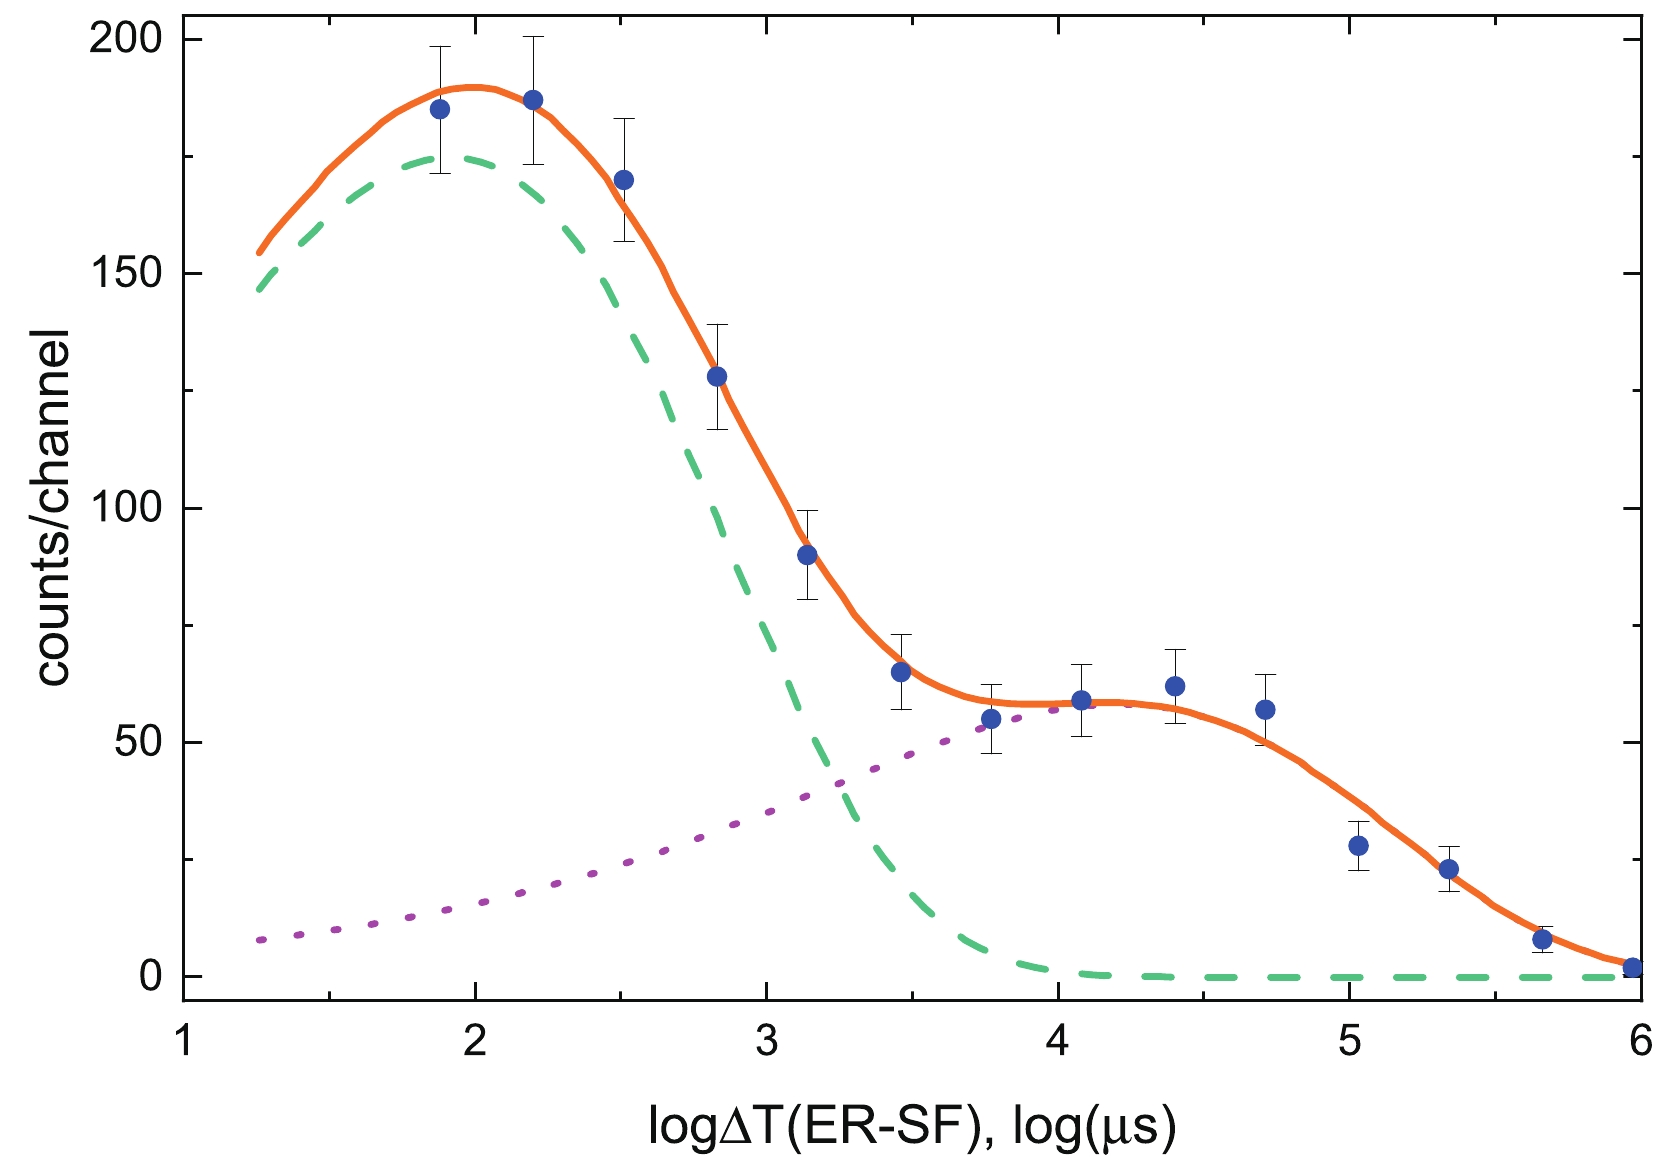
$ ER-SF $ time difference distribution histogram is shown in Fig. 1. The time-logarithmic scale was used to extract half-lives according to [17−19]. The dead time of the detection system was$ 4.5 $ $ {\rm {\text μ} s} $ (or$ \approx 1.5 $ in log scale). The decay curve for a single activity$ f_s $ as a function of time t, decay constant λ, and the initial number of radioactive nuclei n is presented in Eq. (1) as well as the fitting function for the double decay curve$ f_d $ as a function of two sets of parameters.
Figure 1. (color online)
$ \Delta T (ER-SF) $ time distribution. The experimental data (blue dots) were fitted by a two-component exponential curve (orange solid line). The short-lived (green dashed line) and long-lived (purple dotted line) components were extracted from the fitting.$ \left\{\begin{array} {l} \theta = {\rm log}(t) \\ f_s(\theta, n, \lambda) = n\cdot {\rm exp}\left( \theta + \log{\lambda} \right){\rm exp}\left(-{\rm exp}\left(\theta + \log{\lambda}\right)\right) \\ f_d(\theta, n_1, \lambda_1, n_2, \lambda_2) = f_s\left(\theta, n_1, \lambda_1 \right) + f_s\left(\theta, n_2, \lambda_2\right) \end{array} \right. $

(1) The fitting quality was verified using the chi-square test (
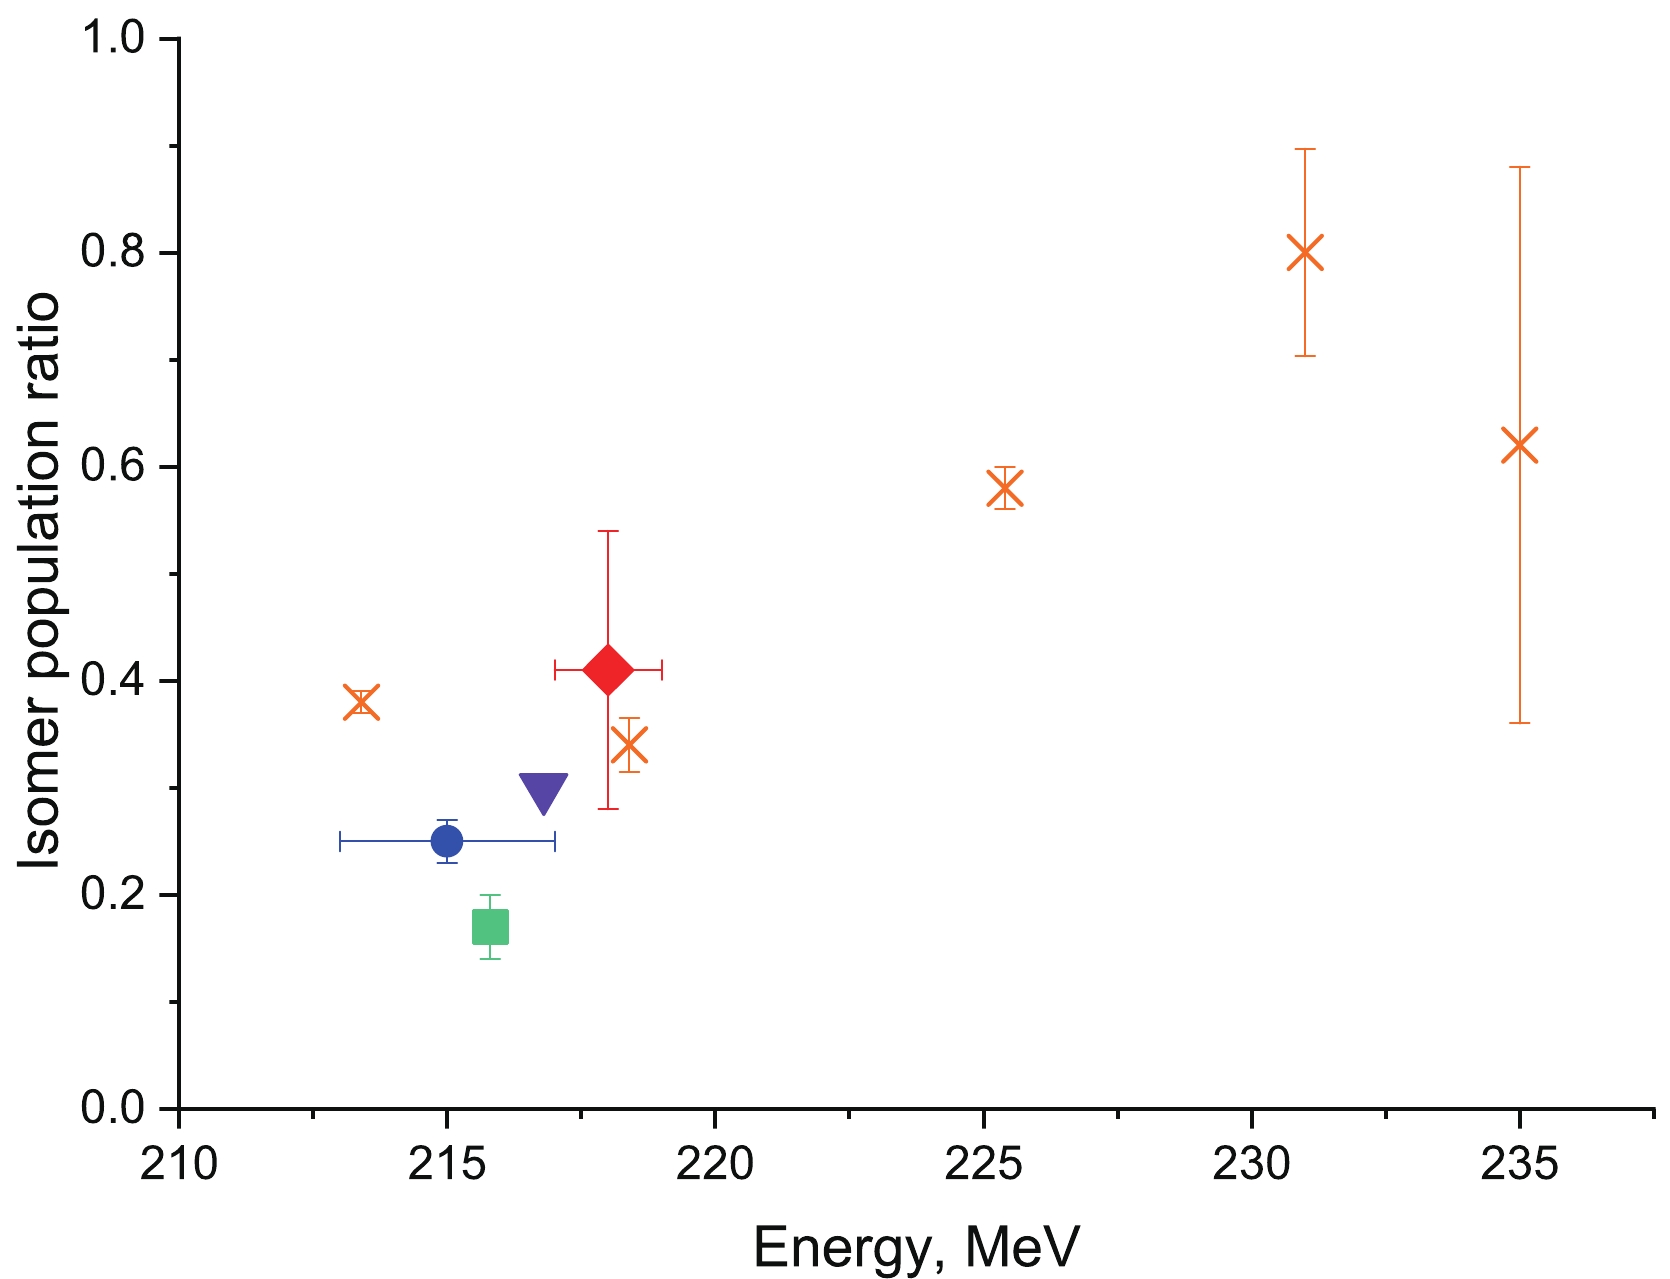
$ \chi^2=4.7 $ p-value$ =0.79 $ ). The half-lives of the two activities extracted from the fitting were$ (4.7\pm 0.2) $ $ {\text μ} \rm s $ and$ (46\pm 4) $ $ {\text μ} \rm s $ . By extrapolating the fitting curve to the zero-time moment, it was possible to estimate the total number of events for each activity. For the short- and long-lived components, the expected numbers of nuclei were$ 1510\pm 50 $ and$ 500\pm 50 $ , respectively. Using these numbers, the isomer population probability was estimated to be$ 0.25\pm 0.02 $ . This value is in agreement (Fig. 2) with previously published results [8, 10, 11, 12] for the same reaction.
Figure 2. (color online) Isomer population probability dependence on the energy of 48Ca ions at the middle of the 204Pb target. The dot represents the results of the current study. Other experimental data are represented by triangles for Peterson et al. [8], rhombus for Kallunkathariyil et al. [10], crosses for Tezekbayeva et al. [11], and squares for Khuyagbaatar et al. [12].
The first question regarding neutron multiplicities is as follows: Is there a significant difference in the neutron multiplicities of SF events associated with short- and long-lived activities? Fig. 1 shows that the activities are strongly mixed. To solve this issue, the likelihood functions attributed to the short-lived activity
$ P(A|\theta) $ and long-lived activity$ P(B|\theta) $ were used (Eq. (2)).$ \left\{\begin{array}{l} P(A|\theta) = \dfrac{f_s(\theta, n_1, \lambda_1)}{f_s(\theta, n_1, \lambda_1)+f_s(\theta, n_2, \lambda_2)} \\ P(B|\theta) = 1 - P(A|\theta) \end{array} \right. $

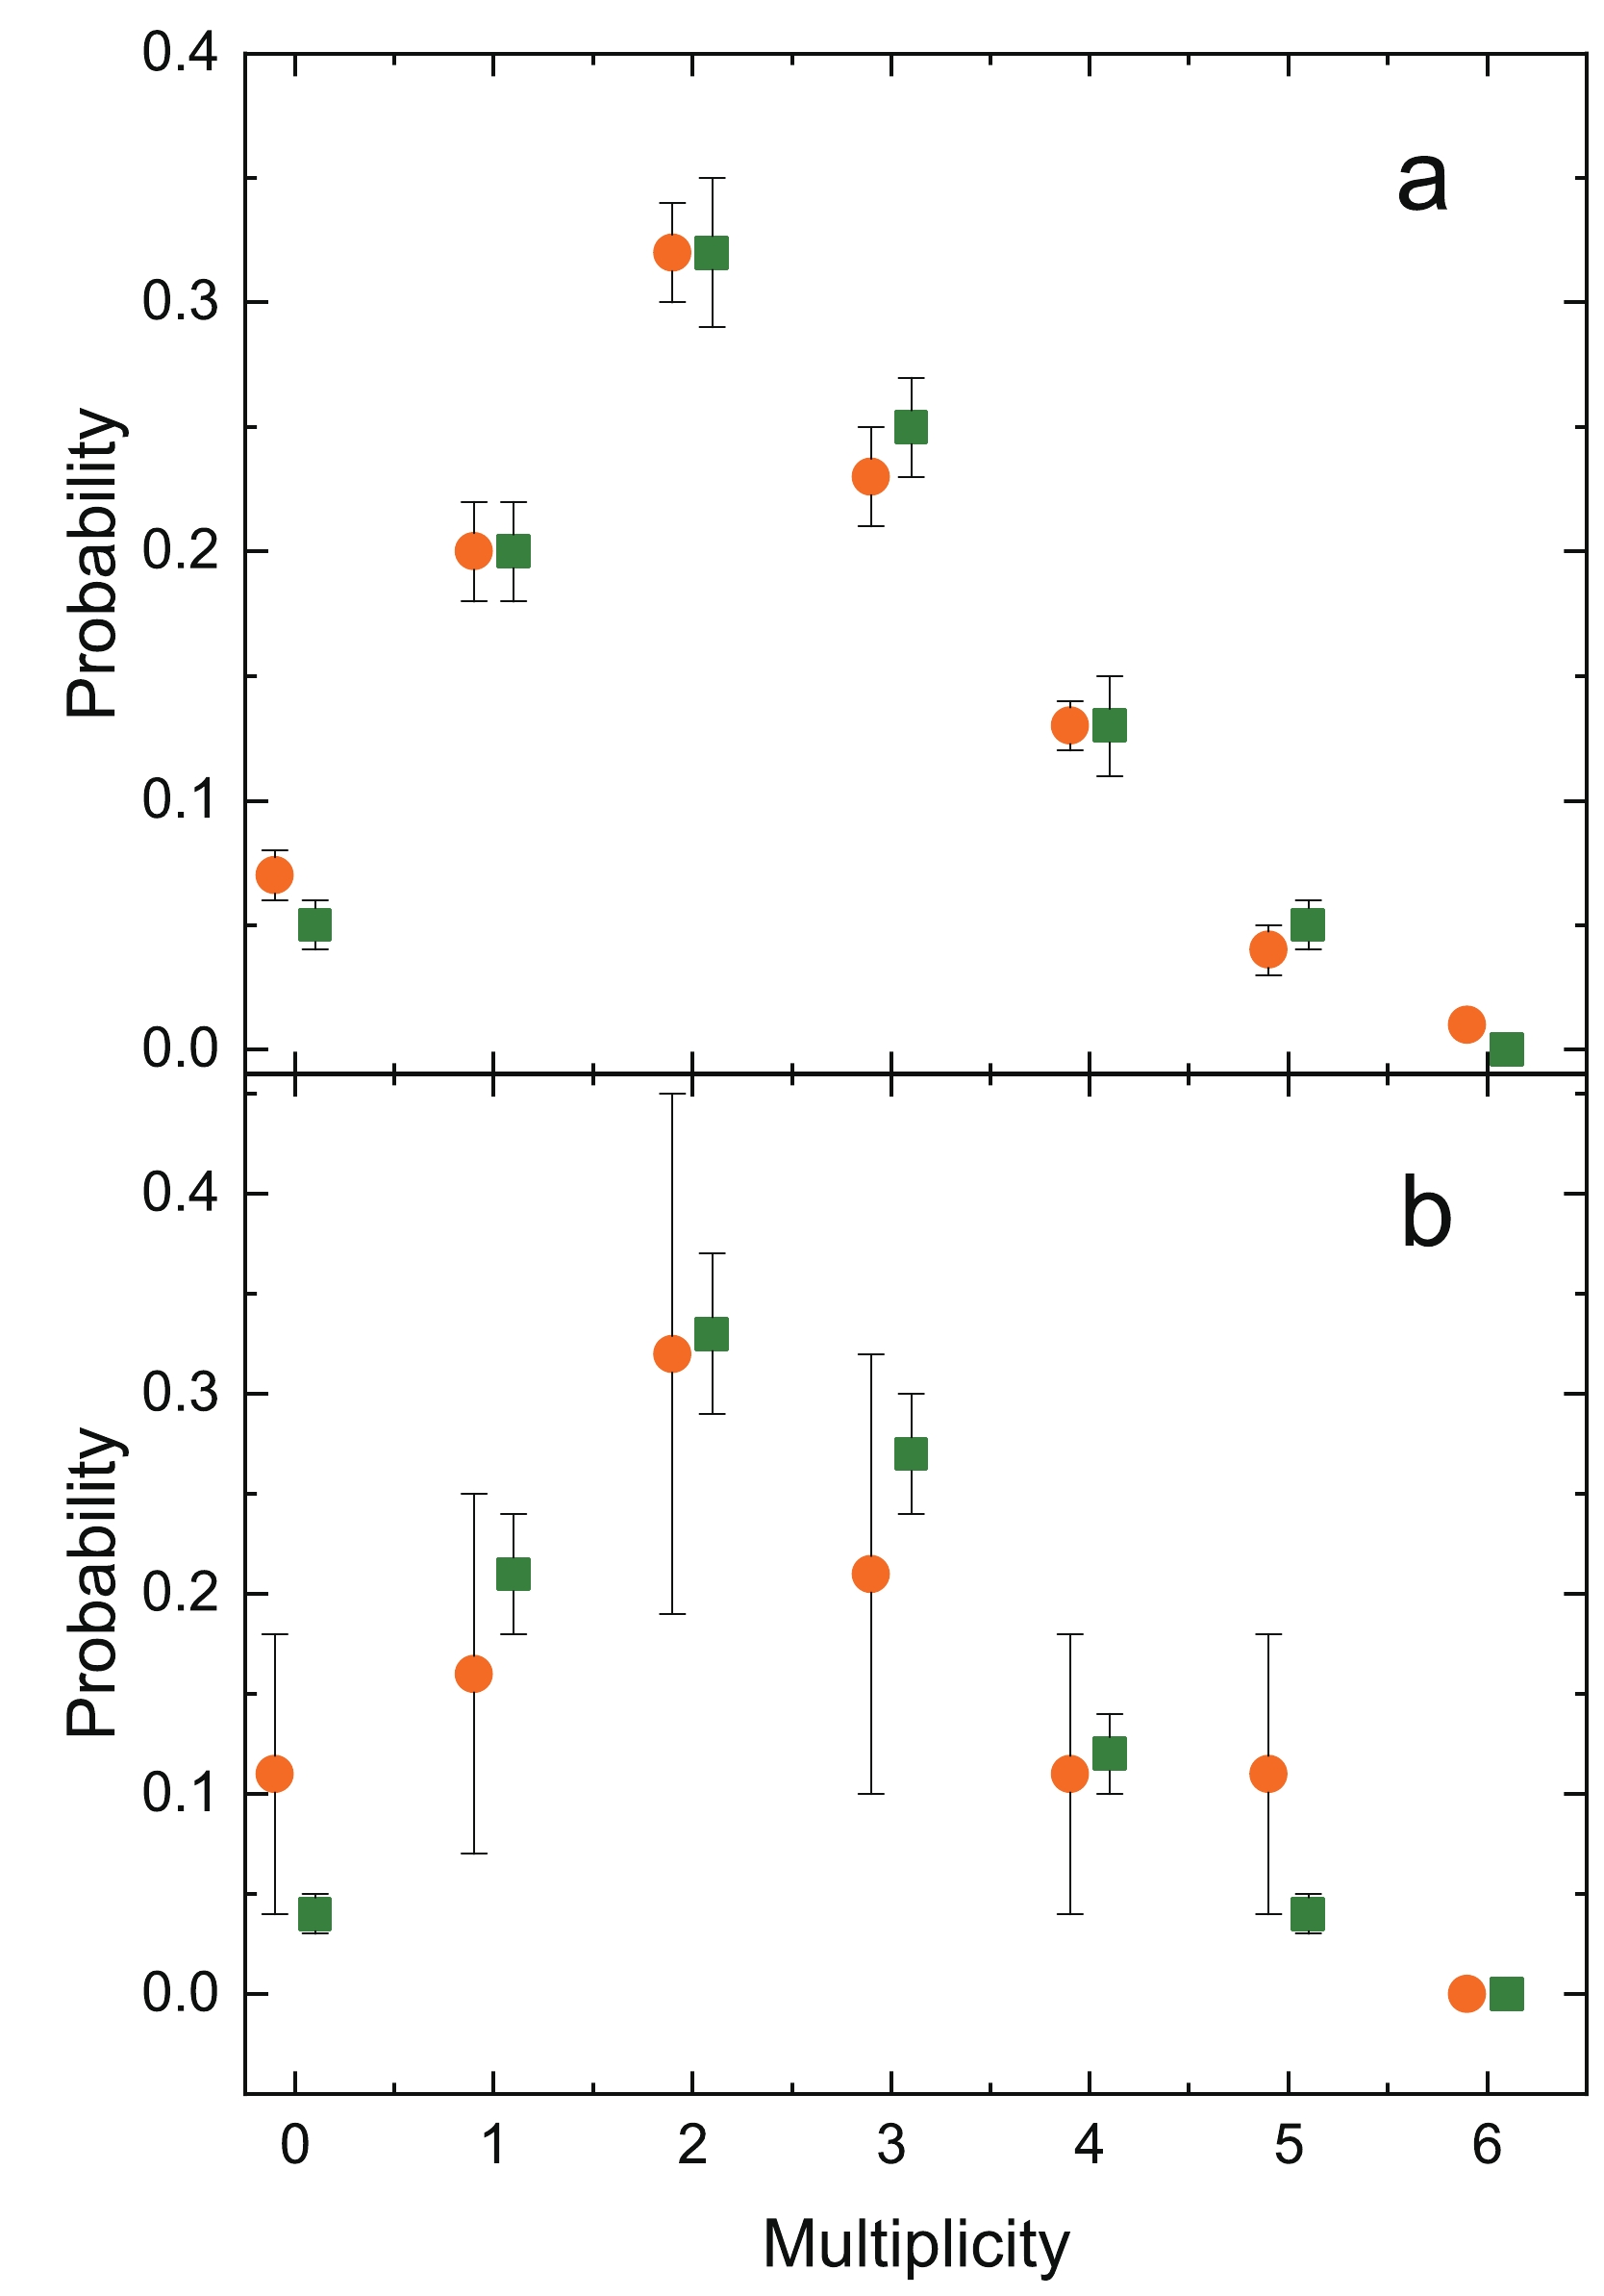
(2) The first method of constructing two prompt neutron multiplicity distributions corresponding to the two activities was to attribute every SF event to both activities with weights equal to the corresponding likelihoods (Eq. (2)). The resulting distribution is shown in Fig. 3(a). The following statistical tests were conducted: the t-test for a mean value comparison (p-value=
$ 0.20 $ ) and the Kolmagorov-Smirnov (p-value=$ 0.57 $ ) test to compare the shapes of the distributions. According to both tests, no evidence was found to suggest dissimilarities between the distributions of Fig. 3(a).
Figure 3. (color online) Prompt neutron multiplicity distributions attributed to short-lived (orange circles) and long-lived (green squares) activities. (a) All SF events were used with weight coefficients. (b) Only SF events that could be confidently attributed to the activity were used. See text for details. Dots have been shifted along the horizontal axis for better visual comparison.
An alternative approach involves considering only the SF events that can be confidently attributed to the specific activity, i.e. with a likelihood value (Eq. (2)) not less than 95%. Although this method simplifies the process, it also reduces the sample size and increases uncertainties. The resultant distributions are displayed in Fig. 3(b). The same series of statistical tests was conducted, including the t-test (
${p\text{-}{\rm value}}=0.91$ ) and Kolmogorov-Smirnov test (${p\text{-}{\rm value}}=0.99$ ). Once again, no evidence was found to indicate a significant difference between the two distributions. As there was no significant difference between activities concerning the prompt neutron multiplicity distribution, all SF events are considered in combination in the following discussion.The background influence was measured in two different ways. The first was the average load of the detector during the experiment. The value of
$ \approx 100 $ neutron/sec (or 0.0128 neutron/window) was obtained for the entire neutron detection system. The second method involved searching for background neutrons in coincidence with observed SF events but sufficiently far in time to not include neutrons emitted in the fission process. For this, the search for background neutrons was performed via the analysis of 20 time windows of length$ 128~ {\text μ} \rm s $ for each event of SF in the range$(2440-5000) ~{\text μ}\rm s$ . The average lifetime of the neutron in the setup was approximately$20~ {\text μ} \rm s$ [15]; therefore, the overlap with neutrons emitted in SF was negligible. The total number of observed time windows was$ 27140 $ , and the average background neutron multiplicity was$ 0.015 $ neutron/window. The results are shown in Table 1 and are in good agreement with the average load of the detection system. The background neutron multiplicity distribution given in Table 1 was used to perform background correction.k N $ f_b $ 

ν 0 32 0.9852 0.009 $ \pm $ 0.007

1 100 0.0145 0.004 $ \pm $ 0.006

2 169 $ 2.7 \times 10^{-4} $ 

0.102 $ \pm $ 0.015

3 125 0 0.226 $ \pm $ 0.018

4 63 0 0.280 $ \pm $ 0.019

5 18 0 0.232 $ \pm $ 0.020

6 3 0 0.120 $ \pm $ 0.017

7 0 0 0.024 $ \pm $ 0.013

8 0 0 0.002 $ \pm $ 0.003

9 0 0 0.001 $ \pm $ 0.003

Table 1. Observed number of events in the experiments N, the probability of detecting background neutrons of the given multiplicity
$ f_b $ , and the restored emission probability ν for the prompt neutron multiplicity k for 250No. See text for details.The prompt neutron multiplicity distribution obtained in the experiment was highly distorted owing to the detection efficiency (far from 100%) and background influence. To achieve accurate results, only SF events observed in coincidence with the signal in the side detectors (
$ \approx 40 $ % of the total amount of events) were considered while restoring the true distribution. The average number of emitted prompt neutrons per SF of 250No after background and efficiency correction was$ (4.1\pm 0.1) $ .The distortion of the prompt neutron multiplicity distribution shape caused by the single neutron detecting efficiency was corrected using the statistical Tikhonov regularization technique. This method introduces additional information to the system, such as the smoothness or non-negativity of the resulting distribution. The description of the technique and the usage examples can be found in [20−22]. The restored prompt neutron multiplicity distribution is presented in Table 1 and Fig. 4.
-
250No is the most neutron-deficient nobelium isotope for which the prompt neutron multiplicity distribution has been analyzed. In the row of neighbor isotopes 252,254No [15, 23], the SF properties did not appear exotic and followed the systematics of an average number of neutrons per SF event:
$ \bar{\nu}_{250}=4.1 \pm 0.1 $ ,$ \bar{\nu}_{252}=4.25 \pm 0.09 $ [15], and$ \bar{\nu}_{254}=4.9 \pm 0.5 $ [23]. However, the shape of the distribution was highly symmetrical (Fig. 4) and highlighted the isotope in the list of transfermium isotopes with known neutron multiplicity distribution shape [24].To describe the obtained SF properties, several calculations were performed. To calculate the neutron multiplicity, we assumed that soon after crossing a fission barrier, the fissile nucleus (
$Z,~A$ ) could be described as a superposition of binary systems specified by the mass, charge, and deformation of constituent fragments$n_i= (A_{1i},Z_{1i}, \beta_{1i},A_{2i},Z_{2i},\beta_{2i})$ with$ Z_{1i}+Z_{2i}=Z $ and$ A_{1i}+A_{2i}= A $ . Initially, the formed binary system evolves in deformation and mass(charge)-asymmetry degrees of freedom until it eventually decays in the relative distance. The potential energy of the binary system$ U(n_i) $ as a function of the mass, charge, and deformation of its fragments was calculated within the improved scission point (IMP) model [25]. The decay in the relative distance was determined by the competition between the repulsive Coulomb and attractive nuclear parts of the interaction potential between the fragments [26]. The evolution of the population of the state n with time is described by the master equation$ \begin{aligned}[b] \frac{{\rm d} P(n)}{{\rm d} t}=\;&\sum\limits_{n,n'} \left ( \Lambda_{n,n'}P(n')\right. \\ & - \left.\left [ \Lambda_{n',n}+\Lambda_d(n) \right ]P(n)\right ). \end{aligned} $

(3) The macroscopic transition probabilities were taken as proportional to the level densities of the final states (see [27])
$ \Lambda_{n,n'}/\Lambda_{n',n}=\rho_{n'}(U_{CN}-U(n'))/\rho_{n}(U_{CN}-U(n)) $ , where$ U_{CN} $ is the energy of the fissile nucleus. The level densities were taken as those for Fermi gas with the level density parameter$ a = A/12 $ [2]. For the decay probability$ \Lambda_d(n) $ , the level density was taken at the top of the barrier in the interaction potential.Solving Eq. (3), we obtained the distribution of the binary systems at the moment of decay. The fission observable was then determined using the properties of these binary systems [25].
The selection of the initial distribution of the binary systems was performed as explained in [2], by taking all the systems whose quadrupole moment lay in the 10% range around the fixed value
$ Q_{2} $ .$ Q_{2} $ was fixed to give the best description of the average number of evaporated neutrons in the SF of nuclei with$ Z \sim 100 $ [28].The model prediction for the neutron multiplicity distribution is in good agreement with the experimental results (Fig. 4). This gives us confidence in the calculation results, which we can use to discuss other SF properties that are impossible to measure in the present experimental setup, such as the total kinetic energy (TKE) and fragment mass distributions, as shown in Fig. 5.

Figure 5. (color online) Calculated total kinetic energy (a) and fragment mass (b) distributions. The solid line corresponds to the total distribution, whereas the dashed lines correspond to decomposition per group of neutrons: circles - 0-1 neutrons, triangles - 2-3 neutrons, rhombus - 4-7 neutrons, and squares - 8-9 neutrons. Owing to the low probability of emitting 0-1 and 8-9 neutrons, the corresponding curves are shown in isolation in the same x-axis scale.
-
An experimental study of the SF properties of 250No nuclei produced in the hot-fusion reaction 204Pb(48Ca, 2n)250No was conducted. Two activities with half-lives of
$ (4.7\pm 0.2) $ μs and$ (46\pm 4) $ μs were observed. The main aim of this study was to determine whether the analysis of the prompt neutron multiplicity distributions could provide strong evidence of the prevalence of SF of the K-isomeric state of 250No compared to the delayed fission of the ground state. To achieve this, 1357 SF events were analyzed. Two methods were used to attribute SF events to their rightful activity. According to statistical tests, the average values of the extracted distributions and the shapes of the distributions did not differ significantly. The achieved results could not provide a clear answer to whether the long-lived activity of 250No is caused by direct SF from the K-isomeric state or by delayed fission of the ground state after electromagnetic transitions. It can be concluded that the analysis of the prompt neutron multiplicity distribution does not allow us to confidently answer the question as expected from the results of [9].The average number of neutrons per SF of 250No was determined to be
$ (4.1 \pm 0.1) $ . The prompt multiplicity distribution emitted in SF of 250No was restored using the Tikhonov regularization method and published for the first time. In addition, the probability of populating the isomeric state was estimated and compared with the previously published values.Despite the numerous experiments that have been conducted to study 250No, many open questions remain. For example, the energy of the K-isomer as well as its configuration and the total number of isomeric states are still unclear. The 250No isotope creates challenges for experimental and theoretical groups and is worth further investigation.
Partial financial support was received from JINR, grant number 23-502-06. The authors have no competing interests to declare that are relevant to the content of this article.
Prompt neutron emission in 250No spontaneous fission associated with ground and isomeric state decays
- Received Date: 2024-02-14
- Available Online: 2024-06-15
Abstract: The complete-fusion reaction 204Pb(48Ca,2n)250No was used to study two activities of 250No with distinct half-lives. A total of 1357 events were observed in the SFiNx neutron detection system. The average number of neutrons emitted per spontaneous fission of 250No was determined to be


 Abstract
 HTML
HTML Reference
 Related
 PDF
PDF


 DownLoad: