-
The synthesis of superheavy elements (SHEs) is one of the most fascinating and challenging tasks in low-energy heavy-ion nuclear physics. One of the main goals of SHE research is to search for an island of stability arising from the presence of closed nuclear shells in the superheavy nuclear region [1]. The macro-microscopic nuclear model predicts that the stability of superheavy nuclei (SHN) is significantly enhanced when approaching the closed spherical shells at Z = 114 and N = 184 [2].
In recent decades, considerable experimental progress has been made in the synthesis of SHEs. The synthesis of nuclei with Z = 107–113 using cold fusion reactions based on
$ ^{208} $ Pb or$ ^{209} $ Bi targets [3, 4] and with Z = 114 to 118 via hot fusion reactions of$ ^{48} $ Ca with actinide targets has been reported [5, 6]. There have also been attempts to synthesize new SHN with Z =119 and 120. For example, the$ ^{64} $ Ni +$ ^{238} $ U [7],$ ^{58} $ Fe +$ ^{244} $ Pu [8],$ ^{54} $ Cr +$ ^{248} $ Cm [9],$ ^{50} $ Ti +$ ^{249} $ Cf [1], and$ ^{50} $ Ti +$ ^{249} $ Bk [1] reactions have already been investigated. However, none of these experiments have provided evidence for the successful synthesis of new elements.To produce new elements with proton number Z = 119 or 120, the Institute of Modern Physics, Chinese Academy of Sciences (IMP-CAS) constructed the China Accelerator Facility for Superheavy Elements (CAFE2). Beams with medium mass, such as
$ ^{50} $ Ti,$ ^{51} $ V,$ ^{54} $ Cr, and$ ^{55} $ Mn, can be used to bombard radioactive actinide targets, producing SHN. As mentioned above, attempts to synthesize elements with Z = 119 and 120 using beams of$ ^{50} $ Ti and$ ^{54} $ Cr have not been successful. Considering the expansibility of experiments and the accessibility of materials, the$ ^{55} $ Mn +$ ^{244} $ Pu and$ ^{55} $ Mn +$ ^{243} $ Am reactions might be promising for the synthesis of the new elements 119 and 120. To investigate the performance of the$ ^{55} $ Mn beam in synthesis experiments, the$ ^{55} $ Mn +$ ^{159} $ Tb reaction was studied. -
The experiment was performed on a gas-filled recoil separator known as the Spectrometer for Heavy Atoms and Nuclear Structure-2 (SHANS2) [10, 11] at CAFE2 in Lanzhou, China. The
$ ^{55} $ Mn$ ^{18+} $ beam was accelerated to 257 MeV by a superconducting linear accelerator. The beam energy corresponds to the maximum yield of the 4n evaporation channel, which is calculated by the HIVAP code [12]. The total beam dose was determined by regularly measuring the beam intensity with the Faraday cup installed upstream of the differential pumping system. The beam intensity was approximately 160 pnA.The targets of natural terbium (
$ ^{159} $ Tb) were 400 μg/cm$ ^{2} $ thick, evaporated on carbon foils with a thickness of 60 μg/cm$ ^{2} $ . Twenty arc-shaped$ ^{159} $ Tb targets were mounted on the edge of a rotating wheel with a diameter of 50 cm, and the wheel was rotated at 2000 rpm during the irradiation.The recoiled evaporation residues (ERs) were separated in-flight from the primary beam particles using the gas-filled recoil separator SHANS2 filled with helium gas at 0.8 mbar. The magnetic rigidity was set to 1.588 T
$ \cdot $ m. The ERs were implanted into a 300-μm-thick double-sided silicon strip detector (DSSD, model BB-17) with a sensitive area of 128 × 48 mm$ ^{2} $ . The silicon strip width of the DSSD was 1 mm, forming a total of 6144 pixels. Six 500-μm-thick side silicon detectors (SSD, model W4) were mounted perpendicular to the face of the DSSD. Each SSD, with an active area of 120 × 63 mm$ ^{2} $ , was divided into eight 15 × 63 mm$ ^{2} $ strips. All silicon detectors were manufactured by Micron Semiconductor Ltd. The SSDs were used to detect escaping α particles. The total detection efficiency of the detector system for α particles emitted from the implanted nuclei was measured to be 86(8)%, of which the DSSD contributed 55%. Two multi-wire proportional chambers (MWPCs) mounted approximately 26 cm upstream of the DSSD were used to distinguish α-decay events from the implanted recoils. The MWPCs were filled with isobutane gas at a pressure of 370 Pa. To minimize interference from scattered energetic light ions in the DSSD, three silicon detectors with a thickness of 300 μm and a sensitive area of 50 × 50 mm$ ^{2} $ were mounted behind the DSSD and used as veto detectors. In addition, an alcohol cooling system was used to bring the temperature of all silicon detectors down to approximately$ -20\,^{\circ}\mathrm{C} $ to obtain a good energy resolution.Signals from all the preamplifiers of the DSSD, SSDs, MWPCs, and veto detectors were recorded by employing a digital data acquisition system, which consisted of 30 wave-form digitizers V1724 from CAEN S.p.A [13]. The silicon detectors were calibrated using a standard source consisting of
$ ^{239} $ Pu,$ ^{241} $ Am, and$ ^{244} $ Cm and known α particles from$ ^{207,208} $ Ra,$ ^{207\rm m} $ Ra, and their daughter nuclei, which were produced in the$ ^{55} $ Mn +$ ^{159} $ Tb reaction. The typical energy resolution with all the strips summed up was approximately 30 keV (FWHM) for 6–8 MeV α particles detected by the DSSD. The energy of escaping α-particles could be reconstructed by adding the energy deposition in the DSSD and SSDs. The typical energy resolution for the reconstructed α particles was 96 keV (FWHM). -
The identification of nuclei produced in the present experiment was performed by searching for energy-position-time correlated α-decay chains with the help of the known α-decay properties of their descendants. Figure 1 shows the energy spectrum of all particles observed in the DSSD and vetoed with the MWPCs and veto detectors. All peaks with high statistics can be identified by the energy and half-life of their α particles. The Ac and Ra isotopes were produced from charged-particle evaporation channels. The α-decay properties of these isotopes observed in this study are listed in Table 1, which are compared with literature values. It is noted that these data agree well with the known decay properties.
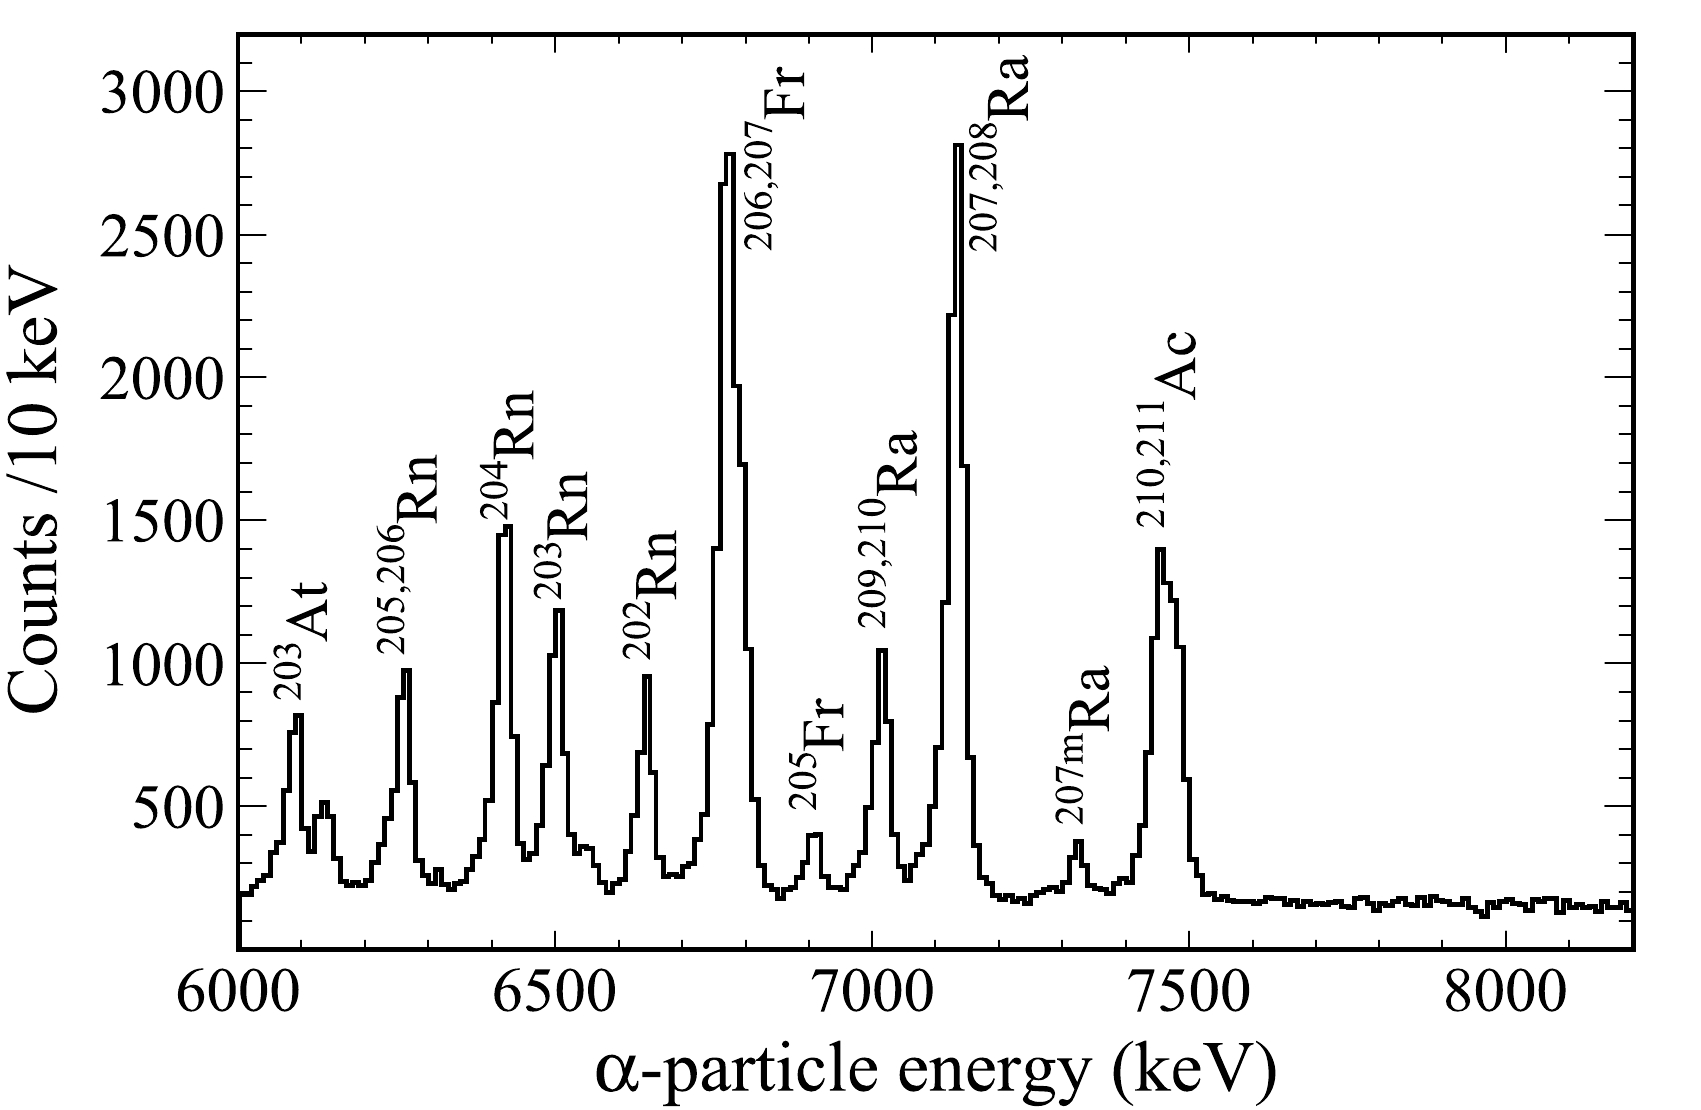
Figure 1. Energy spectrum of all particles measured in the DSSD and vetoed with the MWPCs and veto detectors in the
$ ^{55} $ Mn +$ ^{159} $ Tb reaction at 257 MeV.A two-dimensional scatter plot for the correlation between the parent and daughter α-particle energies is shown in Fig. 2. The searching time windows were 0.19 s for the ER - α
$ _{1} $ pair and 6 s for the α$ _{1} $ - α$ _{2} $ pair. The α-decay correlations originating from the Th, Ac, and Ra isotopes were clearly identified based on their known decay properties. In the parent α-particle energy range of 7.7 to 8.0 MeV, the isotopes$ ^{210,211} $ Th produced in the 4-5n evaporation channels were clearly identified. In the time windows of$ \triangle t$ (ER - α$ _{1} $ )$ \leq $ 80 ms and$ \triangle t$ (α$ _{1} $ - α$ _{2} $ )$ \leq $ 1.2 s, the α decays of$ ^{210} $ Th were screened out. In total, 38 decay chains were assigned to$ ^{210} $ Th, of which there were 19 ER - α$ _{1} $ - α$ _{2} $ correlated chains, seven chains with α$ _{2} $ escaping, and 12 chains with α$ _{1} $ escaping. The signals of the escaping α events under consideration were successfully detected by both the DSSD and SSDs. Figure 3 shows the distributions of α-particle energies and decay times of$ ^{210} $ Th and its daughter nucleus$ ^{206} $ Ra. The α-particle energy and half-life of$ ^{210} $ Th were determined to be 7922(14) keV and 14(4) ms, respectively, which are consistent with the values of$ E_{\alpha} $ = 7917(6) keV and$ T_{1/2} $ = 16.0(36) ms reported in a previous study [15]. The daughter nuclei with an α-particle energy of 7269(14) keV and a half-life of 0.23(4) s were identified. The properties are in accordance with data from Ref. [16]. It should be noted that the energies of the reconstructed events were not used in the determination of the α-decay energy of$ ^{210} $ Th owing to the poor energy resolution, whereas their lifetimes were used to determine the half-life.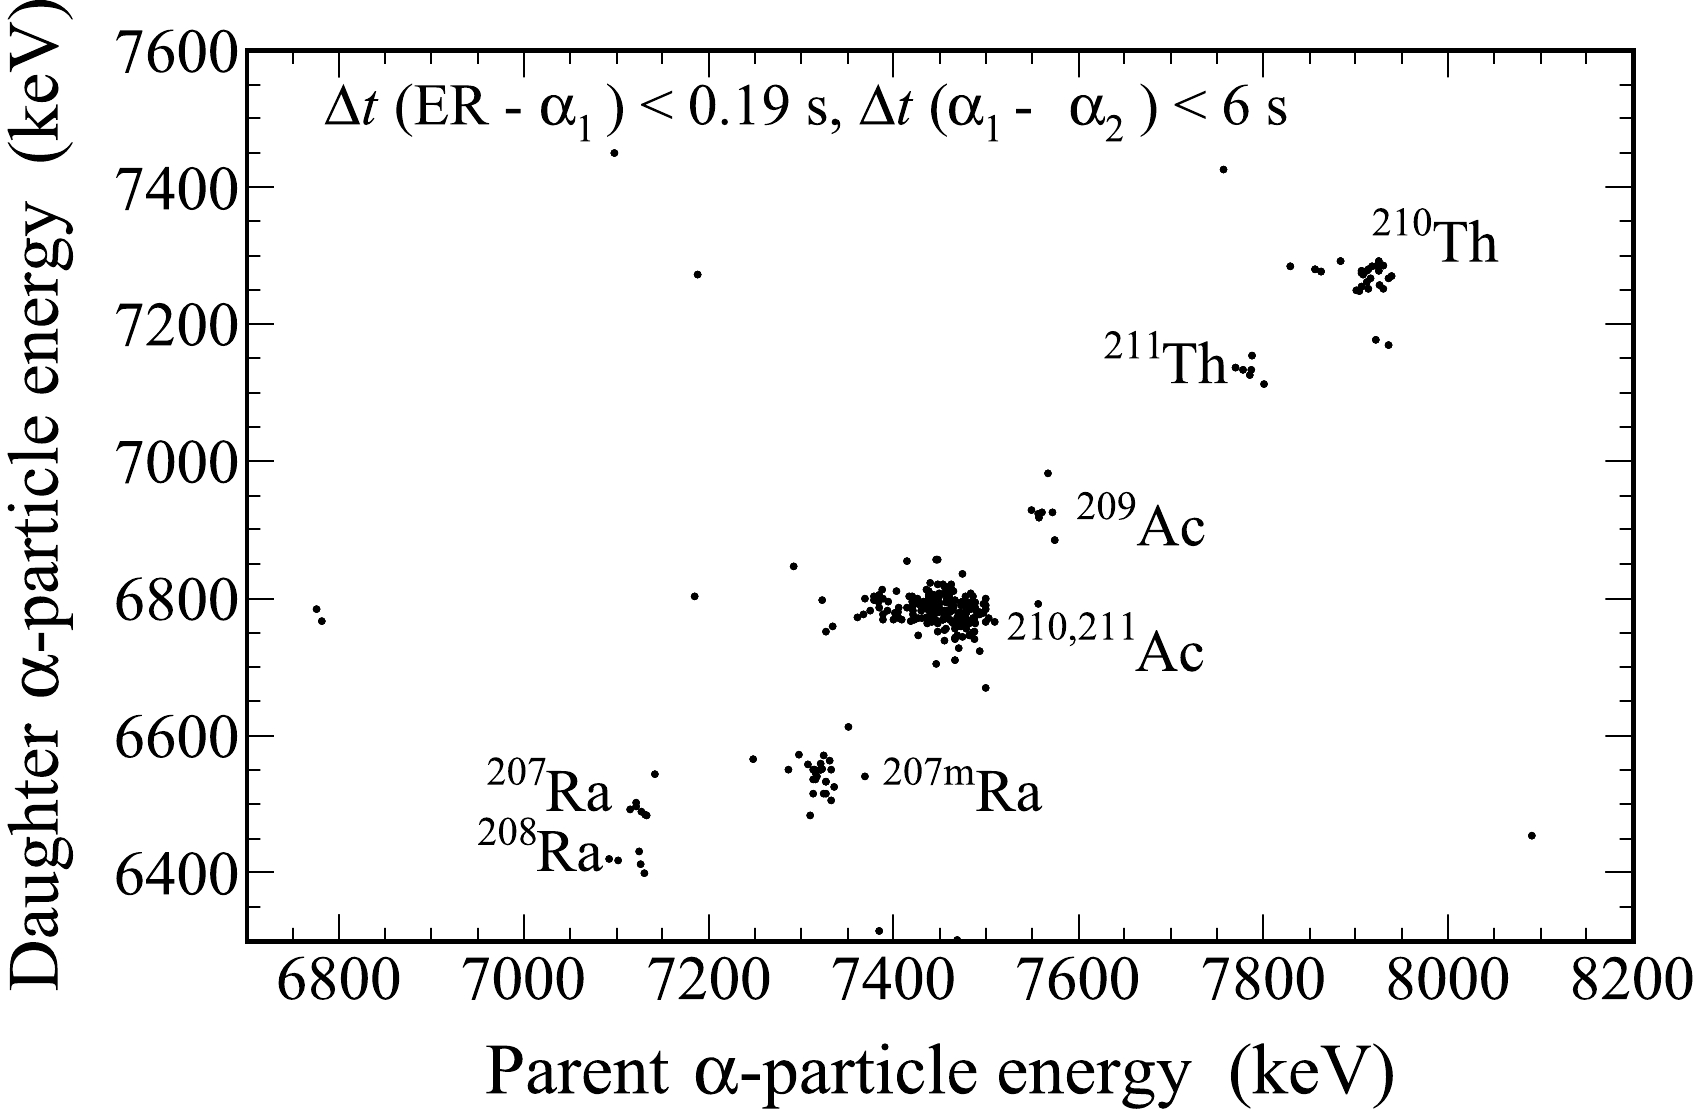
Figure 2. Two-dimensional scatter plot of the parent and daughter α-particle energies of the ER-α
$ _{1} $ -α$ _{2} $ type measured in the DSSD. The searching time windows were 0.19 s for the ER-α$ _{1} $ pair and 6 s for the α$ _{1} $ -α$ _{2} $ pair.
Figure 3. (color online) α-particle energies (left panel) and decay time distributions (right panel) for
$ ^{210} $ Th and its daughter nucleus$ ^{206} $ Ra measured in this study. The α-particle energy is derived by considering only the full-energy α particles. The half-lives in the right panel are determined using the method described in Ref. [14].With an incident energy of 257 MeV, a total of twelve decay chains, six of which were ER - α
$ _{1} $ - α$ _{2} $ , were assigned to the isotope$ ^{211} $ Th. The α-decay energy and half-life of the parent nuclide were 7788(14) keV and 36$ ^{+15}_{-8} $ ms, respectively, and the decay properties of the corresponding daughter nuclide were 7130(14) keV and 1.3$ ^{+0.5}_{-0.3} $ s, respectively. These data are consistent with the known decay properties of$ ^{211} $ Th [17] ($ E_{\alpha} $ = 7792(14) keV,$ T_{1/2} $ = 37$ ^{+28}_{-11} $ ms) and$ ^{207} $ Ra [16] ($ E_{\alpha} $ = 7133(5) keV,$ T_{1/2} $ = 1.3(2) s).The production cross sections of 0.59
$ ^{+0.25}_{-0.23} $ nb and 0.19$ ^{+0.12}_{-0.09} $ nb were determined for$ ^{210} $ Th and$ ^{211} $ Th, respectively. A transmission efficiency of 50% for the gas-filled recoil separator SHANS2 was used in the calculation. Figure 4 presents the calculation of the excitation function using the HIVAP code in comparison with the cross sections measured in this study, and the corresponding results are also listed in Table 1. The value of the scaling factor C$ _{f} $ for the fission barrier was determined by comparing the cross section generated by the$ ^{64} $ Ni +$ ^{150} $ Sm reaction [15]. It is shown that the HIVAP calculation fits well with the measured cross sections within a factor of three (except for$ ^{211} $ Th).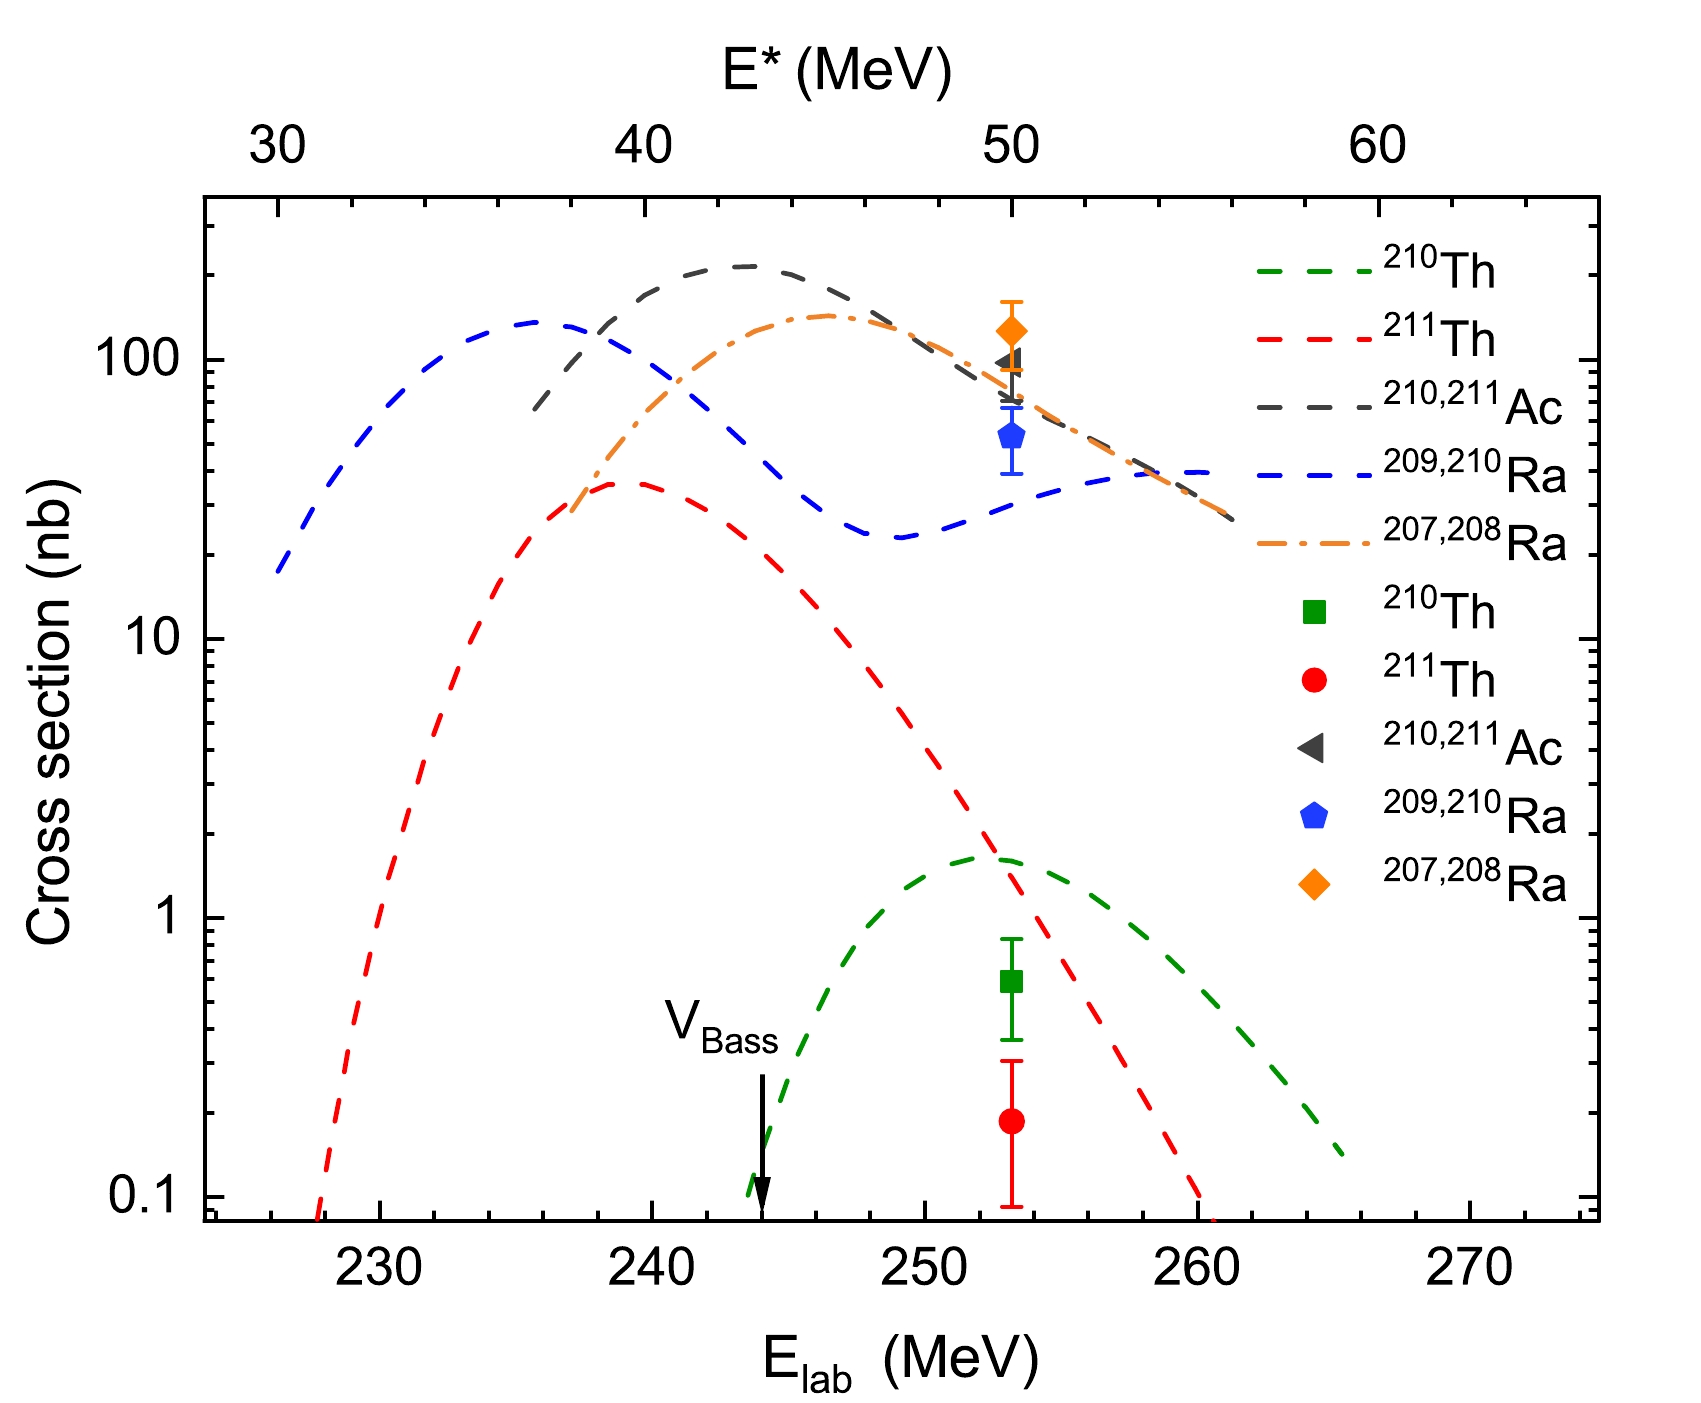
Figure 4. (color online) Excitation function of the evaporation channels of the
$ ^{55} $ Mn+$ ^{159} $ Tb reaction calculated with the HIVAP code, where the fission barrier scaling factor C$ _{f} $ = 0.66 was used. The cross sections of$ ^{210} $ Th (green square),$ ^{211} $ Th (red circle),$ ^{210,211} $ Ac (grey triangle),$ ^{209,210} $ Ra (blue pentagon), and$ ^{207,208} $ Ra (orange diamond) were measured in this study. ''$V_{\rm Bass}$ " (black arrow) in the figure signifies the Coulomb barrier given by the Bass potential [18] of the$ ^{55} $ Mn+$ ^{159} $ Tb reaction. In practice, it was calculated by the program LISE++ [19].Isotopes This study $\sigma_{\rm hivap}$ /nb

Literature data $ E_{\alpha} $ /keV

$ T_{1/2} $ 

σ/nb $ E_{\alpha} $ /keV

$ T_{1/2} $ 

Ref. $ ^{210,211} $ Ac

7463(14) 0.338(6) s 97(26) 71 7462(8), 7477(6) 0.35(5) s, 0.21(3) s [16] $ ^{207\rm m} $ Ra

7323(14) 59.0(35) ms — — 7323(8) 59(4) ms [16] $ ^{207,208} $ Ra

7132(14) 1.28(2) s 126(34) 77 7131(4), 7133(5) 1.2(1) s, 1.3(2) s [16] $ ^{209,210} $ Ra

7014(14) 2.74(6) s 53(14) 30 7006(3), 7016(4) 4.8(2) s, 3.7(2) s [16] $ ^{210} $ Th

7922(14) 14(4) ms 0.59 $ ^{+0.25}_{-0.23} $ 

1.5 7917(6) 16.0(36) ms [15] $ ^{211} $ Th

7788(14) 36 $ ^{+15}_{-8} $ ms

0.19 $ ^{+0.12}_{-0.09} $ 

1.3 7792(14) 37 $ ^{+28}_{-11} $ ms

[17] Table 1. α-decay properties of the Ac, Ra, and Th isotopes produced in the
$ ^{55} $ Mn +$ ^{159} $ Tb reaction. The second and third columns are the α-particle energies and half-lives of these isotopes measured in this study. The fourth column shows the reaction cross sections for the corresponding isotopes. The fifth column ($\sigma_{\rm hivap}$ ) shows the cross sections calculated by the HIVAP code. The corresponding literature values are shown in columns six and seven.The fusion evaporation products that recoiled from the target had a wide distribution of the charge state. In the separator filled with dilute gas, ERs and gas molecules continuously collide while exchanging charges, and then the charge state of the ERs fluctuates around an equilibrium value. Calculating the equilibrium charge state of the ions is crucial when determining the optimum magnetic rigidity for the products of interest. Therefore, it is essential for the study of superheavy elements with low reaction cross sections. In the experiment, to obtain the equilibrium charge state of the ERs, the actual magnetic rigidity of the ERs was first determined. Figure 5(a) shows the position distribution of
$ ^{210} $ Th in the DSSD with helium gas at 80 Pa, where the horizontal shift in the center of the position distribution toward the center of the DSSD was –25 mm. The minus sign indicates the inner radius side of the DSSD, with its center as the origin. Based on Ref. [11], the actual momentum dispersion of SHANS2 was determined as 21.1 mm. Therefore, the actual magnetic rigidity was determined as 1.569 T$ \cdot $ m, based on Ref. [20]. Figures 5(b) and 5(c) show the energy distribution of$ ^{210} $ Th and that calculated under the same conditions, respectively. The calculated energy distribution was obtained using the method described in Ref. [21], which considers multiple scattering and energy loss. According to Figs. 5(b) and 5(c), the simulation is in good agreement with the experimental results. This fact allows for the use of the simulation program to calculate the velocity distribution of ERs at the center of the first dipole magnet$ D_{1} $ . With the above efforts, the equilibrium charge state of$ ^{210} $ Th was determined as 10.45 e, which was corrected by a sinusoidal term taken from Ref. [21]. The corrected results are plotted as a function of ($ v/v_{0})Z^{1/3} $ in Fig. 6. The data for the isotopes of Fr, Ac, and Th in the figure are taken from literature [11].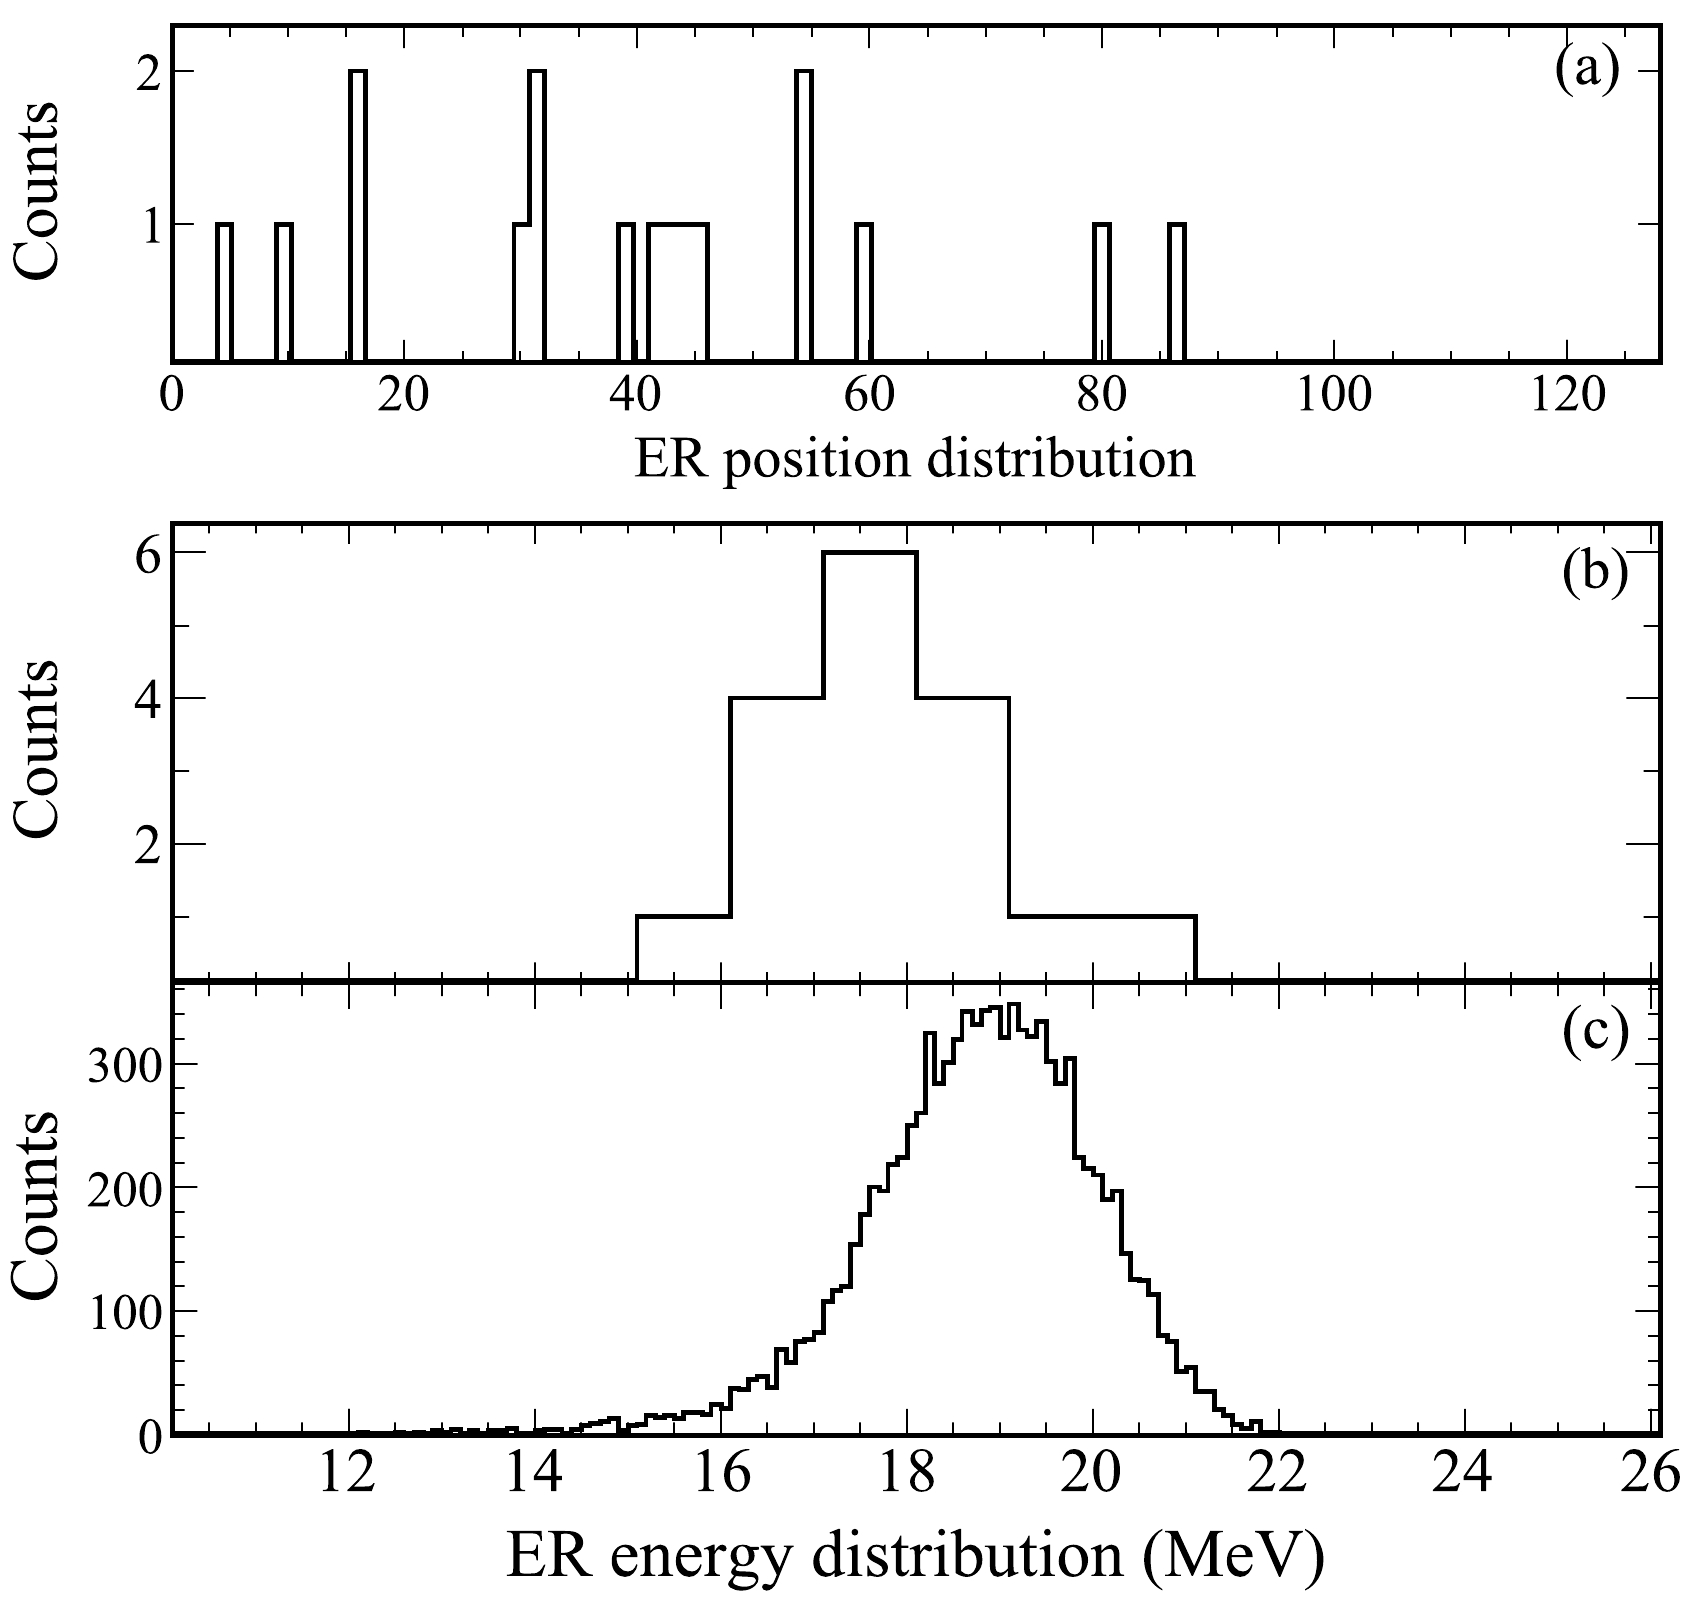
Figure 5. Position (a) and energy (b) distribution of
$ ^{210} $ Th detected by the DSSD in the experiment, and the calculated energy distribution (c) in the DSSD obtained from the simulation.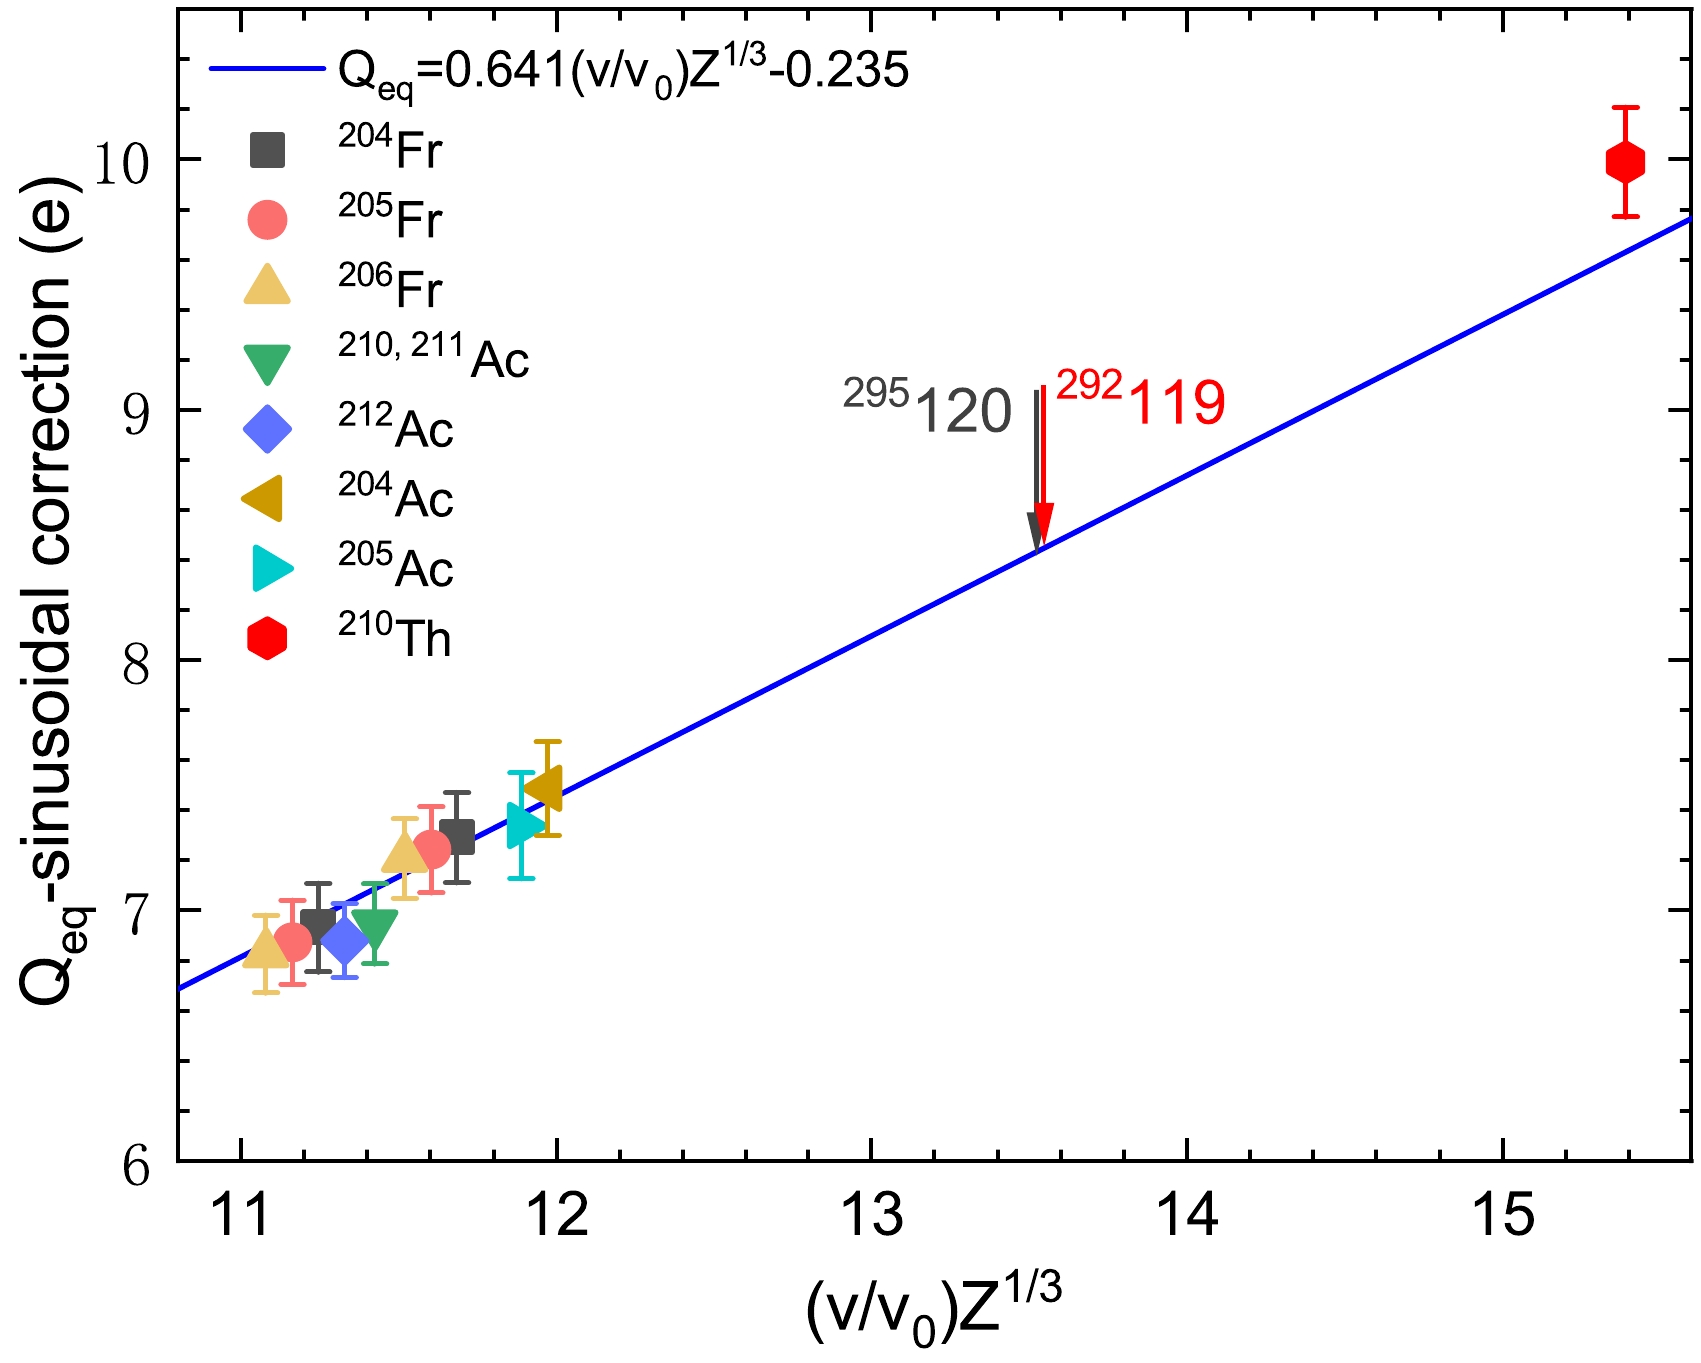
Figure 6. (color online) corrected equilibrium charge states plotted as a function of (
$ v/v_{0})Z^{1/3} $ , including the corrected one of$ ^{210} $ Th (red hexagon) and the estimated ($ v/v_{0})Z^{1/3} $ of the elements 119 (red arrow) and 120 (black arrow). The other data are taken from Ref. [11], and the blue line represents the calculation based on the empirical formula from Ref. [21].The estimated (
$ v/v_{0})Z^{1/3} $ values of the elements 119 and 120 produced in the 3n channel of the$ ^{55} $ Mn +$ ^{240} $ Pu [22] and$ ^{55} $ Mn +$ ^{243} $ Am [23] reactions, respectively, are also plotted in Fig. 6. In the calculation, the maximum of the excitation function was determined according to Refs. [22, 23]. With the corresponding incident energy of projectiles, the energy distributions of the$ ^{292} $ 119 and$ ^{295} $ 120 nuclei at the center of D$ _{1} $ were obtained through the simulation, leading to the determination of the ($ v/v_{0})Z^{1/3} $ values for the two nuclei. These values ($Q_{\rm eq}$ -sinusoidal correction) could be estimated from the blue line in Fig. 6. The related parameters for calculating the equilibrium charge state of elements 119 and 120 are presented in Table 2. Owing to the lack of experimental data on ($ v/v_{0})Z^{1/3} $ of 13 to 14, there was an uncertainty in the value of the equilibrium charge states. Therefore, relevant studies must be conducted in the future.Reaction (channel) $ E^{*} $ /MeV

$E_{\rm lab}$ /MeV

$E_{\rm ER}$ /MeV

( $ v/v_{0})Z^{1/3} $ 

$Q_{\rm eq}$ /e

$ ^{55} $ Mn +

$ ^{240} $ Pu (3n)

38 327.4 54.9 13.52 8.43 $ ^{55} $ Mn +

$ ^{243} $ Am (3n)

41 332.2 55.1 13.51 8.42 Table 2. Calculated equilibrium charge states of the elements 119 and 120, along with other related parameters.
-
In summary, we report on the α-decay properties of the
$ ^{210} $ Th and$ ^{211} $ Th isotopes produced in the$ ^{55} $ Mn +$ ^{159} $ Tb reaction on the separator SHANS2. The α-particle energies of$ ^{210} $ Th and$ ^{211} $ Th were 7922(14) keV and 7788(14) keV, respectively, the corresponding half-lives of which were 14(4) ms and 36$ ^{+15}_{-8} $ ms. Calculations of the equilibrium charge state of$ ^{210} $ Th were carried out to supplement the systematics of the equilibrium charge states measured on SHANS2. The equilibrium charge states for the elements 119 and 120 produced in the$ ^{55} $ Mn +$ ^{240} $ Pu and$ ^{55} $ Mn +$ ^{243} $ Am reactions were estimated. -
The authors would like to express their thanks to the accelerator crew and the ion source group of CAFE2 for providing the stable 55Mn beams.
Reaction 55Mn + 159Tb : preparation for the synthesis of new elements
- Received Date: 2022-12-02
- Available Online: 2023-05-15
Abstract: The complete fusion reaction of


 Abstract
 HTML
HTML Reference
 Related
 PDF
PDF


 DownLoad: