


 Abstract
 HTML
HTML Reference
 Related
 PDF
PDF


-
The description of the nuclear fission process is crucial for understanding nuclear energy production, nuclear waste disposal, and nuclear applications as well as for basic sciences such as synthesis of super-heavy elements [1, 2], r-process nucleon synthesis in the universe [3-5], and production of short-lived exotic nuclides at experimental facilities [6, 7]. Although the discovery of fission occurred more than 80 years, a description of fission microscopically from the quantum many-body method is still a challenge.
Many different theoretical approaches have been applied to study fission phenomena. Some calculations are based on the microscopic theory, such as the time-dependent generator coordinate method (TDGCM) [8-14], and on the time-dependent density functional theory (DFT) [15-18]. There are also many approaches based on a phenomenological method, e.g., the macroscopic-microscopic (MM) + Langevin approach [19], MM + Brownian motion [20], and MM + statistic model [21].
Most of the models for describing nuclear fission, especially for a theory within the adiabatic approximation, rely on the precise calculation of the potential energy surfaces (PESs) in the collective space. From the calculation of the PESs, it has been learned that the fission barrier heights, fission isomer excitation energies, and collective inertia are sensitive to the strength of the pairing force [22, 23]. Within the method of time-dependent superfluid local density approximation, it has been shown that fission can be highly accelerated by increasing the pairing force [15]. In Ref. [13], a TDGCM calculation based on the covariant DFT was carried out for the fission of 226Th, in which both symmetric and asymmetric fission modes co-exist. After the reduction in the pairing force, the asymmetric fission mode became more dominant, whereas the symmetric fission mode was dominant after the enhancement in the pairing force. In Ref. [23], the authors have also discussed the impact of paring correlations on the fission barrier and scission point for 240Pu with the Skyrme functionals. However, discussions on the detailed influence of the different pairing strengths on the calculation of the PESs and related fission properties were lacking. Therefore, here we provide a comprehensive analysis of the static aspects of the fission process of 240Pu in a self-consistent framework of nuclear energy DFT with the Skyrme energy densities and with variation in the pairing strength.
This article is organized in the following way. The theoretical framework is briefly outlined in Section II. The calculated results and discussions are presented in Section III. The summary and conclusions are drawn in Section IV.
-
Nuclear energy DFT is widely used for studies on low-energy nuclear physics and nuclear astrophysics [24-26]. The Skyrme DFT is adopted in the current work. We briefly describe its formulations here, the details of which can be found from Ref. [24].
In the local density approximation of the DFT, the total energy of finite nuclei can be calculated through the space integral of the Hamiltonian density,
$ {\cal{H}} (r) $ , which consists of the kinetic energy, τ, potential energy,$ \chi_{t} $ , and pairing energy,$ \tilde{\chi}_{t} $ , densities:$ {\cal{H}}[\rho,\kappa] = \frac{\hbar^{2}}{2m}\tau(r) +\sum\limits_{t = 0,1}\chi_{t}(r) +\sum\limits_{t = 0,1}\tilde{\chi}_{t}(r). $

(1) In the above equation, ρ is the particle density, κ is the pairing tensor,
$ \tau(r) $ is the density of the kinetic energy, and symbol$ t = 0,1 $ indicates the isoscalar or isovector [27].The mean-field potential energy in the Skyrme DFT usually has the form,
$\begin{aligned}[b] \chi_{t}({\boldsymbol{r}}) =& C_{t}^{\rho\rho}\rho_{t}^{2}+C_{t}^{\rho\tau}\rho_{t}\tau_{t}+C_{t}^{J^{2}}\mathbb{J}_{t}^{2}\\ &+C_{t}^{\rho\Delta\rho}\rho_{t}\Delta\rho_{t}+C_{t}^{\rho\nabla J}\rho_{t}\nabla\cdot{\boldsymbol{J}}_{t}, \end{aligned} $

(2) where
$ \rho_{t} $ ,$ \tau_{t} $ , and$ {\boldsymbol{J}}_{t}(t = 0,1) $ can be obtained from the density matrix,$ \rho_{t}({\boldsymbol{r}}\sigma,{\boldsymbol{r}}'\sigma') $ . In the above formula, most coupling constants are real numbers. As an exception,$ C_{t}^{\rho\rho} = C_{t0}^{\rho\rho}+C_{tD}^{\rho\rho}\rho_{0}^{\gamma} $ , which is the traditional density-dependence term.In the DFT, the pairing correlation is usually incorporated by the Hartree-Fock-Bogoliubov (HFB) method [24]. The density-dependent surface-volume pairing force is often used, as given in Ref. [28]:
$ V(r_{1},r_{2}) = V_{0}\left[1-\frac{1}{2}\frac{\rho}{\rho_{0}}\right]\delta(r_{1}-r_{2})\; , $

(3) where
$ V_{0} $ is the pairing strength for the neutrons or protons, the total density is ρ, and$ \rho_0 $ is the saturation density of nuclear matter fixed at 0.16 fm-3.In the current work, to obtain the PESs, the calculations were carried out by solving the HFB equation under constraints on the expectation values of the axial quadruple,
$ \hat{Q}_{20} $ , and octuple,$ \hat{Q}_{30} $ , moments in the variational principle. The quadruple degree of freedom is used to describe the elongation of the nucleus, and the octuple degree of freedom is introduced to account for the range of mass divisions observed in the fragments, from symmetric to asymmetric. In addition, the HFB procedure requires constraints on the expected values of the proton number ($ \hat{Z} $ ) and neutron number ($ \hat{N} $ ) operators, namely,$ \begin{aligned}[b] & \langle \Phi(\{q_{l0}\})|\hat{Q}_{l0}|\Phi(\{q_{l0}\})\rangle = q_{l0},\\ & \langle \Phi(\{q_{l0}\})|\hat{N}|\Phi(\{q_{l0}\})\rangle = N,\\ & \langle \Phi(\{q_{l0}\})|\hat{Z}|\Phi(\{q_{l0}\})\rangle = Z. \end{aligned} $

(4) $ \hat{Q}_{l0} $ is a multipole operator, which includes$ \hat{Q}_{10} $ ,$ \hat{Q}_{20} $ , and$ \hat{Q}_{30} $ .$ \hat{q}_{l0} $ stands for the expectation value of the multiple moment.$ \hat{q}_{10} $ is the dipole moment, which is constrained to be zero so that the center of the mass of the nucleus stays at the original point in the coordinate system. The HFB energies of the deformed nuclear system are defined as:$ E_{ \rm{HFB}}(q_{20},q_{30}) = \langle \Phi\big(q_{20},q_{30}\big)\big|\hat{H}\big|\Phi\big(q_{20},q_{30}\big) \rangle, $

(5) where
$ \hat{H} $ is the nuclear microscopic Hamiltonian built with nucleon-nucleon effective interaction and$ E_{ \rm{HFB}} $ denotes the potential energies discussed in this work. -
In this work, all calculations were performed with the DFT solver, HFBTHO(v3.00) [29]. We adopted the SkM* [30] parametrization of the Skyrme DFT as the mean-field potential, which is a popular choice for nuclear fission studies. A total of 31 major harmonic oscillator shells were used as the basis. The usual pairing window of 60 MeV cutoff was adopted. The paring strengths for the neutrons and the protons were adjusted as
$ V_{0}^{(n)} $ = −265.25 MeV and$ V_{0}^{(p)} $ = −340.06 MeV to produce a three-point odd-even mass difference in 240Pu, respectively [23]. To study the sensitivity of the pairing correlations, we varied the pairing strength by$ \pm $ 10%, i.e., ($ V_{0}^{(n)} $ ,$ V_{0}^{(p)} $ ) = (−238.73, −306.05), and (−291.78, −374.07) MeV, which correspond to 90%, and 110% of the original pairing strength. -
For a microscopic study on nuclear fission, precise calculation of multidimensional PESs is usually required. It provides the essential profiles for dynamic calculations. The most important of these collective degrees of freedom are related to the nuclear shape. We choose the quadruple moment ,
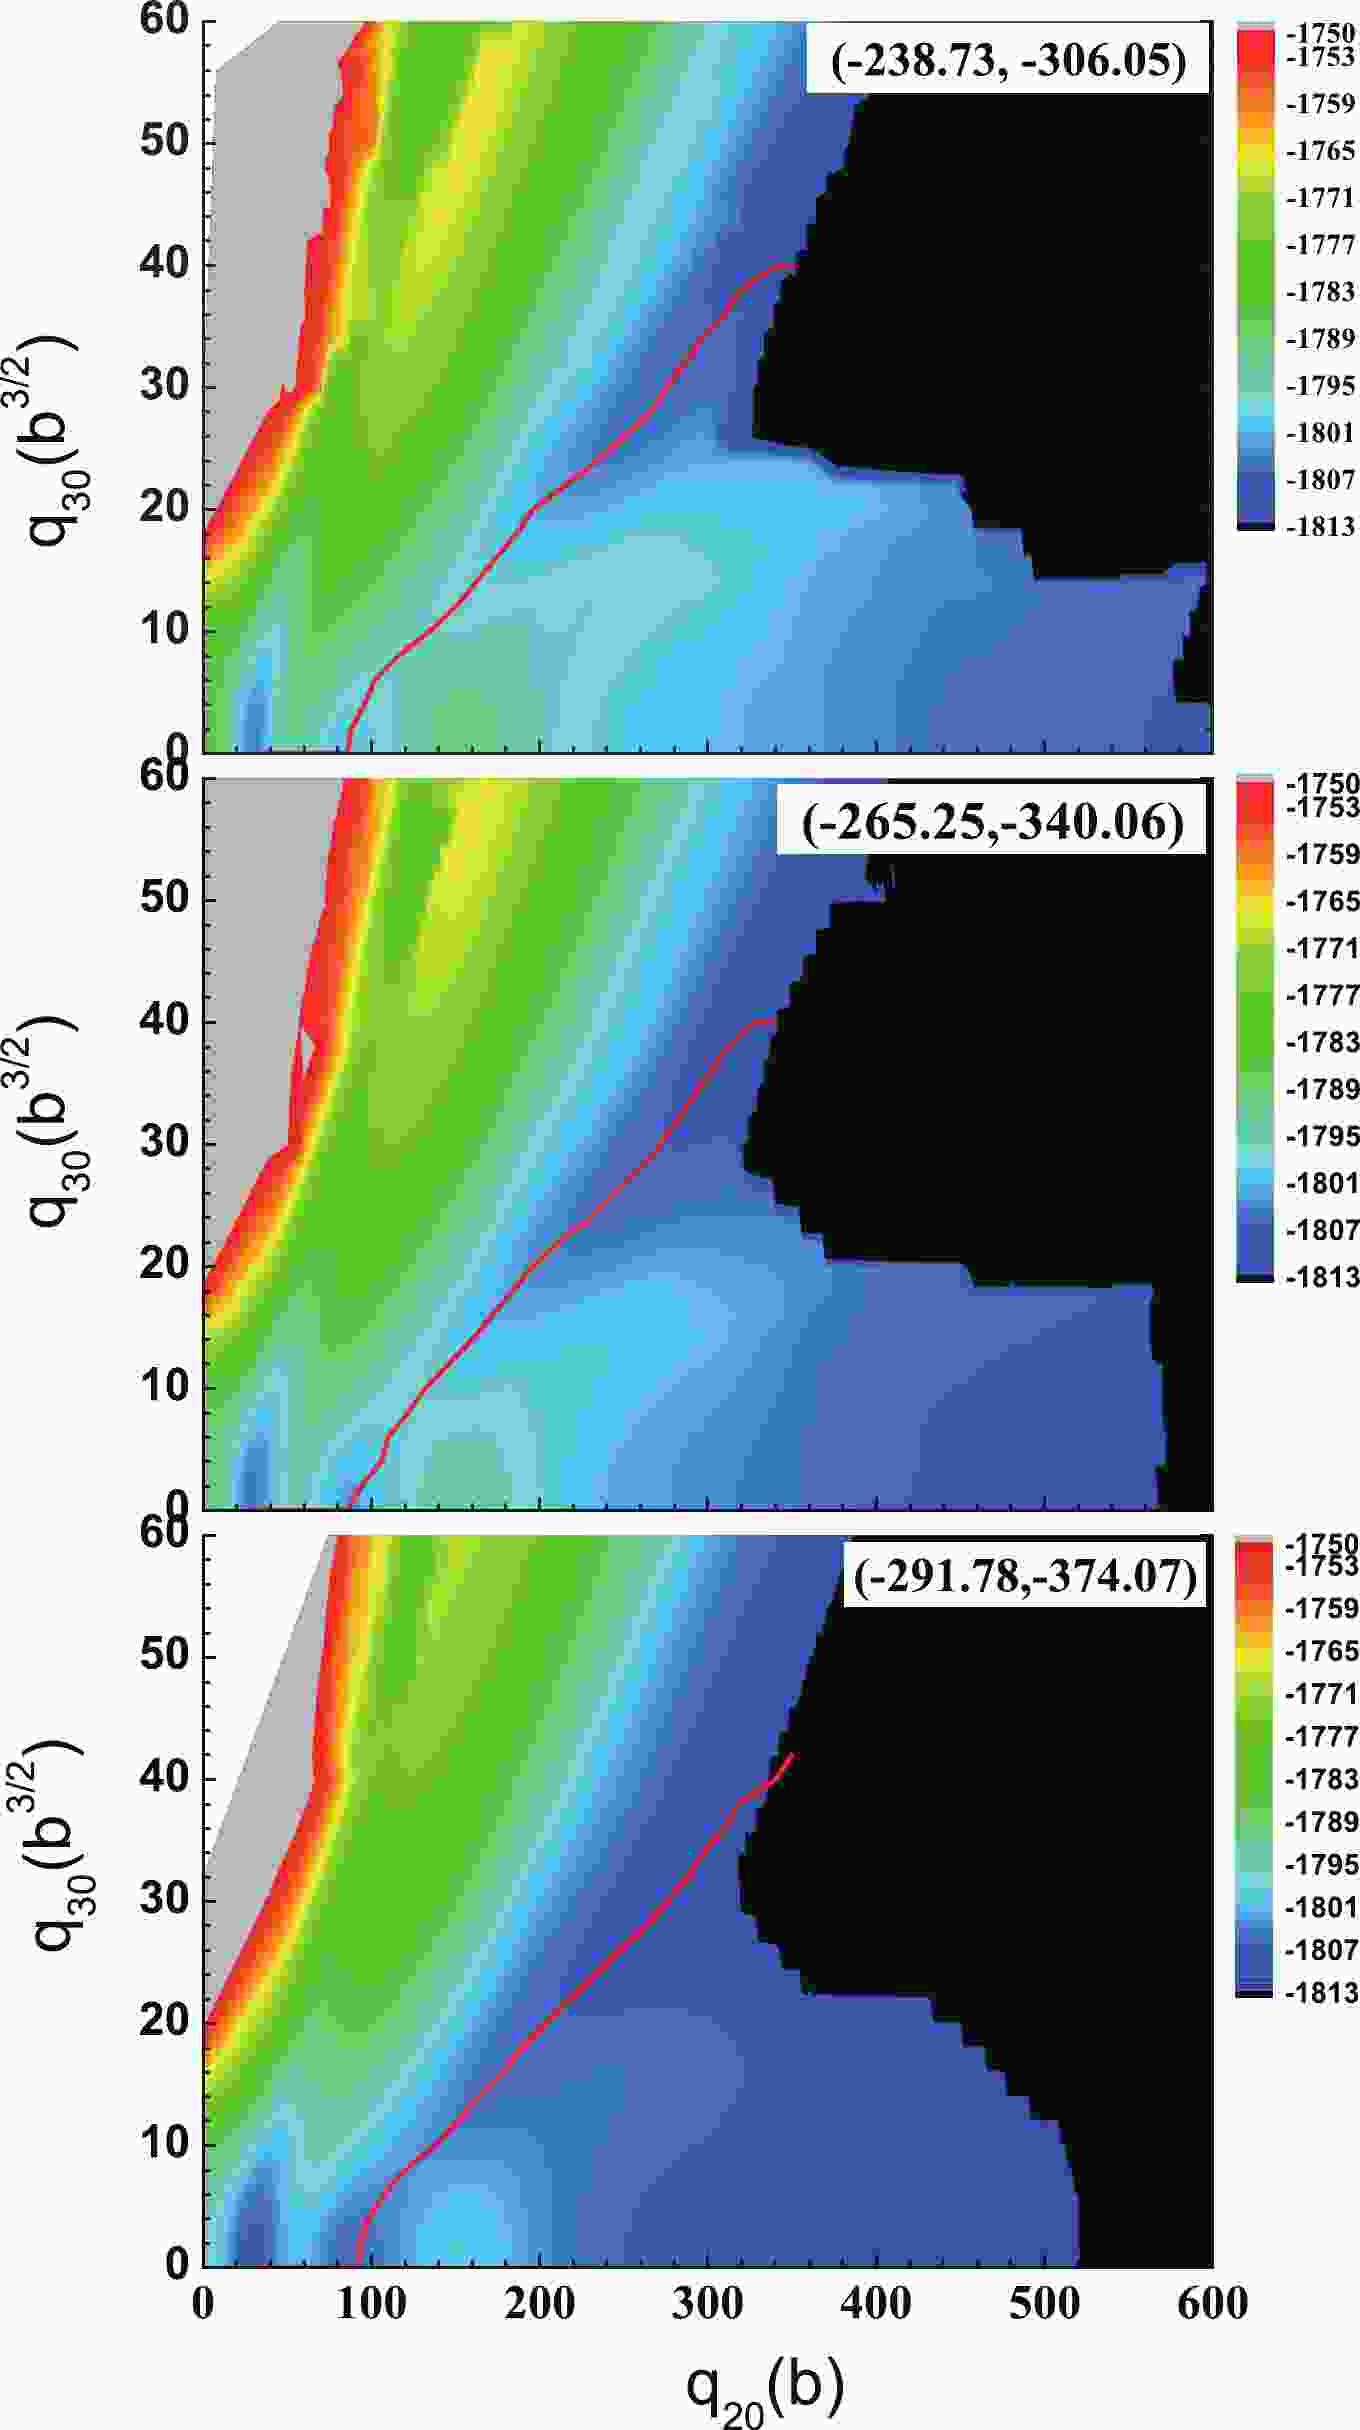
$ q_{20} $ , and the octuple moment,$ q_{30} $ , as the collective parameters. The axial symmetry is always assumed. The quadruple degree of freedom is used to describe the elongation of the nucleus, and the octuple degree of freedom is introduced to account for the asymmetric fission mode observed in experiments. Figure 1 displays the PESs of 240Pu calculated by the HFB method with three different pairing strengths. The isolines are separated by 1 MeV. The chosen mesh sizes are$ \Delta q_{20} = 2\;{\rm b} $ and$ \Delta q_{30} = 2\; {\rm b} $ 3/2, and thus, each PES landscape shown in Fig. 1 is generated with approximately 9000 constrained calculations.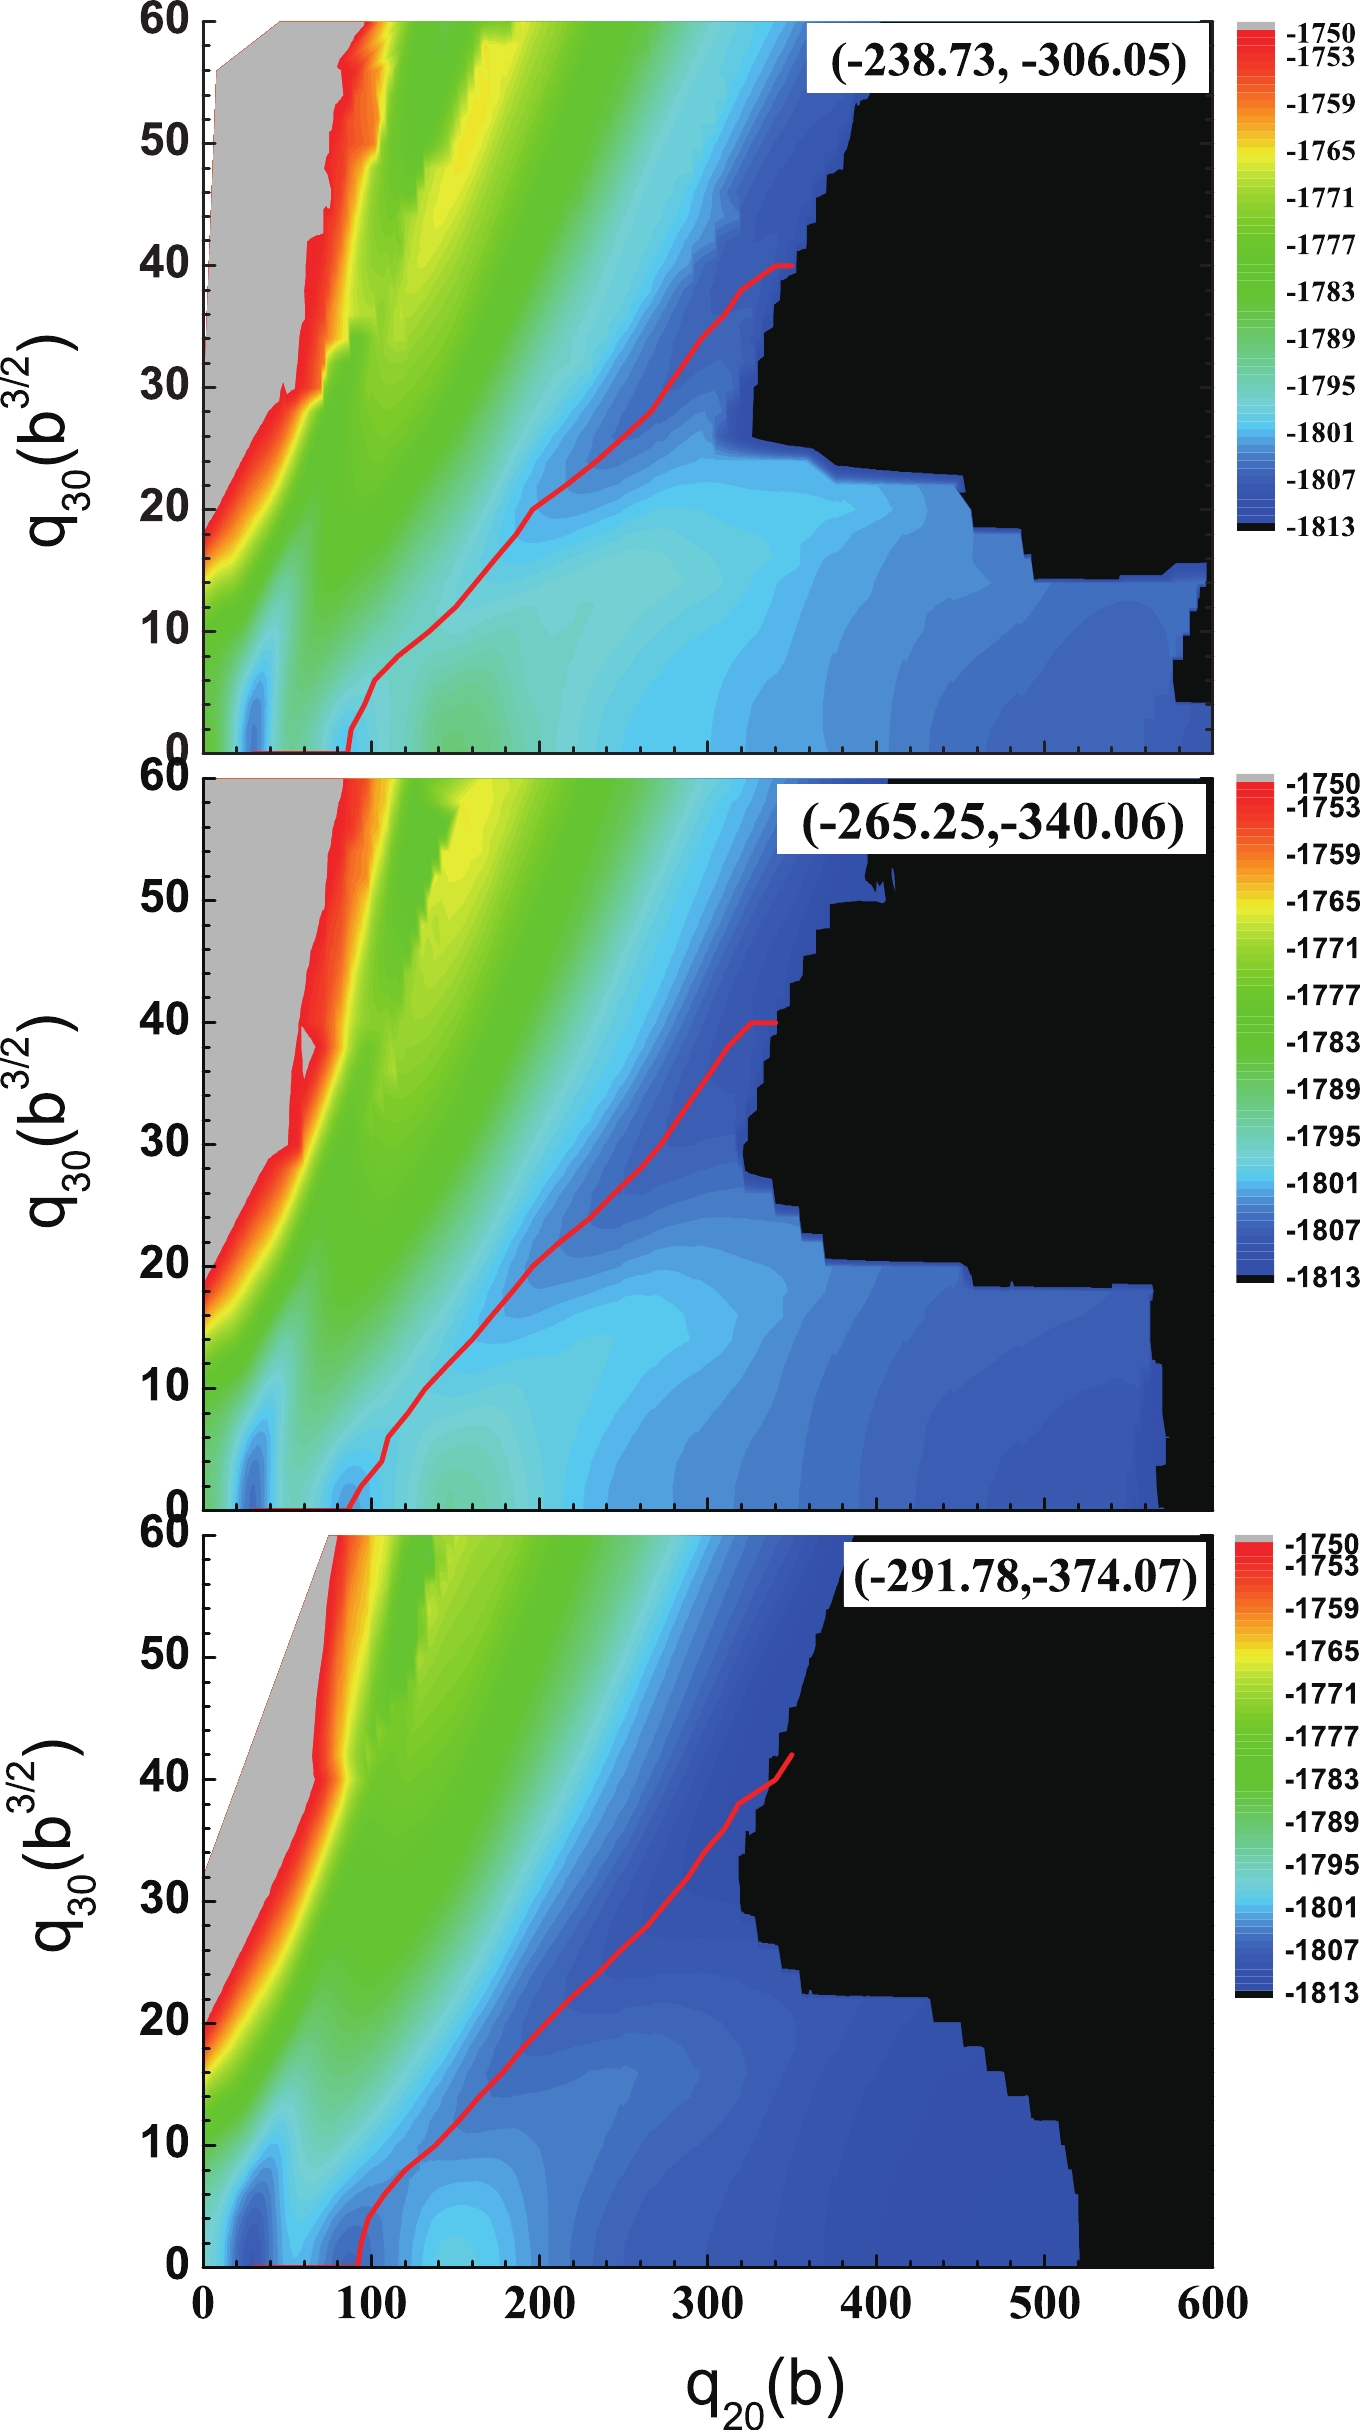
Figure 1. (color online) The PES of 240Pu in the (
$q_{20}$ ,$q_{30}$ ) plane calculated with the SkM*-DFT and the three different pairing strengths in the HFB approximation. The pairing strength is listed in the corresponding panel, as ($V_n$ ,$V_p$ ), in units of MeV. The least-energy fission pathway is given as a solid red curve.We first notice that there is no notable difference in the general topological properties with the 10% variation of the pairing strength. All lowest minima are located at (
$ q_{20} $ ,$ q_{30} $ ) = (30 b, 0 b3/2), an isomeric minimum appears for$ q_{20} = 86 $ b,$ q_{30} = 0 $ b3/2, a double-humped fission barrier is predicted, and the least-energy fission pathway is an asymmetric fission (red lines in Fig. 1). At elongations$ q_{20}> $ 150 b, a symmetric valley is observed, and it extends up to the scission point, about$ q_{20}\sim $ 550 b for the original pairing strength (the middle panel of Fig. 1). One notices that the symmetric and asymmetric fission valleys are entirely separated by a ridge from ($ q_{20} $ ,$ q_{30} $ ) = (150 b, 0 b3/2) to (340 b, 20 b3/2), and its height decreases gradually as the paring strength increases.To see the effect of the pairing correlations on the PESs more clearly, we plot the energies of the symmetric fission pathway and the asymmetric fission pathway as functions of the quadruple moment,
$ q_{20} $ , in Figs. 2(a) and (b), respectively. The energy of the ridge separating these two valleys is also shown in Fig. 2(c). As shown in Fig. 2, reduction in the pairing force leads to higher fission barriers, making the nuclear system more difficult to fission. The energies of the isomeric state and the ridge are also increased. The enhancement in the pairing is expected to reduce the fission barriers. A similar effect of varying the paring force on the fission barrier was also found in Refs. [22, 23]. The detailed values of the energies and deformations of the ground and isomeric states and the fission barriers for three different pairing strengths are listed in Table 1. From the results using the original pairing force, i.e. the rows labeled by 100%, it is seen that the energies of the isomeric state and the outer barrier are close to the experimental data. Thus, it proves the validity of the SkM*-DFT parametrization used in the current work. However, the inner barrier is extremely high compared to the experimental value, which is due to the absence of the triaxial degree of freedom in our calculations. As discussed in Refs. [23, 34, 35], the triaxial degree of freedom has a critical impact on the inner barrier, which is lowered by$ \approx 2 $ MeV and is close to the empirical value. The well reproduction of the height of the outer barrier is mostly caused by the octuple correlations [23, 35], which is already included in the current calculations. As pointed out by Refs. [23, 35], the outer barrier can also be lowered by the triaxial degree of freedom. From the table, it is also learned that the deformations of these states, i.e., the ground state, isomeric state, and inner and outer barriers, are in general not influenced by the variation in the pairing force.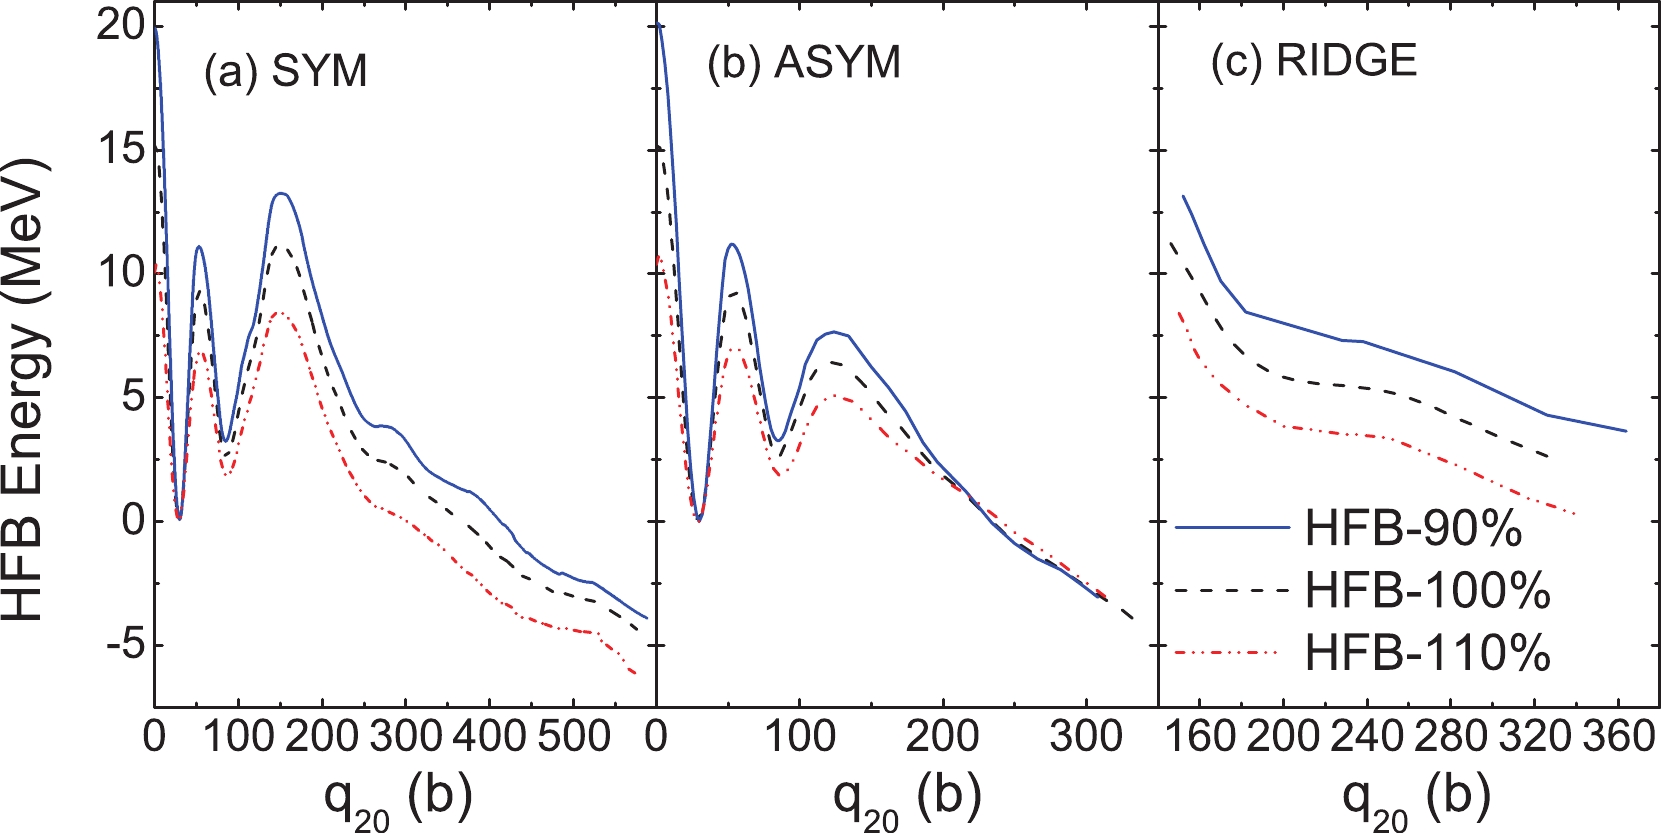
Figure 2. (color online) The energies along the symmetric and asymmetric fission pathways in 240Pu by different sets of the pairing strength are shown in Panels (a) and (b), respectively. In Panel (c), the energy of the ridge between the symmetric and asymmetric fission valley is shown. All these energies are relative to their ground-state value.
Ground state Isomeric state Inner barrier Outer barrier Energy/MeV Exp −1813.45 [31] 2.8 [32] 6.05* [33] 5.15* [33] 90% −1804.27 3.26 11.18 7.66 100% −1805.35 2.59 9.32 6.46 110% −1808.18 1.86 7.05 5.12 Deformation ( $q_{20}/{\rm{b} },q_{30}/{\rm{b} }^{3/2}$ )

90% (30,0) (86,0) (54,0) (126,10) 100% (30,0) (86,0) (54,0) (126,8) 110% (30,0) (86,0) (54,0) (126,8) Table 1. The energies of the ground state, isomeric state, and fission barriers. The energies are relative to the ground-state energies. The empirical values are listed with "*". The information of the qradrupole and octupole moments at relative states is also given. Labels 90%, 100%, and 110% indicate the ratio of the corresponding pairing strength to its original value.
-
The neutron and proton canonical single-particle energies (SPEs) at the inner and outer barriers are shown in Fig. 3. The results with different pairing strengths are shown. In general, the levels in the low-energy part of these canonical SPEs are quite sparse and the shell gaps are large, whereas those in the high-energy part become very dense, indicating a decrease in the shell effects with the increase in the SPEs. For the different pairing strengths, it is clearly seen that the single-particle levels around the Fermi surfaces become more dense with the increase in the pairing strength, making the gaps between the levels smaller. Thus, there is a competition effect between the pairing correlations and the shell effects.
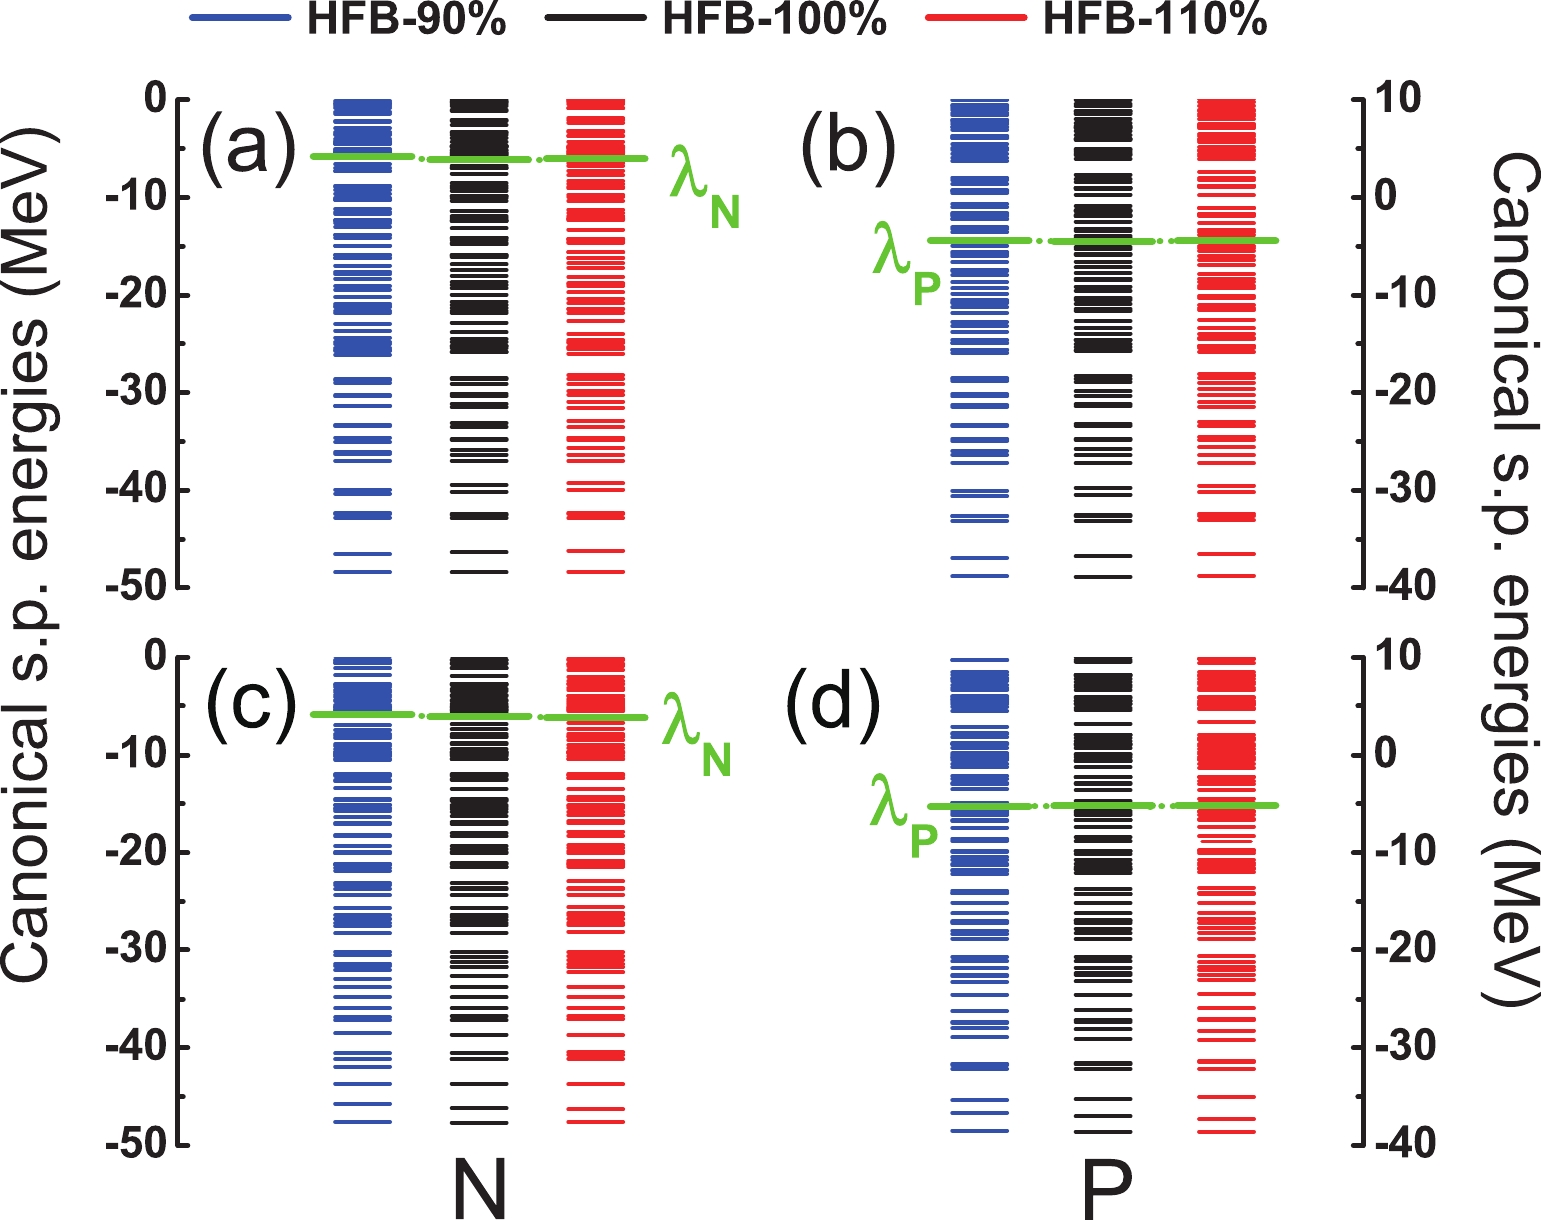
Figure 3. (color online) The canonical single-particle energies (SPEs). The left panels are for the neutron SPEs, and the right panels are for the proton SPEs. The upper panels are the results at the inner barrier, and the bottom panels are the results at the outer barrier. Labels HFB-90%, HFB-100%, and HFB-110% indicate 90%, 100%, and 110% of the original paring strength in the HFB approximation, respectively. The Fermi levels for the neutrons and the protons,
$\lambda_N$ and$\lambda_P$ , are also given in the plots. -
The pairing gaps along the least-energy fission pathway are shown in Fig. 4 for the different pairing strengths. In general, for a certain pairing force, the pairing gap at a certain deformation reduces when the level density around the Fermi surface is small and vice versa (This feature might be understood through the BCS formulation that the pairing gap
$ \Delta = G \sum_i v_i u_i $ [36]. The square of$ v_i $ ,$ u_i $ stand for the probability that the level i is occupied or not, and G is the pairing strength.$ v_i u_i $ is zero if the level is far below and above the Fermi surface). Overall, the pairing gaps decrease slightly as the deformation increases. Fluctuations that reflect the evolution of the shell structure are observed in the small-deformation region, whereas they become smooth in the large-deformation region. The pairing gaps are generally lowered if one reduces the pairing force. Especially, for the case of weak pairing forces, the gaps may become zero at some deformations.
Figure 4. (color online) The pairing gap along the least-energy fission pathway for the neutrons (top) and the protons (bottom) with the three different pairing strengths.
-
When describing fission in the (
$ q_{20} $ ,$ q_{30} $ ) collective space, a scission line is characterized by a discontinuity between the two domains of the pre- and post-scission configurations, before which the nucleus is whole and after which it is made of two fragments. Conventionally, one uses the Gaussian neck operator,$ \hat{Q}_N = {\rm e}^{-(({z-z_N})/{a_N})^2} $ [37], to evaluate the particle number in the so-called "neck" region. The position of the neck,$ z_N $ , is defined as the point with the lowest density between the two fragments, and$ a_N = 1 $ fm.The scission lines in the (
$ q_{20} $ ,$ q_{30} $ ) plane derived by different estimated values of$ \langle\hat{Q}_N\rangle $ are shown in Fig. 5. The results from the different paring strengths are displayed. For a certain pairing strength, the scission line is shifted toward a larger deformation, as expected, when using a smaller$ \langle\hat{Q}_N\rangle $ as the criterion. Here, we follow the recommendation of Ref. [9] to define a scission line by$ \langle\hat{Q}_N\rangle = 4 $ for 240Pu. Overall, the patterns of the scission lines for the three different pairing strengths are similar: large elongated ($ q_{20}>500 \;{\rm b}$ ) for symmetric fission, then jumping to the shortest elongation$ q_{20}\approx 320 \;{\rm b}$ as$ q_{30}\approx 30\;{\rm b} $ 3/2 , where the heavy fragment is close to 132Sn, and finally, turning to the upper-right direction till very large asymmetry. Specifically, the enhancement in the pairing correlations shrinks the pre-scission domain, especially for the symmetric and very asymmetric fission regions, and also make a scission line smoother.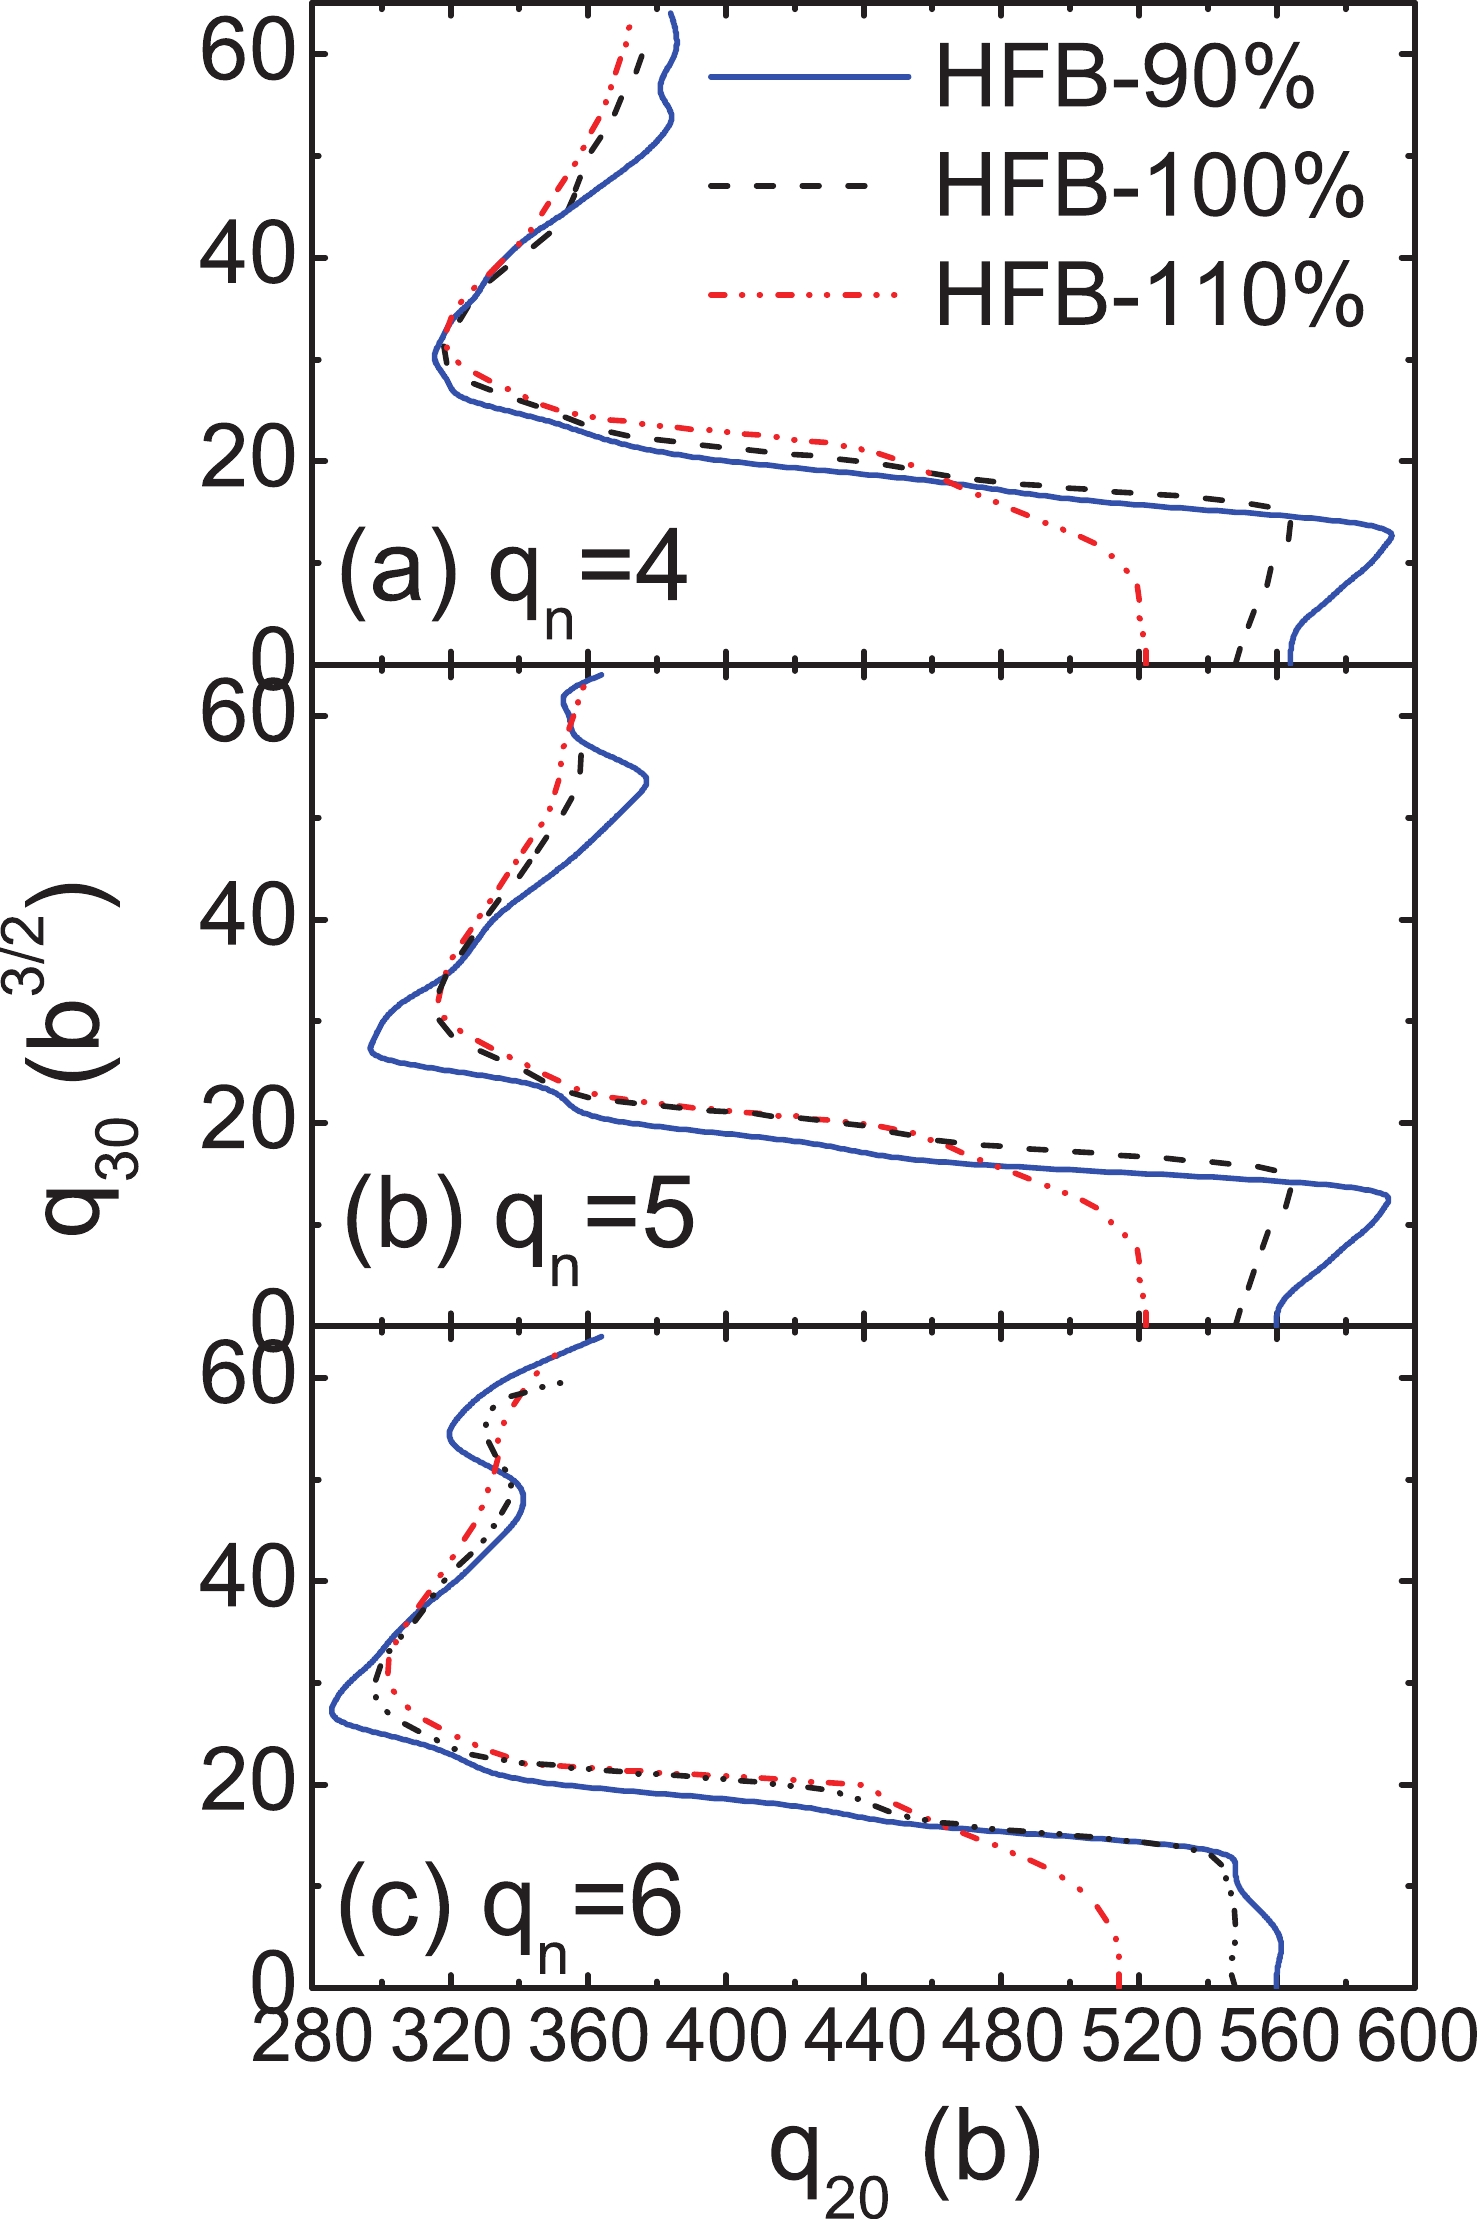
Figure 5. (color online) The scission lines for 240Pu in the (
$q_{20}$ ,$q_{30}$ ) plane, determined by the average particle number in the neck$q_n = \langle \hat Q_N\rangle = 4,\; 5,$ and 6 are given in Panels (a), (b), and (c), respectively. The blue, black, and red colored curves are for the 90%, 100%, and 110% of the original pairing strength.Figure 6 displays the energy,
$ E_{ \rm{HFB}} $ , and the quadruple and octuple moments along the scission lines defined by$ \langle\hat{Q}_N\rangle = 4 $ as functions of the fragment mass,$ A_{ \rm{frag}} $ . From Fig. 6(a) one can find the lowest energy at the asymmetric fission mode, and it becomes deeper and more asymmetric as the pairing strength increases. The corresponding masses of the heavy fragments are$ A_{ \rm{frag}}\simeq140 $ , 142, and 142 for the 90%, 100%, and 110% pairing strengths, respectively. They are quite close to the position of the peak in the experimental fragment mass distribution, i.e.,$ A\sim140 $ , in the low-energy fission of actinides [38-40]. In addition, a secondary minimum at$ A_{ \rm{frag}} = 120 $ is observed, which corresponds to the symmetric fission mode.
Figure 6. (color online) (a) The total energy,
$E_{ \rm{HFB}}$ , (b) quadruple moment, and (c) octuple moment along the scission lines of 240Pu as functions of the fragment mass,$A_{ \rm{frag}}$ , with the three different pairing strengths.As seen in Fig. 6(b), the quadruple moment for the symmetric fission mode (
$ A_{ \rm{frag}} $ = 120) is the largest, and it decreases as the pairing force is enhanced. For the asymmetric fission modes, the quadruple moments first decrease rapidly and then slightly increase at$ A_{\rm frag}\approx 150 $ . The octuple moments reflect the asymmetry of the nuclear shape, and thus, they increase monotonously for the asymmetric fission modes (see Fig. 6(c)). -
The total kinetic energy (TKE) for a specific pair of fragments can be evaluated as the mutual Coulomb interaction energy between the two fragments at the scission point,
$ E_{ \rm{TKE}} = \frac{e^2 Z_{\rm H} Z_{\rm L}} {d_{\rm{ch}}}\; , $

(6) where e denotes the proton charge,
$Z_{\rm H}$ and$Z_{\rm L}$ are the charge numbers of the heavy and light fragments, respectively, and$ d_ \rm{ch} $ is the distance between the centers of charge of the fragments at the scission point. The TKEs of the nascent fission fragments, as function of the fragment mass, at the scission frontier of 240Pu for the three different pairing strengths are shown in Fig. 7. The experimental data obtained in thermal neutron-induced 239Pu fission measurements [38-40] are also shown for comparison.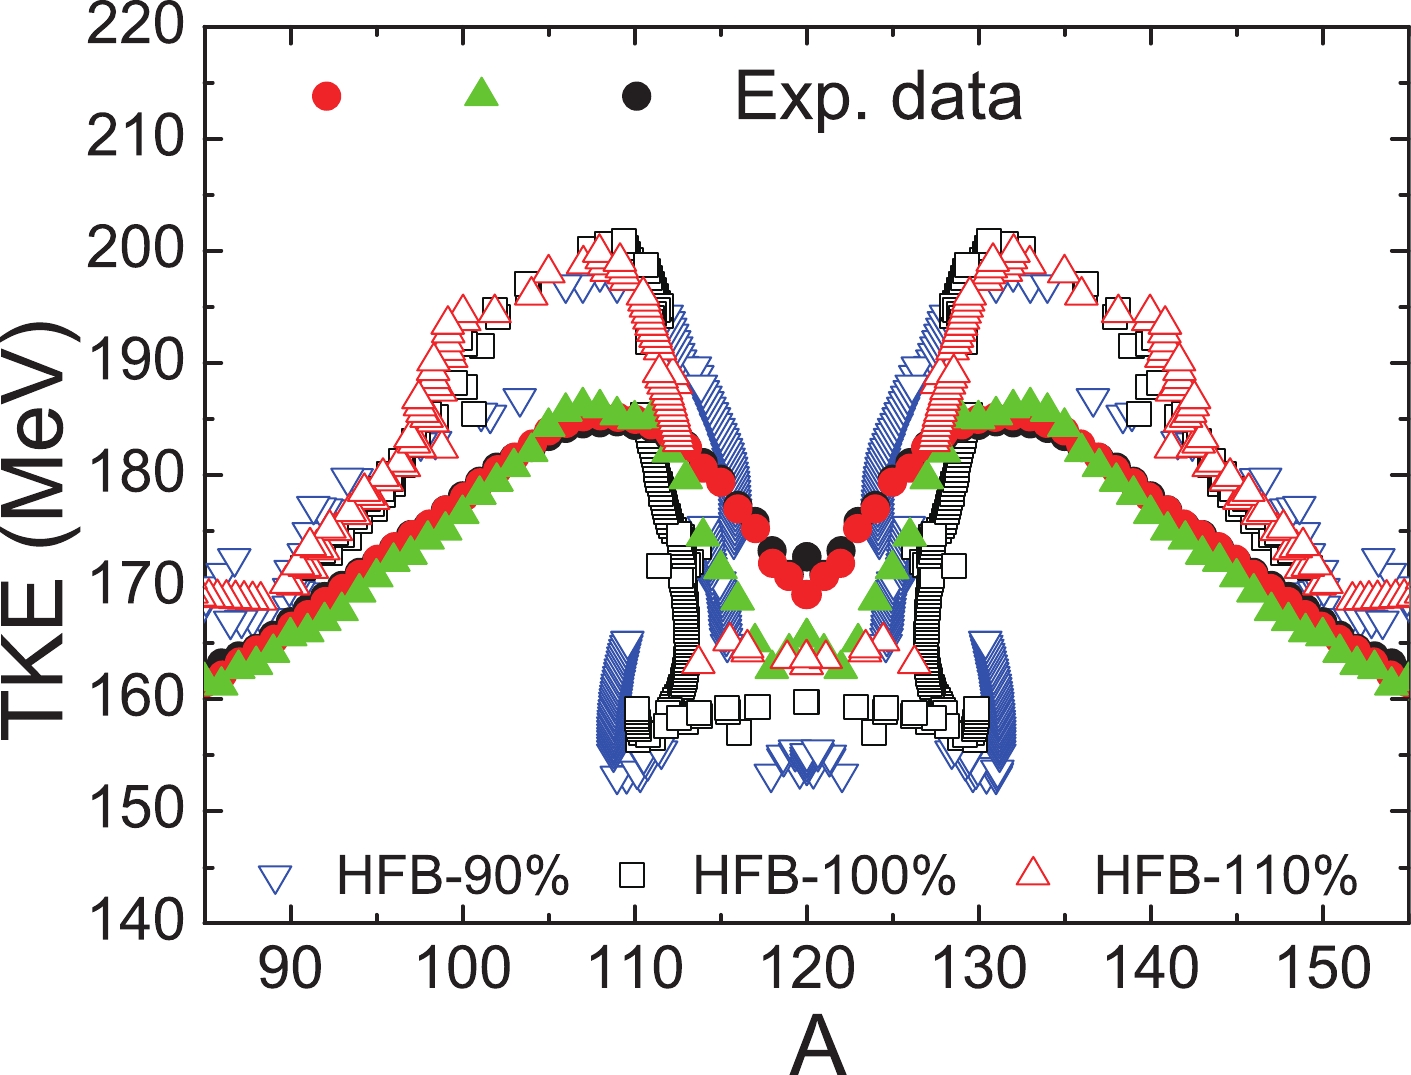
Figure 7. (color online) The total kinetic energies (TKEs) of the nascent fission fragments as functions of the fragment mass for 240Pu calculated using the three different pairing strengths. The solid symbols indicate experimental data [38-40], and the open symbols represent the calculated results.
Overall, the theoretical results qualitatively reproduce the trend of the experimental data, in particular for the positions of the peaks at
$ A_{ \rm{frag}}\simeq132 $ and$ A_{ \rm{frag}} $ $ \simeq108 $ . The peaks of the TKEs correspond to the minimum elongation of the nucleus at the scission configuration, which can be seen from the scission lines in Fig. 5 and the quadruple deformations in Fig. 6(b). It is also noted that the minimum elongations for the three different pairing strengths are very close, and thus, the calculated TKEs around the peaks are similar,$ \approx 15 $ MeV higher than the data. Regarding symmetric fission, the calculated TKEs drop sharply and are lower than the data owing to the very large elongation [c.f. Fig. 6(b)]. A stronger pairing lifts the TKEs in this region, and they become closer to the experimental data. -
In this work, SkM*-DFT calculations in the HFB approximation were performed to obtain the PESs of 240Pu with the quadruple and octuple moments as the collective variables. We mainly analyzed the effects of pairing correlations on the fission properties by varying the pairing strength in a range of 10%.
The topologies of the PESs are similar. From the total energies along the least-energy fission pathway, it is found that the fission barrier can be lowered by the enhancement in the pairing force. From the single-particle levels, it is seen that the level densities become denser and the shell gaps become smaller, indicating a competition between the pairing force and the shell effect. The fluctuations of the pairing gap are reflections of the change in the level density around the Fermi surface. The reduction or enhancement in the pairing force simply shifts the values of the pairing gap. The weakening of the pairing force causes the disappearance of the pairing gap at some deformations.
Overall, the patterns of the scission lines for the three different pairing strengths are similar: large elongated (
$ q_{20}>500 $ b) for symmetric fission, then jumping to shortest elongation$ q_{20}\approx 320 $ b as$ q_{30}\approx 30 $ b3/2 where the heavy fragment close to 132Sn, and finally turning to upper-right direction till very large asymmetry. The enhancement of pairing correlations will shrink the pre-scission domain especially for the symmetric and very asymmetric fission regions and also make the scission line smoother. The total energies$ {E_{ \rm{HFB}}} $ , along the scission line are studied. It is seen that the fragment at the lowest energies in the scission line coincides with the peak in the experimental fragment distribution. Finally, it is emphasized that our microscopic calculations reproduce the trend of the distribution of the measured TKEs, especially for the positions of the peaks at$ A_{ \rm{frag}}\simeq132 $ and$ A_{ \rm{frag}}\simeq108 $ .
Energy density functional analysis of the fission properties of 240Pu: The effect of pairing correlations
- Received Date: 2021-09-06
- Available Online: 2022-02-15
Abstract: We have calculated the potential energy surfaces for 240Pu up to the scission point using the density functional theory with different pairing strengths to investigate the effect of pairing correlations on its fission properties. An enhancement in the pairing correlations lowers the barrier heights, isomeric state, and ridge between the symmetric and asymmetric fission valleys significantly. Moreover, it weakens the microscopic shell structure around the Fermi surface, shrinks the scission frontiers, especially for the symmetric and very asymmetric fission regions, and lifts the total kinetic energies (TKEs) for the symmetric fission region. It is also emphasized that the microscopic calculation qualitatively reproduces the trend of the distribution of the measured TKEs, especially for the positions of the peaks at


 DownLoad: