


 Abstract
 HTML
HTML Reference
 Related
 PDF
PDF


-
One of the most interesting developing areas of nuclear physics concerns the analysis of sub-barrier heavy-ion fusion cross sections, which offers various opportunities for studying fusion dynamics; see, for example, Refs. [1-6]. The most notable outcome of such studies is the hindrance phenomenon of heavy-ion fusion at extreme sub-barrier energies. In fact, for medium-heavy-mass systems, it has been found that the fusion cross sections
$ \sigma_{\rm{fus}} $ drop rapidly with decreasing energy, so the experimental values of$ \sigma_{\rm{fus}} $ are much steeper than the predicted standard coupled-channels (CC) calculations obtained using a Woods-Saxon (WS) potential [5,7-10]. From a practical standpoint, the low-energy fusion hindrance phenomenon in the mentioned mass region can be easily recognized by two important observations. One is the astrophysical$ S(E) $ factor representation and the other is the logarithmic derivative (slope)$ L(E) $ of the fusion excitation functions. For heavy-ion fusion reactions with negative$ Q $ -values, the authors found that the astrophysical$ S(E) $ factor must develop a maximum at an energy$ E_s $ , which shows the onset of the sub-barrier fusion hindrance [11-13]. This reality can be grasped in terms of the definition of the$ S(E) $ factor as follows,$ S(E) = E \sigma_{\rm{fus}} \exp[2\pi(\eta-\eta_0)]\; \; {\rm{mb}}\; {\rm{MeV}}, $

(1) where
$ \eta = e^2Z_pZ_t/\hbar\upsilon_{\rm{rel}} $ is the Sommerfeld parameter and$ \upsilon_{\rm{rel}} $ is the relative velocity between the target and projectile in the center-of-mass frame. In addition,$ \eta_0 $ is an adjustable parameter. For$ E \rightarrow -Q $ when$ Q < 0 $ , in fact, the fusion cross section$ \sigma_{\rm{fus}}(E) $ and thus the$ S(E) $ factor must tend to 0, which results in a maximum of the energy-dependent behavior of this factor at energy$ E_s>-Q $ . The fusion hindrance phenomenon has also been observed in lighter fusion systems with positive$ Q $ -values. For a system with$ Q>0 $ , there is no restriction on$ S(E) $ when$ E\rightarrow 0 $ and therefore, it is not necessary to have an$ S $ -factor maximum. However, there are indications of the occurrence of fusion hindrance in systems with positive Q-values. In fact, the results discussed in previous studies such as Refs. [4,14,15] confirm that the experimental$ S $ -factor for fusion systems with positive$ Q $ -values develops a maximum at low energy. As mentioned above, another sensitive method for identifying the unexpected steep falloff in the low-energy fusion cross sections involves analyzing the energy-dependent behavior of the logarithmic derivative representation$ L(E) $ of the experimental fusion cross section, which is defined as$ L(E) = \frac{{\rm d}[\ln(\sigma_{\rm{fus}} E)]}{ {\rm d}E} = \frac{1}{E\sigma_{\rm{fus}}}\frac{{\rm d}(E\sigma_{\rm{fus}})}{{\rm d}E}\; \; {\rm{MeV}}^{-1}. $

(2) According to the literature, the experimental values of the logarithmic derivative
$ L(E) $ must increase slowly with a decrease in the center-of-mass energy of heavy-ion fusion reactions [7-9,16,17]. The onset of the sub-barrier fusion hindrance phenomenon can be identified by the intersection between the$ L(E) $ factor and the constant$ S(E) $ factor function,$ L_{\rm{CS}}(E) = \dfrac{\pi\eta}{E} $ .From a theoretical point of view, the sudden approach proposed by Mişicu and Esbensen and the adiabatic model proposed by Ichikawa and co-workers were very successful in reproducing the hindrance phenomenon in several cases [7,9]. In 2019, Cheng and Xu [18] employed 13 different phenomenological nuclear potentials (including the KNS model and 12 widely used proximity potentials) to systematically explore the influence of the adiabatic process on the fusion hindrance phenomenon observed in 16 typical fusion reactions. The authors found that by considering the damping of the CC effect, the results of the fusion cross section, astrophysical
$ S(E) $ factor, and logarithmic derivative$ L(E) $ calculated using the coupled-channels model are improved compared with the results without the damping factors. According to the literature, the Pauli exclusion principle generates a repulsion between two reacting nuclei when the overlap between their densities is significant [19]. Microscopic dynamical methods such as the density-constrained frozen Hartree-Fock (DC-FHF) can be used to investigate the impact of Pauli repulsion on the ion-ion potential [20-22]. It has been shown that the nuclear potential inside the barrier is sensitive to the effect of Pauli repulsion. In addition, the authors indicated that the inclusion of this repulsion between composite systems of nucleons within the framework of the DCFHF theory plays an important role in describing the behavior of fusion hindrance at deep sub-barrier energies. The fully microscopic density-constrained time-dependent Hartree-Fock (DC-TDHF) approach also shows that to achieve a good description of the data at energies far below the Coulomb barrier, dynamical effects such as the surface properties due to neck formation, energy dependence of the fusion barriers, and mass transfer must be considered to modify the nucleus-nucleus potential in the inner region [23,24]. Inspired by the Pauli-blocking effects of$ \alpha $ -cluster decay in radioactive nuclei, a microscopic approach has been very recently introduced to explain the fusion hindrance at colliding energies far below the Coulomb barrier, see for example [25]. This approach is based on the$ \alpha $ -cluster structures in n$ \alpha $ nuclei, such as 12C, 16O, and 24Mg. To construct the Pauli blocking potential in the n$ \alpha $ -nucleus-induced fusion reactions, a single folding procedure can be used. The authors of Ref. [25] indicated that a shallow pocket is formed in the inner part of the potential barrier when the standard M3Y nuclear interaction accompanied by the Pauli blocking potential of two colliding nuclei is applied. Furthermore, it was shown that the fusion hindrance phenomenon in the colliding systems 12C+198Pt, 16O+208Pb, 12C+30Si, 24Mg+30Si, and 28Si+30Si can be described well by introducing the Pauli blocking potential.Recently, we proposed a dynamical approach to evaluate the heavy-ion fusion cross sections at deep sub-barrier energies within the framework of the energy-dependent nucleus-nucleus potential [26]. It was shown that when the effect of the surface energy coefficients and the temperature-dependence in the original proximity potential 1977 are taken into account, the theoretical fusion cross sections calculated using the CC calculations provide a good description of the steep falloff phenomenon at low energies for the 28Si+100Mo, 58Ni+54Fe, and 64Ni+64Ni systems. Very recently, we used this idea to explore the fusion hindrance phenomenon for the two fusion reactions 32,34S+89Y [27]. The obtained results demonstrated clear experimental evidence of the occurrence of a steep falloff in the fusion excitation functions of these reactions. In addition, our calculations revealed that the experimental fusion evaporation cross sections
$ \sigma_{\rm{fus}}(E) $ , astrophysical$ S(E) $ factors, and logarithmic derivatives$ L(E) $ can be reproduced using the modified form of the proximity potential well.In this study, we are interested in generalizing the performance of the proximity formalism as a macroscopic nucleus-nucleus potential in reproducing the sub-barrier fusion cross sections for two categories of systems. The first category (category I) includes 14 target and projectile combinations 11B+197Au, 12C+198Pt, 16O+208Pb, 28Si+94Mo, 48Ca+96Zr, 28Si+64Ni, 58Ni+58Ni, 60Ni+89Y, 12C+204Pb, 36S+64Ni, 36S+90Zr, 40Ca+90Zr, 40Ca+40Ca, and 48Ca+48Ca with the product of the atomic number range
$ 392 \leqslant Z_1Z_2 \leqslant 1029 $ . It can be observed that the$ Q $ -values for all the studied systems under category I are negative, ranging from$ Q = -90.5192 $ to$ -1.780 $ MeV. In this category, comparisons are made of the hindrance behavior between the present calculations and those previously obtained for the colliding systems 32S+89Y (with$ Q = -36.626 $ MeV), 34S+89Y (with$ Q = -36.597 $ MeV), 28Si+100Mo (with$ Q = -39.9194 $ MeV), 58Ni+54Fe (with$ Q = -75.8554 $ MeV), and 64Ni+64Ni (with$ Q = -66.4341 $ MeV). The second category (category II) includes five typical fusion reactions 12C+30Si, 24Mg+30Si, 28Si+30Si, 36S+48Ca, and 40Ca+48Ca with$ 84 \leqslant Z_1Z_2 \leqslant 400 $ . The$ Q $ -values for all the studied systems under category II are positive, ranging from$ Q = 4.5572 $ to 17.8873 MeV. In this study, we also analyze the influence of the nuclear surface tension coefficients and temperature dependence on the concept of the barrier distributions$B(E) = {\rm d}^2(E\sigma_{\rm{fus}} )/{\rm d}E^2$ . We also present a discussion on the energy-dependent behavior of the surface energy coefficient$ \gamma $ in the energy range corresponding to the steep fall-off phenomenon. The existence of heavy-ion reactions with positive and negative fusion$ Q $ -values allows us to investigate the effect of the sign of the$ Q $ -value on the energy-dependent behavior of the$ \gamma $ coefficient. According to the literature [28-34], an additional enhancement in the sub-barrier fusion process can be observed due to the coupling of the neutron transfer channels with the positive$ Q_{xn} $ -values. Nevertheless, the effective$ Q $ -values for various neutron transfer channels, involving single- and multi-neutron (up to six neutrons) stripping (or pick-up), are negative for most of the reactions investigated in this study. Hence, we ignore the couplings to the neutron transfer channels in the calculations of the fusion cross sections.The rest of this article is organized as follows. In section II, relevant details of the theoretical frameworks used to calculate the nuclear potential are described. The setup and results are presented in section III. Section IV concludes this work with a short summary.
-
The nuclear potential
$ V_N(r) $ of the original proximity potential 1977 (Prox. 77) [35] is given by$ V^{\rm{Prox.77}}_{N}(r) = 4\pi\gamma b\overline{R}\; \Phi\bigg(\frac{s}{b}\bigg)\; \; {\rm{MeV}}. $

(3) Here,
$ s $ is the distance between the near surfaces of two reacting nuclei,$ \overline{R} $ is the mean curvature radius, and$ \Phi(s/b) $ is the universal function [35-37]. In addition,$ b $ represents the width of the nuclear surface and is considered to be 1 fm. In Eq. (3), the nuclear surface tension coefficient$ \gamma $ is obtained from the work of Myers and Świątecki (Lysekil mass formula) [38]$ \gamma = \gamma_0\Biggl[1-k_s\Biggl(\frac{N-Z}{A}\Biggl)^2\Biggl]\; \; {\rm{MeV \cdot fm}}^{-2}, $

(4) where
$ N $ ,$ Z $ , and$ A $ represent the neutron, proton, and mass numbers of the compound nucleus, respectively. In addition,$ \gamma_0 $ and$ k_s $ are the surface energy constant and surface asymmetry constant, respectively. In the original version of the proximity formalism, these constants have been parameterized as$ \gamma_0 = 0.9517 \; {\rm{MeV\cdot fm}}^{-2} $ and$ k_s = 1.7826 $ . -
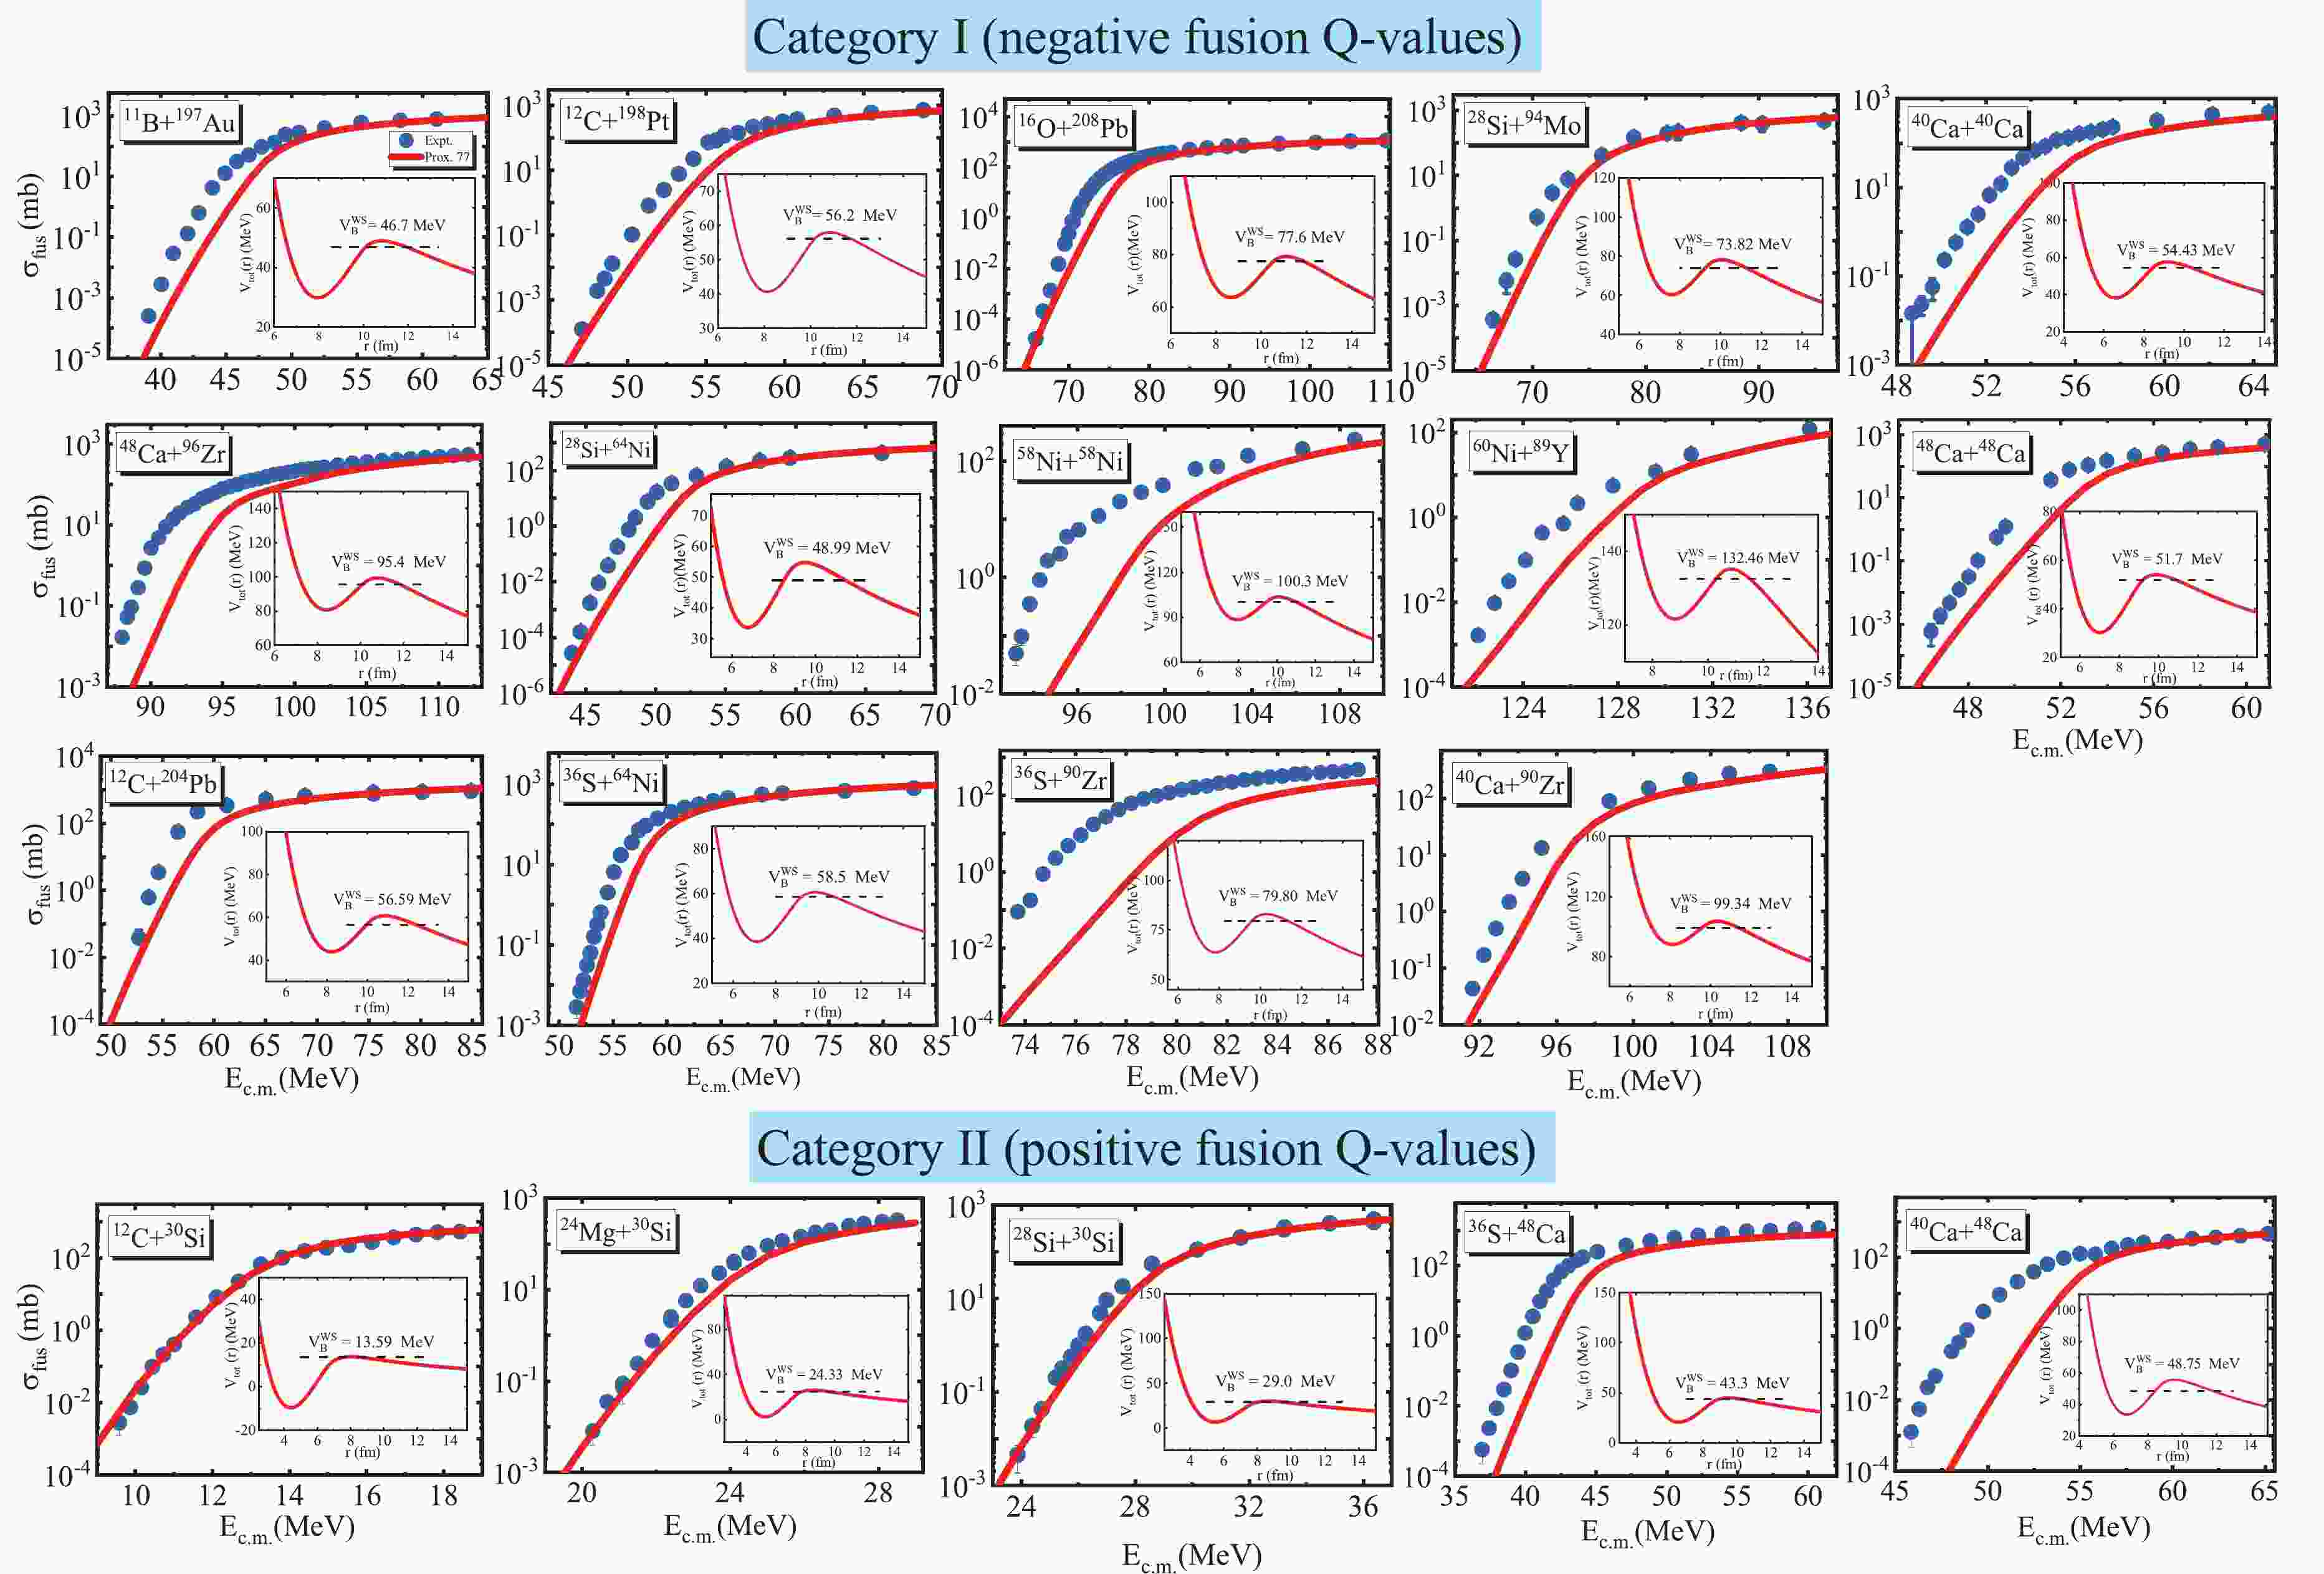
The measurements of the excitation function for all reactions studied presently confirm that there are strong indications of the fusion hindrance (or steep fall-off) phenomenon at energies well below the Coulomb barrier. It has been previously shown that the experimental fusion cross sections for these reactions drop much faster than predicted by the standard CC calculations. Accordingly, in the first step of the calculations, we attempt to analyze the heavy-ion fusion cross sections for the studied reactions under categories I and II within the framework of Prox. 77. In previous studies [36,37,39], the authors often used the Wong formula to estimate the theoretical fusion cross sections based on the proximity potential formalism. The theoretical calculations performed with the Wong formula fail to reproduce the experimental data at sub-barrier energies for medium-heavy systems [36,37,39-41]. Therefore, in this study, we compute the theoretical values of the fusion cross section using the standard CC calculations based on the computer code CCFULL [42]. It must be noted that these calculations include couplings to the low-lying quadrupole and octupole excitation states in both the target and projectile as well as the mutual and multi-phonon excitations of these states. The level energies and spectroscopic information for the low-lying surface vibrations of the reacting nuclei are extracted from Refs. [43-46]. The results of the calculations are shown in Fig. 1. Observing this figure, we conclude that the Prox. 77 model significantly underestimates the measurements of the fusion-evaporation excitation functions at sub-barrier energies for a number of systems. However, it appears that this potential model achieves better performance for the lighter colliding systems 12C+30Si, 28Si+30Si, and 24Mg+30Si. These results can be understood by observing the radial behavior of the Coulomb plus nuclear potentials used in the CC calculations (see the inset in the figure). To gain further insight, we compare in Table 1 the barrier heights obtained from the proximity model calculations with those obtained from the standard WS potentials used in previous studies. In the cases where these data are not available, we use the parameterized form for the fusion barrier height, which has been obtained by analyzing the empirical/experimental fusion barrier heights for more than 200 reactions [47]. It is clear that the original version of the proximity potential produces fusion barriers that are higher and therefore thicker than the empirical barriers.

Figure 1. (color online) Comparison of the experimental fusion cross sections with those obtained theoretically using the original proximity potential 1977 for different heavy-ion reactions under categories I (upper panels) and II (lower panels). For further understanding, the fusion barriers resulting from the Prox. 77 model are compared with those from the WS/Expt (horizontal dashed lines).
Reaction $V_B^{ {\rm{Prox} }. 77} /{\rm{MeV} }$ 

$V_B^{ {\rm{Prox.} }\; 77\; ({\rm{Mod} }-1)} /{\rm{MeV} }$ 

$V_B^{ {\rm{WS/Expt} } } /{\rm{MeV} }$ 

Ref. Category I 11B+197Au 48.92 46.78 46.70 [55] 12C+198Pt 58.01 56.08 56.20 [55] 16O+208Pb 79.38 77.49 77.60 [56] 28Si+94Mo 78.14 76.38 73.82 [47] 48Ca+96Zr 99.33 96.10 95.40 [57] 28Si+64Ni 54.74 52.51 48.99 [58] 58Ni+58Ni 103.49 99.64 100.30 [59] 60Ni+89Y 135.13 132.93 132.40 [11] 12C+204Pb 60.73 58.00 56.59 [47] 36S+64Ni 60.63 58.84 58.50 [60] 36S+90Zr 82.99 78.87 79.80 [61] 40Ca+90Zr 103.6 101.99 99.34 [62] 40Ca+40Ca 57.59 55.43 54.43 [63] 48Ca+48Ca 53.95 52.06 51.70 [64] Category II 12C+30Si 13.67 13.49 13.59 [3] 24Mg+28Si 25.97 25.30 24.33 [4] 28Si+30Si 29.88 29.28 29.00 [65] 36S+48Ca 44.62 42.44 43.30 [66] 40Ca+48Ca 55.66 52.17 48.75 [64] Table 1. The fusion barrier heights
$ V_B $ (in MeV) obtained using the original and modified forms of the proximity potential for different colliding systems under categories I and II. The values of the Coulomb barrier height calculated using the WS potentials and those obtained with the parameterized form suggested in Ref. [47] are also listed.To improve the results of the proximity potential, we simultaneously explore the role of two important physical effects in fusion dynamics. In fact, we discuss the effect of the surface energy coefficient
$ \gamma $ and the thermal effects of hot nuclei on the proximity potential and ultimately on the fusion cross sections of the considered systems. According to the literature [26,27,39], the mentioned physical effects play a crucial role in the sub-barrier enhancement. To implement this idea, it is crucial to use a modified version of the surface energy coefficient in the proximity potential as follows,$ \gamma(T) = \acute{\gamma_0}\Biggl[1-\acute{k_s}\Biggl(\frac{N-Z}{A}\Biggl)^2\Biggl]\Biggl[1-\frac{T-T_B}{T_B}\Biggl]^{3/2}\; \; {\rm{MeV \cdot fm}}^{-2}. $

(5) As it is evident from the above equation, we use the revised sets of the constants
$ (\acute{\gamma_0},\acute{k_s}) $ for the present calculations to impose the effect of the surface energy coefficient on the fusion dynamics. The values of these constants are presented in Table 2. To implement the thermal effects of hot nuclei, we follow the procedure proposed in Ref. [48] for the temperature dependence of the liquid surface tension. In that study, the authors introduced a modified temperature-dependent surface energy coefficient in the proximity potential based on the equation of state proposed by van der Waals [49-51]. We note that the temperature$ T $ can be related to the energy of the projectile nucleus in the center-of-mass frame$ E_{\rm{c.m.}} $ via the entrance (incoming) channel$ Q_{\rm{in}} $ -value [52-54] as follows,Reaction $\acute{\gamma_0} /{\rm{(MeV\cdot{\rm{fm} }^{-2})} }$ 

$ \acute{k_s} $ 

T/MeV $E_s/{\rm{MeV} }$ 

$\gamma^{ {\rm{Prox} }. 77} /{\rm{(MeV\cdot{\rm{fm} }^{-2})} }$ 

$\gamma^{ {\rm{Prox} }. 77 ({\rm{Mod} }-1)}/{\rm{(MeV\cdot{\rm{fm} }^{-2})} }$ 

Category I 11B+197Au 1.460734 4.0 1.25 40.97 0.89238 1.65446 12C+198Pt 1.460734 4.0 1.54 48.08 0.89029 1.41245 16O+208Pb 0.918 0.7546 1.08 70.40 0.88624 1.23989 28Si+94Mo 1.01734 1.79 1.84 66.50 0.94030 1.25084 48Ca+96Zr 1.27326 2.5 1.93 88.38 0.90457 1.42037 28Si+64Ni 1.460734 4.0 2.49 45.31 0.93887 1.54155 58Ni+58Ni 1.27326 2.5 1.93 93.83 0.94968 1.53975 60Ni+89Y 1.01734 1.79 1.68 122.8 0.93450 1.33418 12C+204Pb 1.460734 4.0 1.11 53.68 0.89352 1.68692 36S+64Ni 1.27326 2.5 2.38 51.95 0.92727 1.34221 36S+90Zr 1.460734 4.0 1.79 73.70 0.93075 1.81337 40Ca+90Zr 0.918 0.7546 1.87 91.65 0.94166 1.15089 40Ca+40Ca 1.27326 2.5 2.39 49.00 0.95170 1.47676 48Ca+48Ca 1.27326 2.5 2.24 48.00 0.90457 1.40977 Category II 12C+30Si 1.01734 1.79 2.70 10.43 0.94785 1.07667 24Mg+28Si 1.1756 2.2 2.95 20.68 0.94937 1.24903 28Si+30Si 1.01734 1.79 2.69 23.86 0.94968 1.18083 36S+48Ca 1.460734 4.0 2.28 36.92 0.91707 1.67610 40Ca+48Ca 1.460734 4.0 2.03 46.73 0.93767 2.06212 Table 2. Values of the (
$ \acute{\gamma_0},\acute{k_s} $ ) constants for different colliding systems. The calculated values of the temperature$ T $ (in MeV), threshold energy$ E_s $ , and surface energy coefficients$ \gamma $ based on the Prox. 77 and Prox. 77 (Mod-1) potentials are also presented.$ E_{\rm{c.m.}} + Q_{\rm{in}} = \frac{1}{9}AT^2 - T, $

(6) where
$ A $ is the mass number of the compound nucleus. In Eq. (5), temperature$ T_B $ corresponds to the energy of the Coulomb barrier evaluated using Eq. (15) from Ref. [48]. In this work, the results of the proximity potential 1977 accompanied by the modified form (5) are marked as "Prox. 77 (Mod-1)". The temperature values$ T $ used for the calculations are listed in the fourth column of Table 2 for different colliding systems with both negative and positive$ Q $ -values. It can be observed that a fixed value of the center-of-mass energy$ E_{\rm{c.m.}} $ that approximately corresponds to the experimental barrier height,$ E_{\rm{c.m.}}\approx V_B^{\rm{Expt.}} $ , is used to calculate the temperature value$ T $ in each colliding system.Concerning this idea, it must be mentioned that the function
$ V_N(r) $ of the Prox. 77 model, Eq. (3), reveals that the nuclear proximity potential depends directly on the surface energy coefficient. On the other hand, the present modifications allow us to obtain the larger strengths of the nuclear surface tension between two colliding nuclei (see Table 2 for a comparison of the coefficients$ \gamma^{\rm{Prox. 77}} $ and$ \gamma^{\rm{Prox.77(Mod-1)}} $ ). Therefore, it is straightforward to see that more attractive nuclear potentials can be obtained compared with the original proximity potentials 1977 when the present modified form (5) is used instead of Eq. (4) in different colliding systems. As the accuracy of the Prox. 77 (Mod-1) model must be carefully verified, we calculate the Coulomb barrier heights$ V_B $ for different heavy-ion fusion reactions in comparison with the corresponding values from the standard WS potentials and experimental/empirical data. The calculated barrier heights are shown in the third column of Table 1. From this table, it can be clearly seen that the modified form of the proximity potential can reproduce the fusion barrier heights in a better manner than the original version of this formalism. To further understand the role of the modified form (5), in Fig. 2, we display the percentage difference of the fusion barrier heights$ \Delta V_B $ (%) as a function of the charge product$ Z_1Z_2 $ for all systems with both negative (upper panel) and positive (lower panel)$ Q $ -values. It can be defined as follows,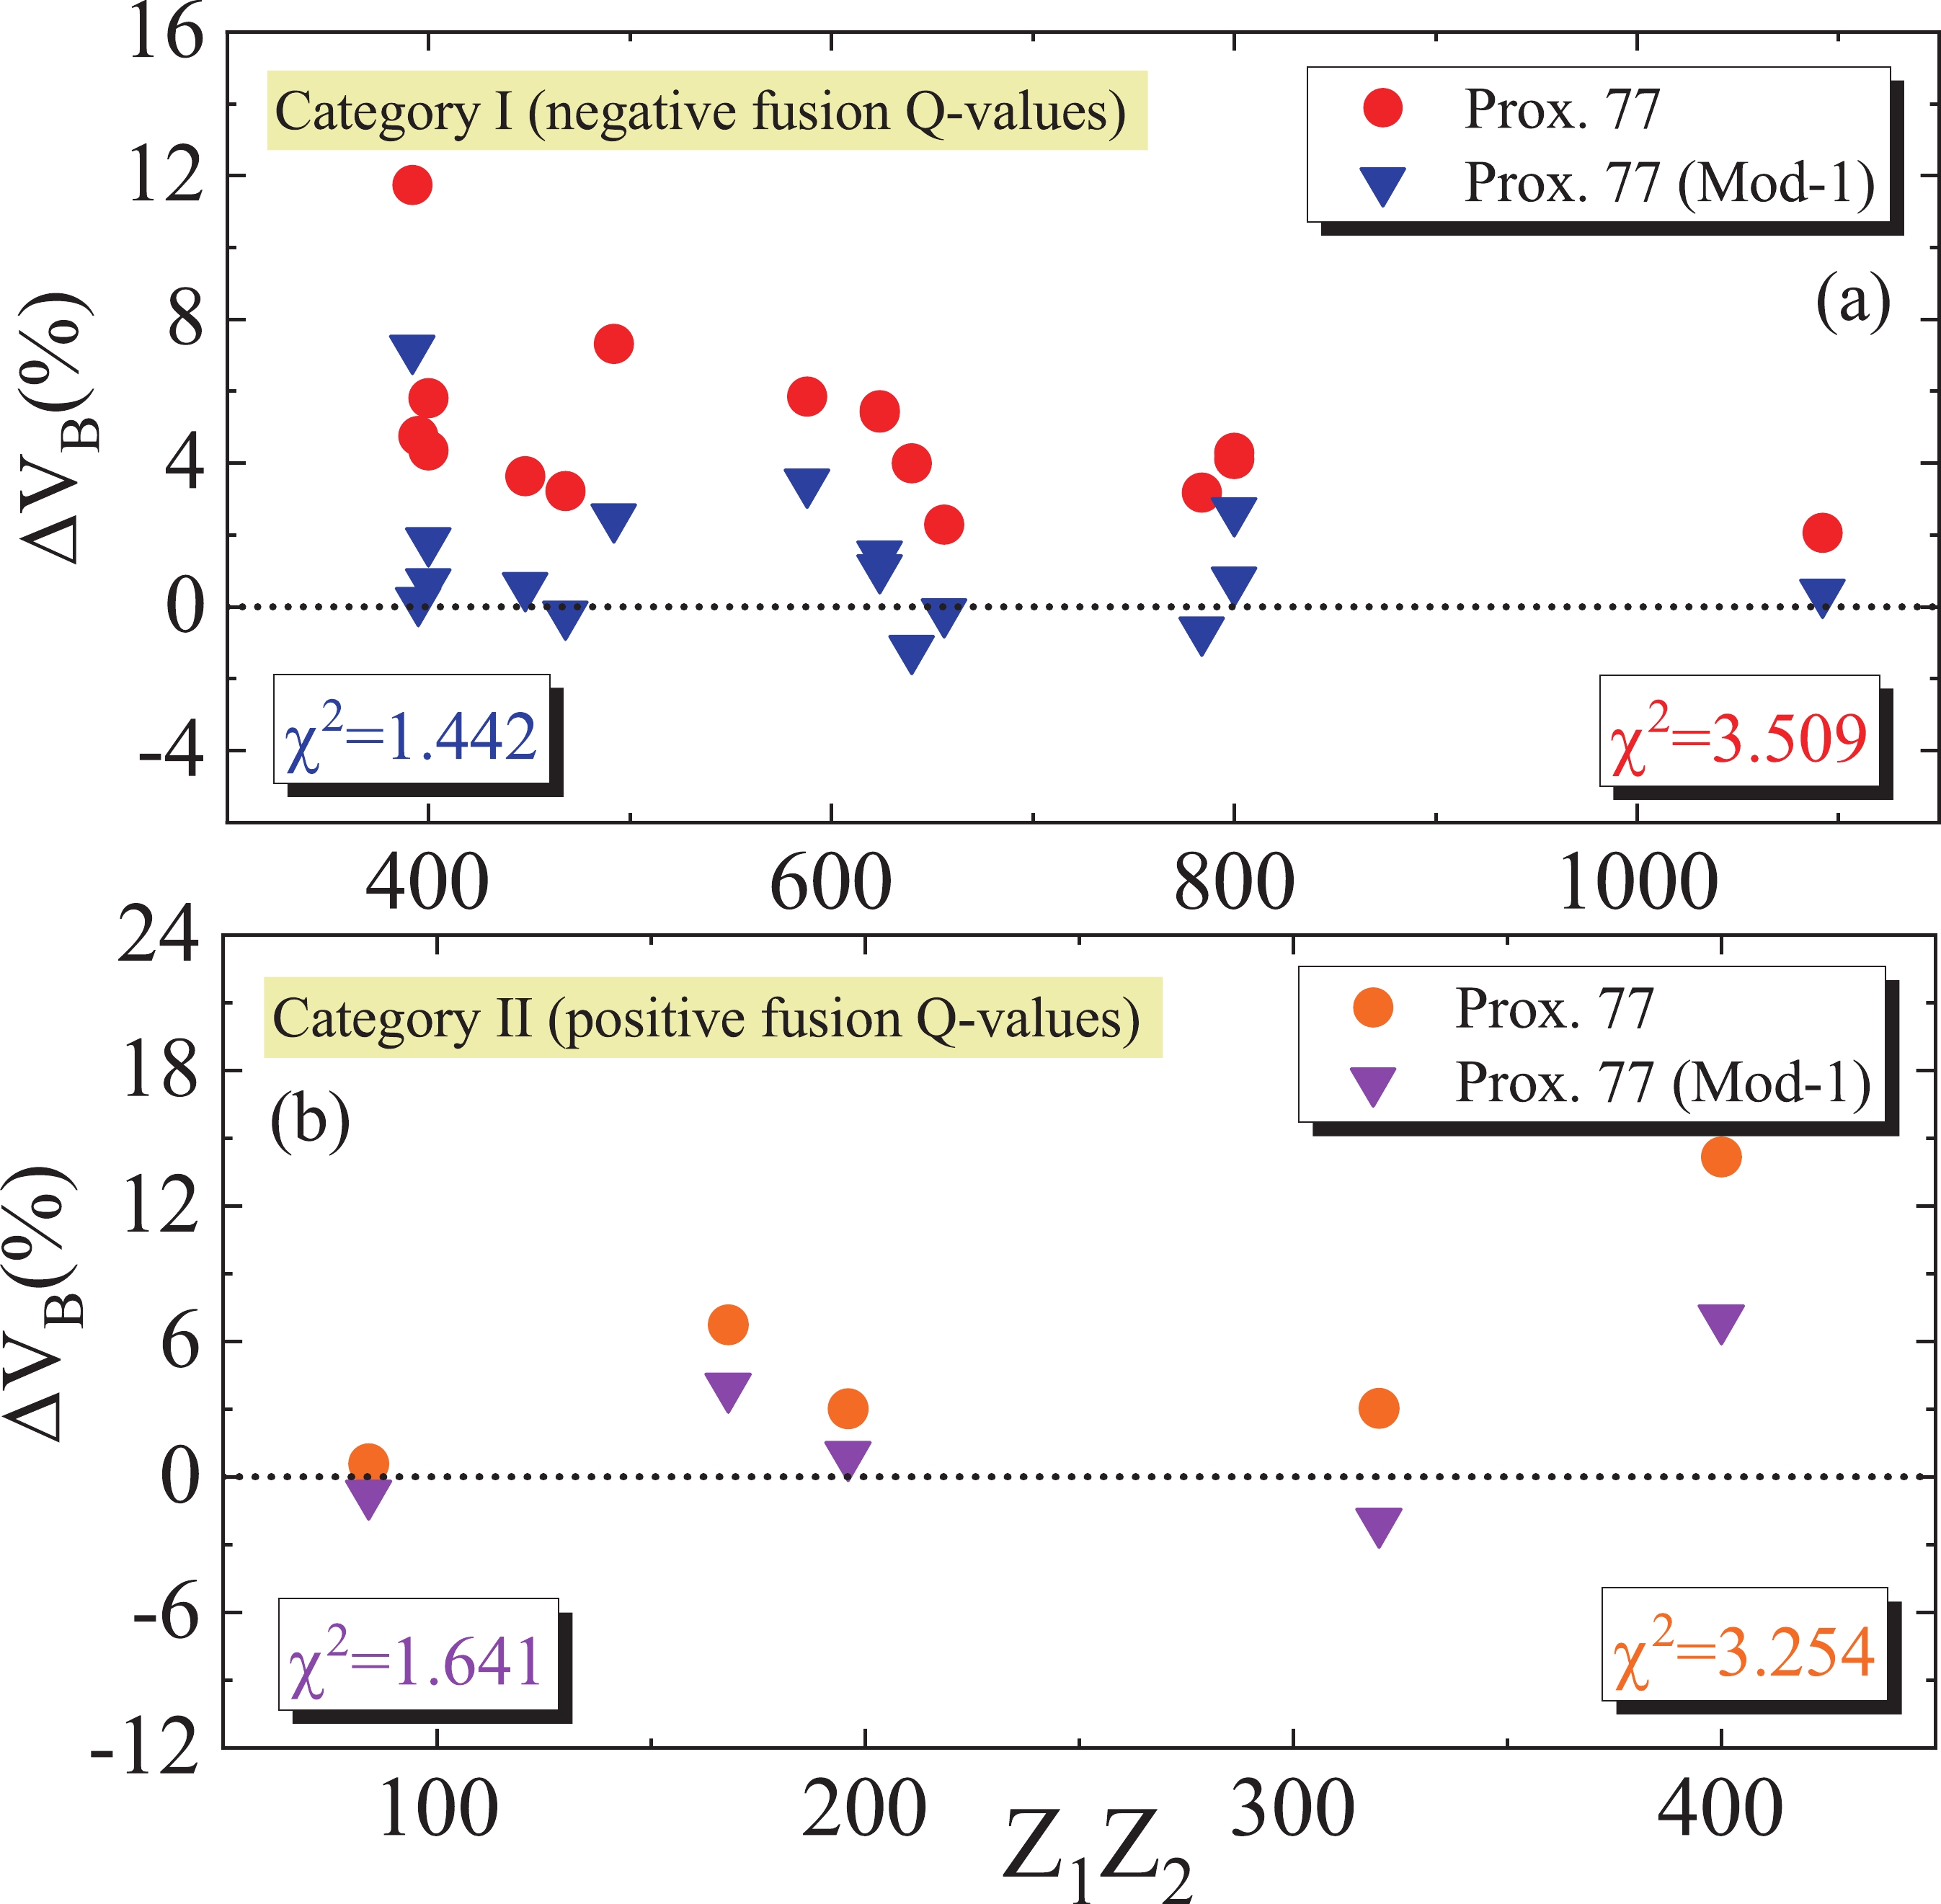
Figure 2. (color online) The percentage difference
$ \Delta V_B $ (%) between the theoretical and experimental barrier heights as a function of the charge product of reacting nuclei based on the original and modified forms of the Prox. 77 model for the fusion reactions under categories I (upper panel) and II (lower panel).$ \Delta V_B(\%) = \Biggl(\frac{V_B^{\rm{Theor}}-V_B^{\rm{Expt}}}{V_B^{\rm{Expt}}}\Biggl)\times 100. $

(7) From this figure, it can be seen that the original version of the proximity potential formalism fails to reproduce the experimental/empirical barrier heights for the studied reactions (
$ \chi^2_{V_B} = 3.254 $ and 3.509 for the fusion systems under categories I and II, respectively), whereas the Prox. 77 (Mod-1) model provides an acceptable description of the data ($ \chi^2_{V_B} = 1.641 $ and 1.442 for the fusion systems under categories I and II, respectively).We also repeated the calculations of the fusion cross sections with the Prox. 77 (Mod-1) potential. The results are shown in Fig. 3 by the short-dashed (black) curves. It can be seen that the CC calculations performed with this modified potential show good agreement with the experimental data at and around sub-barrier energies, but we are unable to recover the lowest measured energy points at the deep sub-barrier energies, which provide strong evidence of the phenomenon of heavy-ion fusion hindrance. The energy threshold
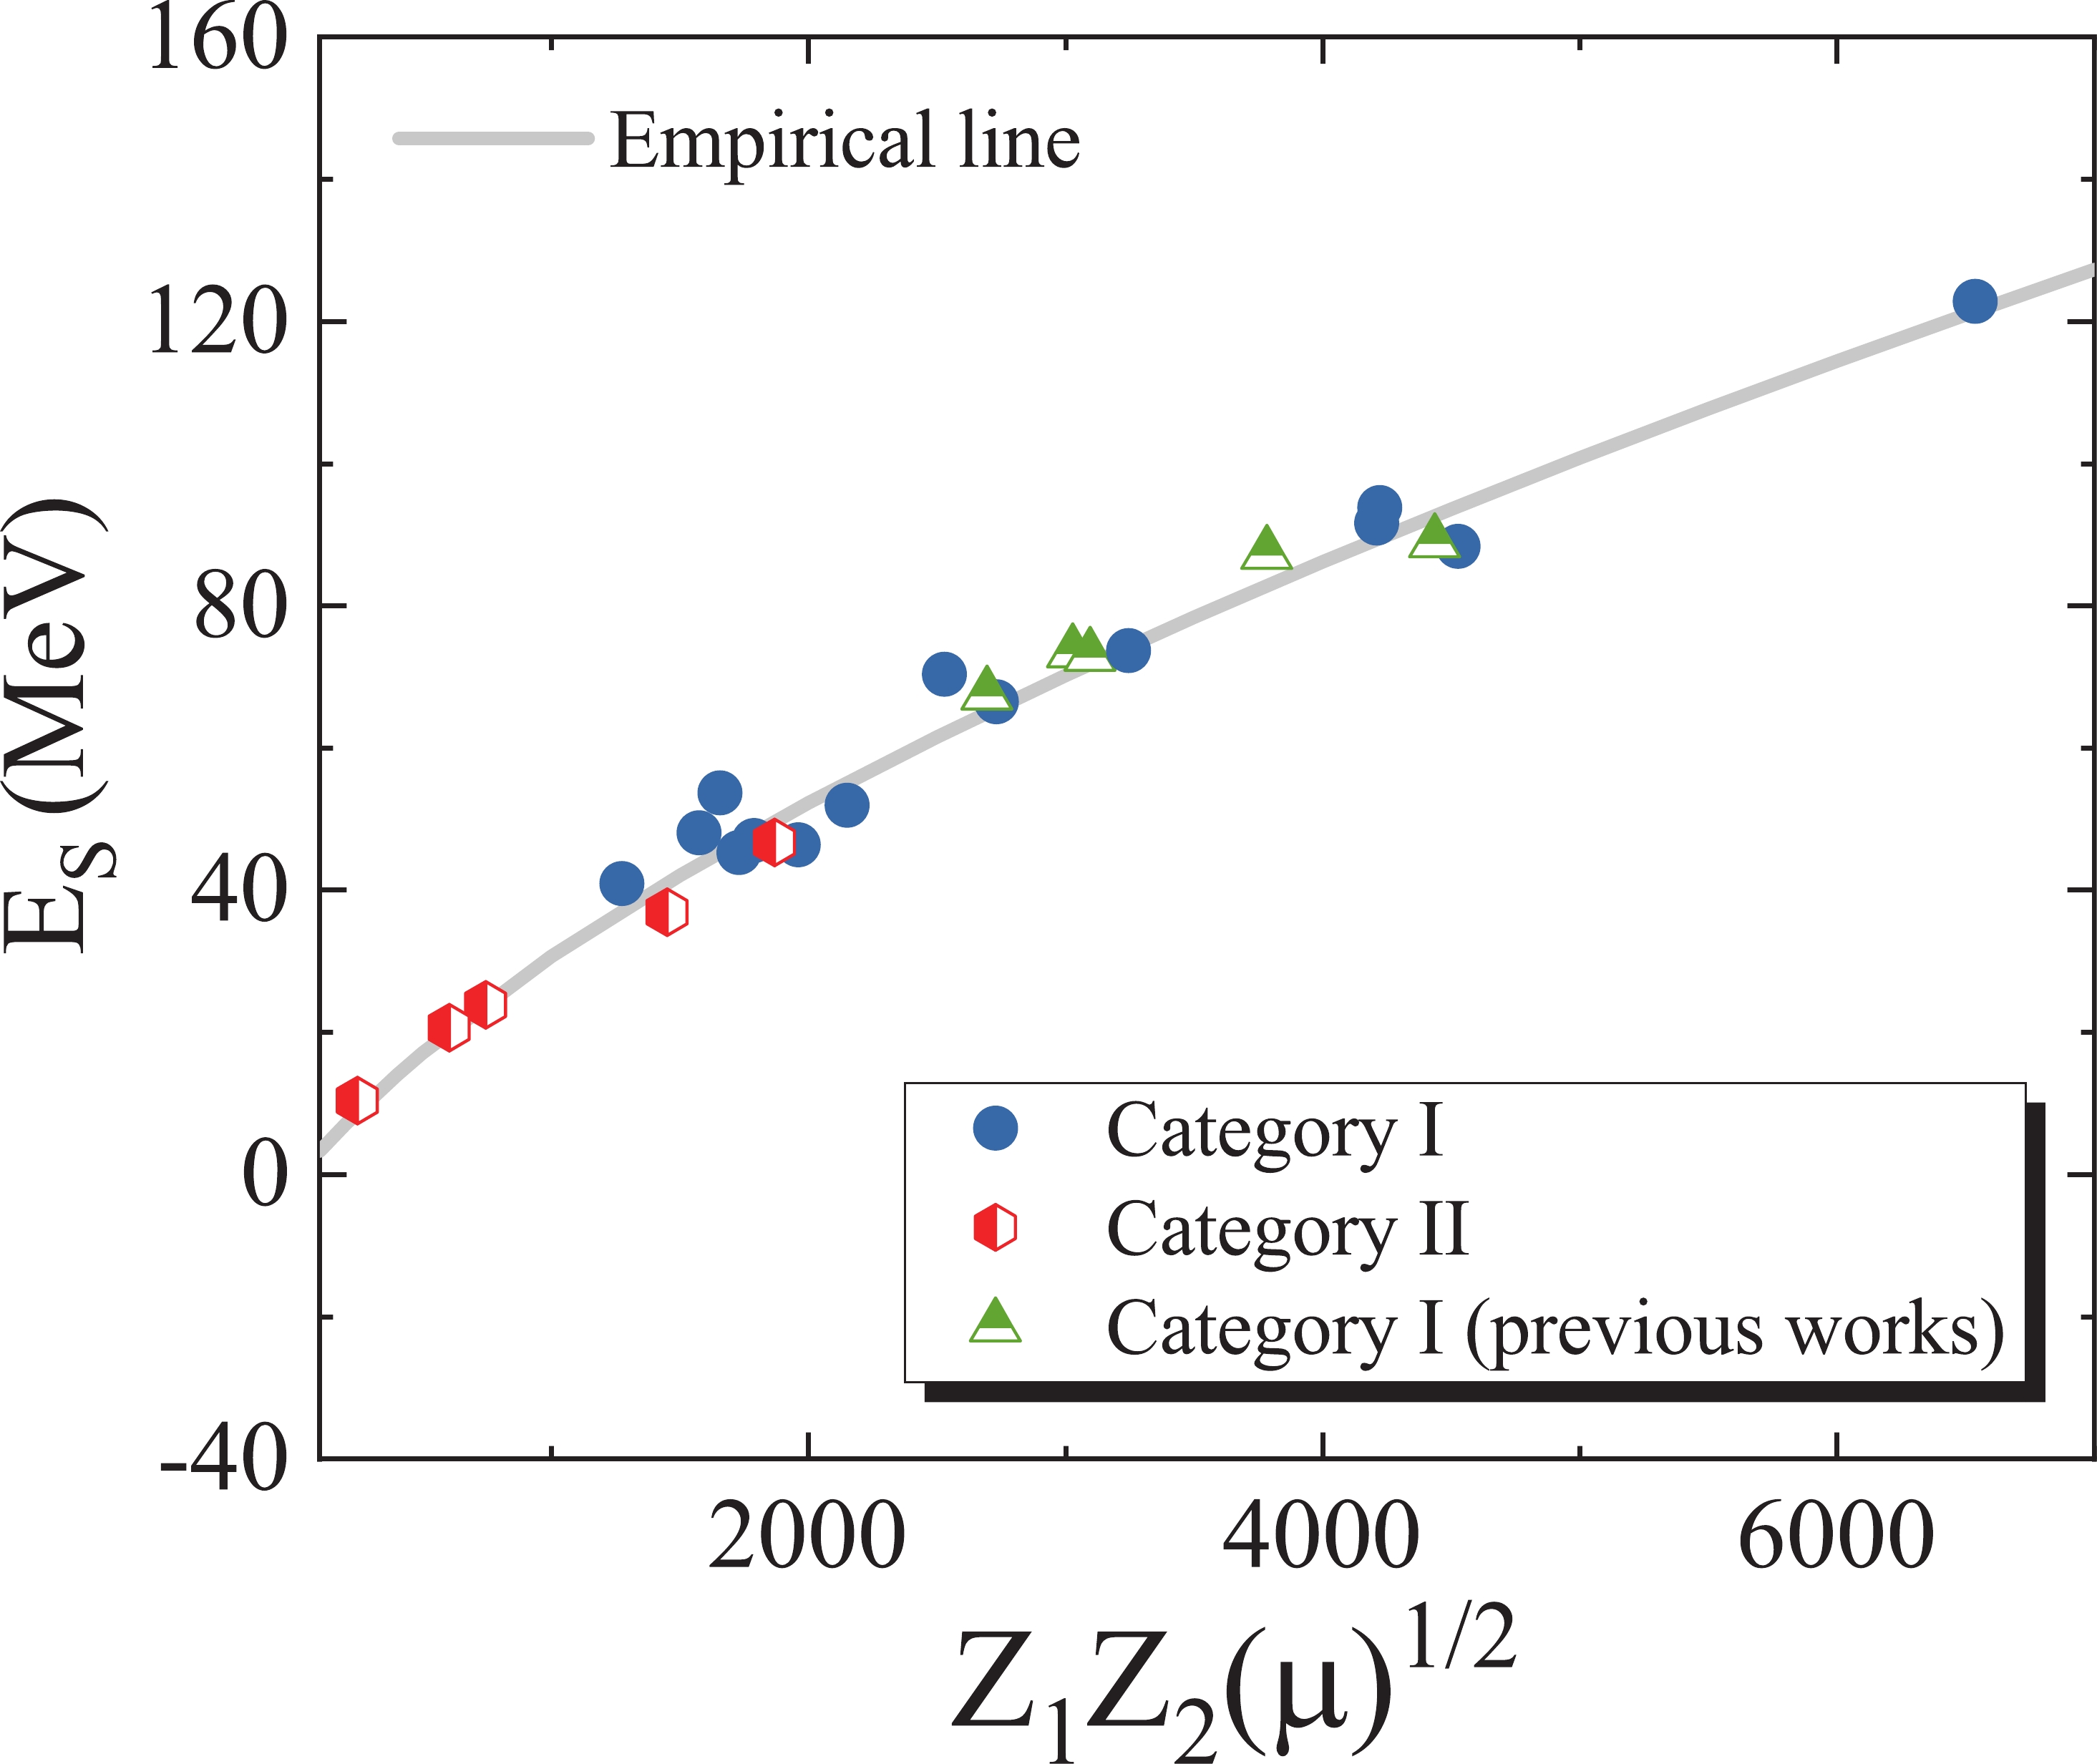
$ E_s $ for the onset of deep sub-barrier fusion hindrance for the present cases can be estimated from Fig. 3. The extracted values of the energy$ E_s $ are compared in Fig. 4 with the empirical analysis presented in Ref. [4], as indicated by the gray solid curve, as a function of the system parameter$ \zeta = Z_1Z_2\mu^{1/2} $ . In two previous studies [26,27], we demonstrated that fusion hindrance appears at the energy threshold$ E_s$ = 87.29, 88.9, 67.5, 73.42, and 72.95 MeV for the 58Ni+56Fe, 64Ni+64Ni, 28Si+100Mo, 32S+89Y, and 34S+89Y systems, respectively. These values are presented in Fig. 4 for comparison. It can be observed that the locations of the hindrance threshold points for the present systems are in reasonable agreement with the empirical prediction. As depicted, the effect of the surface energy coefficient$ \gamma $ and thermal properties of liquid and hot nuclei have so far been successful in curing the deficiencies of the nuclear proximity potential in the energy region$ E_{\rm{c.m.}}> E_s $ .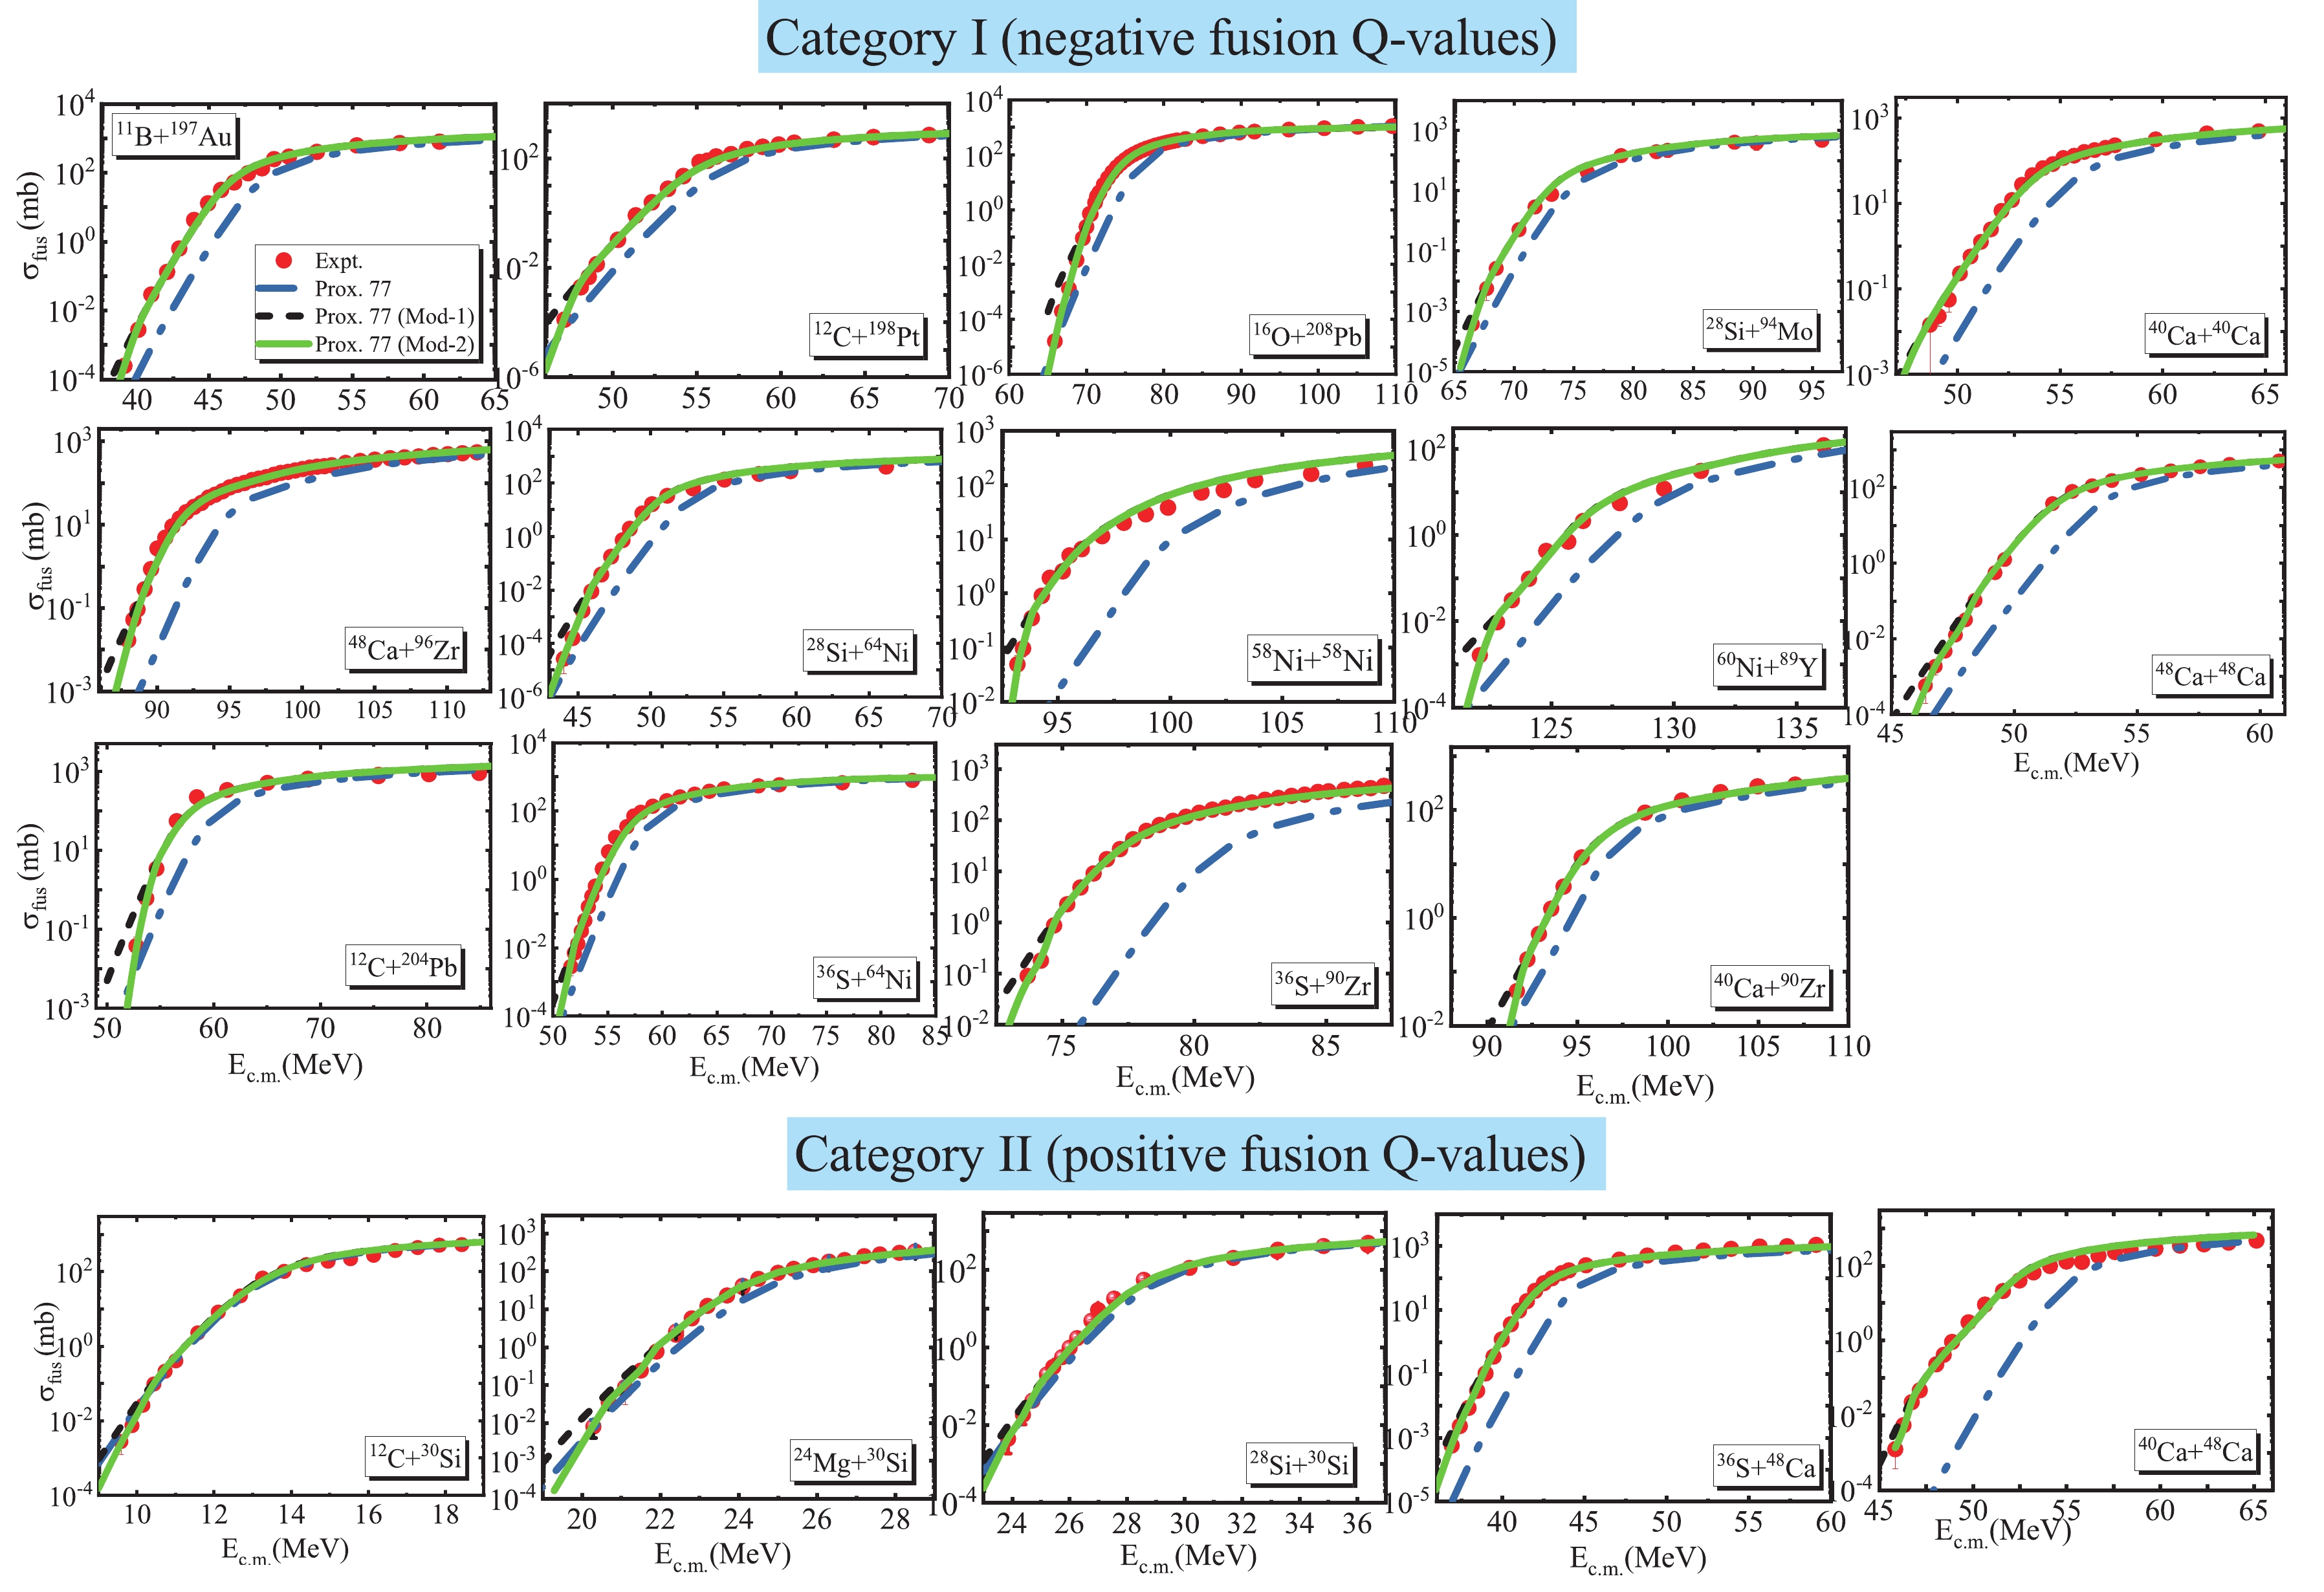
Figure 3. (color online) Measured fusion cross sections for different heavy-ion fusion reactions under categories I (upper panels) and II (lower panels) are compared to the CC calculations based on the original and modified versions of the proximity potential.
We would like to mention that the characteristics of the nuclear ion-ion potential at extremely close distances affect the measurements of the fusion cross sections in the range of microbarn and nanobarn levels [7-9,67]. On the other hand, it can be shown that the adjustable parameter
$ \acute{\gamma_0} $ in Eq. (5) directly affects the shape of the inner side of the potential barrier. To obtain the best fit to the experimentally observed fusion data at extremely low energies$ (E_{\rm{c.m.}}\leqslant E_s) $ , we therefore investigate the fusion mechanisms of the selected reactions by reducing the strength of the surface energy coefficient$ \acute{\gamma_0} $ at each bombarding energy. Under these conditions, we encounter an energy-dependent behavior of this constant. It must be pointed out that by imposing this physical effect, we obtain a modified form of the Prox. 77 (Mod-1) potential, which is termed as "Prox. 77 (Mod-2)". It is worth noting that the calculated ion-ion potentials and thus the fusion cross sections based on the Prox. 77 (Mod-2) are quite similar to those obtained by the Prox. 77 (Mod-1) in the energy region$ E_{\rm{c.m.}} > E_s $ . It can be concluded that the energy-dependent parameter$ \acute{\gamma_0}(E) $ leads to a spectrum of fusion barriers of variable weights and heights in the energy region$ E_{\rm{c.m.}}\leqslant E_s $ , as shown in Fig. 5 for the 28Si+64Ni reaction as an example. In this spectrum, the heights of the energy-dependent fusion barriers increase with a decrease in the incident energy of the relative motion in the center of mass frame. Consequently, it can be seen that the Prox. 77 (Mod-2) model calculations (green solid curve) predict lower values for the sub-barrier fusion cross sections compared with the outcomes of the Prox. 77 (Mod-1) model (red dotted curve); therefore, this model achieves close agreement with the experimental cross sections at the deep sub-barrier energies. It should be noted that the adjusted values of the$ \acute{\gamma_0} $ parameter used to gain better agreement with the fusion data of the 28Si+64Ni reaction are presented in Fig. 5. To further explore the influence of the energy-dependent interaction potential on the fusion cross sections in the deep sub-barrier energy region, in Fig. 3, the available experimental fusion excitation functions are compared with the CC calculations performed with this modified form of the Prox. 77 model for all the studied fusion systems with both negative and positive$ Q $ -values. It can be seen that the best fits to the data at low energies are achieved using the calculations based on the Prox. 77 (Mod-2) model.
Figure 5. (color online) Plot of the fusion excitation function for the 28Si+64Ni system compared with several calculations described in the text. The energy-dependent behavior of the ion-ion potential based on the Prox. 77 (Mod-2) model in the
$ E_{\rm{c.m.}}\leqslant E_s $ region is also displayed in the insert of the figure.In Fig. 6, we display the variation of the energy-dependent ratio
$ \acute{\gamma_0}(E)/\acute{\gamma_0} $ with the energy ratio$ E/E_s $ for all the colliding systems. The results are compared with the available theoretical data obtained from Refs. [26,27]. It can be realized that the extracted values of the surface energy constant at the bombarding energies$ E\leqslant E_s $ follow a linear increasing trend with an increase in the energy in the center of mass frame. In this study, we formulate this observed trend using the following relation,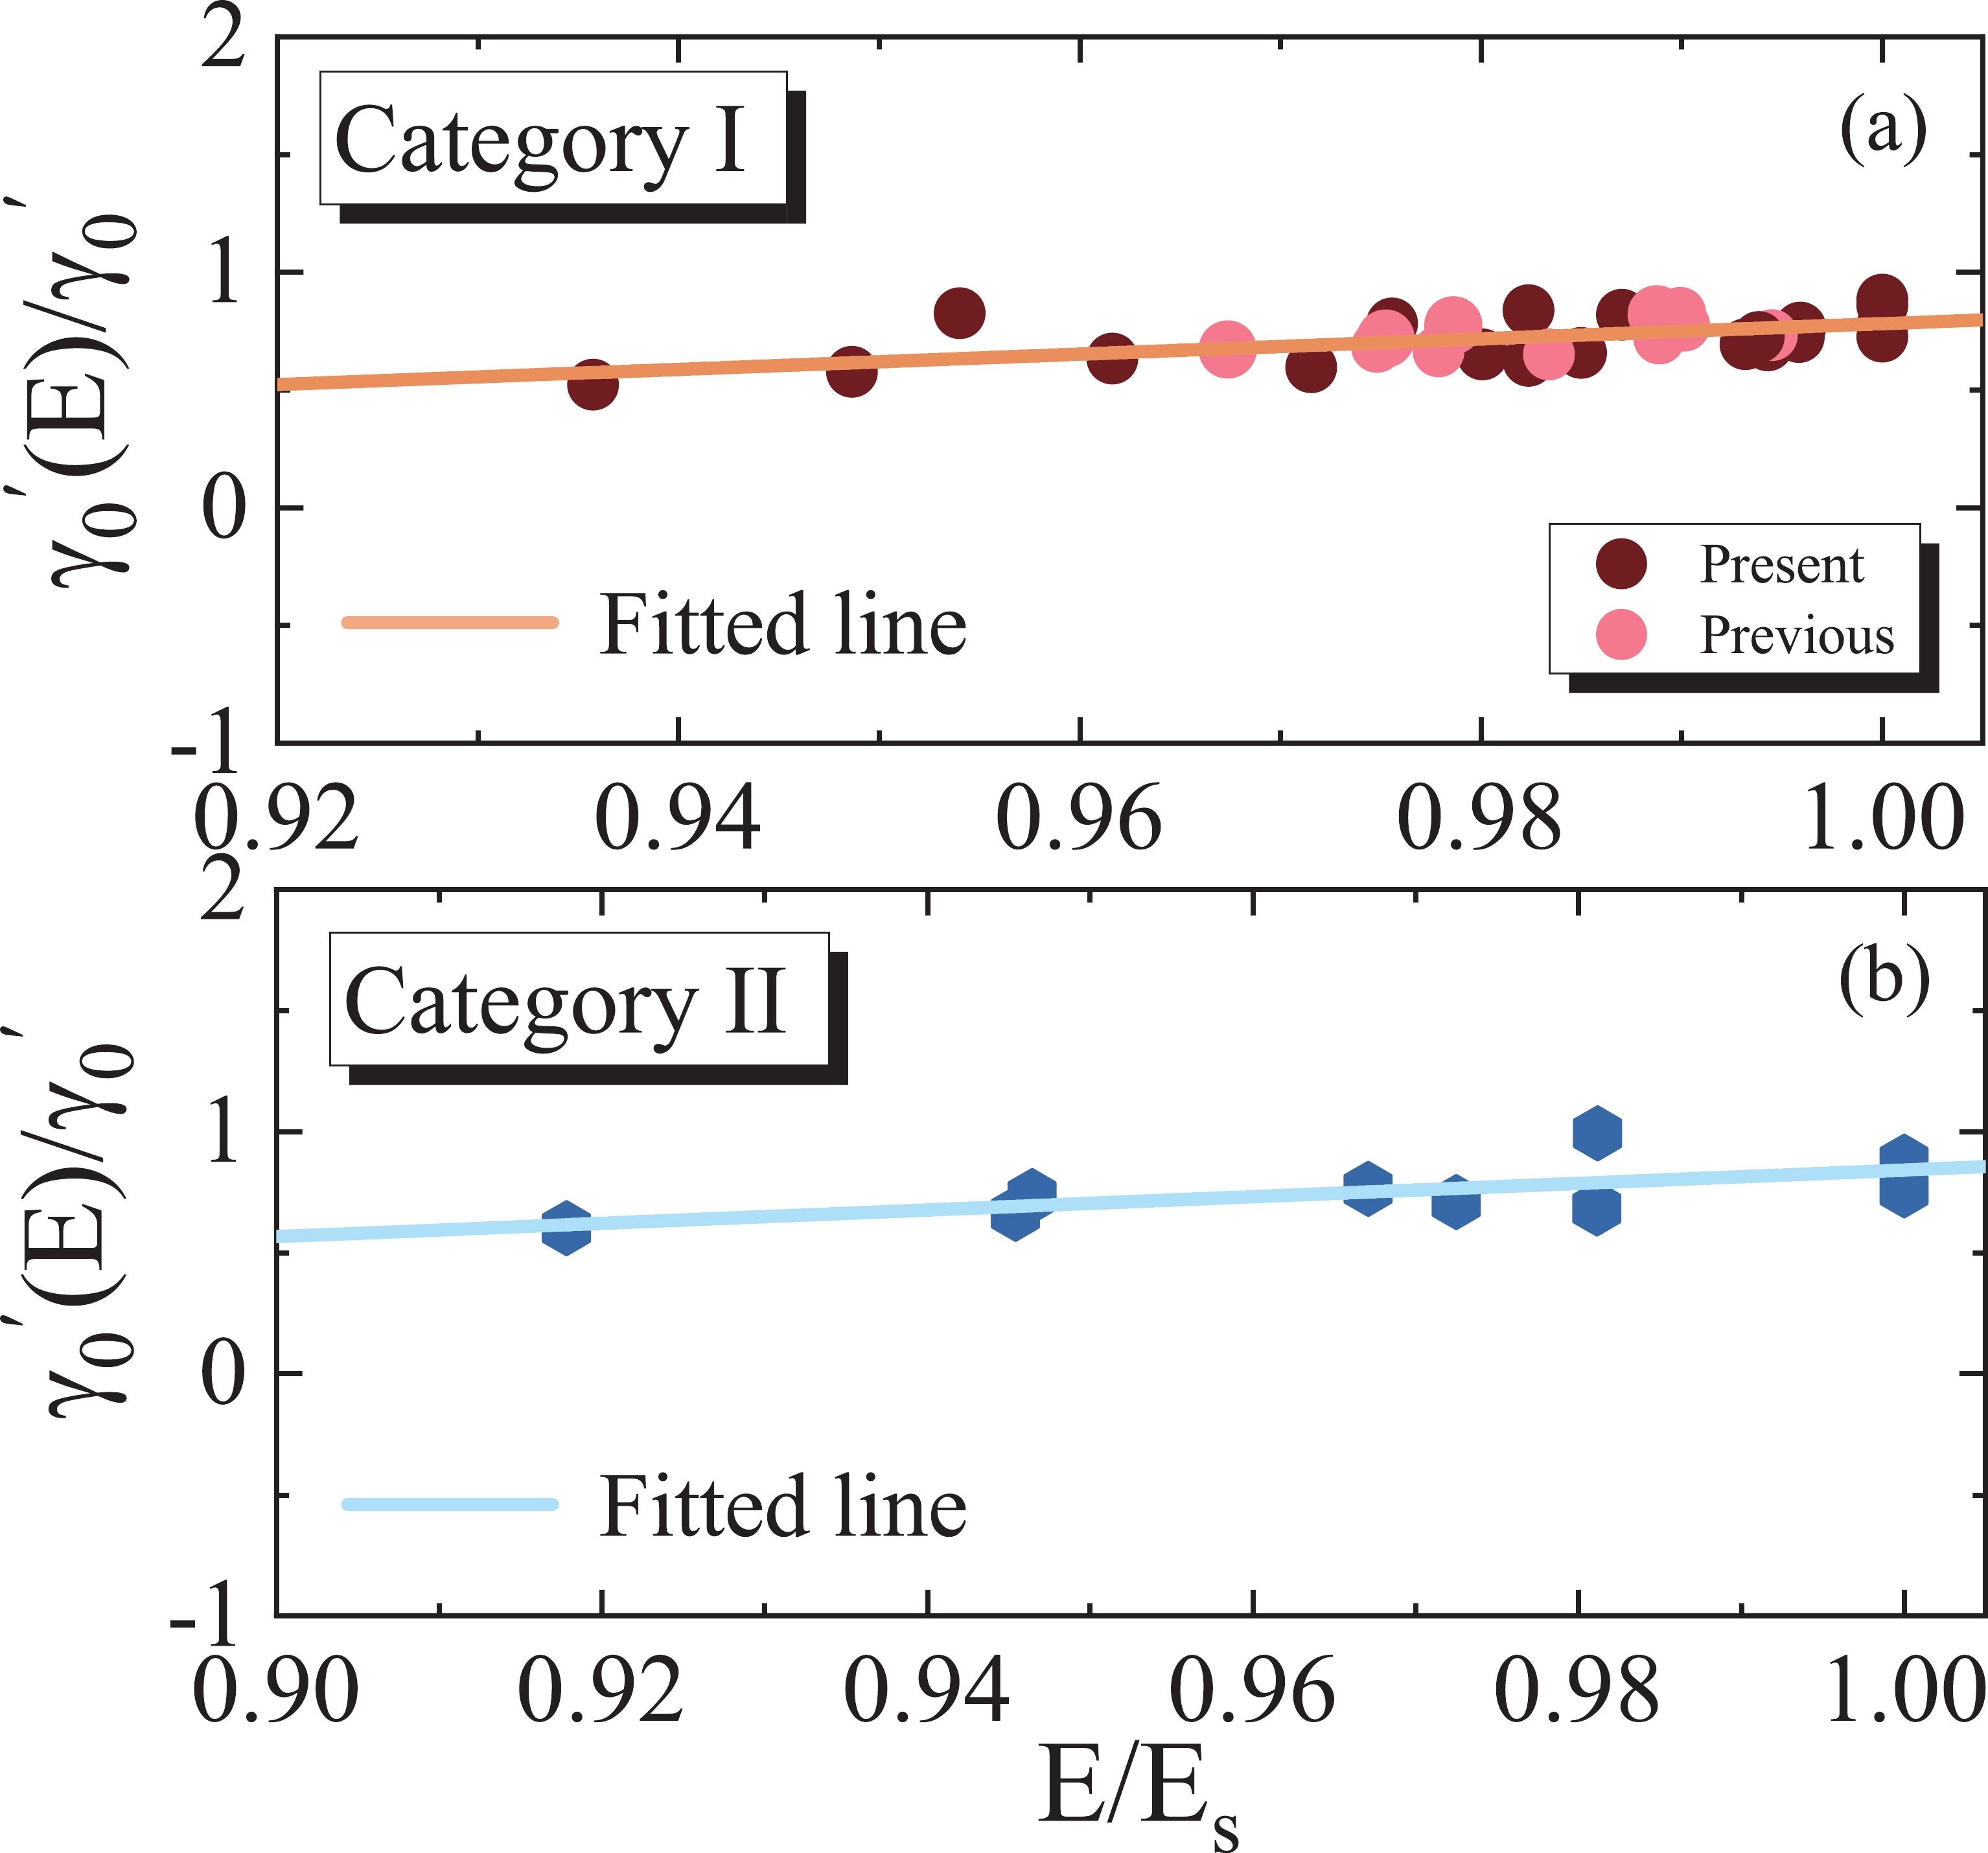
Figure 6. (color online) Variation of the
$ \acute{\gamma_0}(E)/\acute{\gamma_0} $ ratio as a function of$ E/E_s $ within the framework of the Prox. 77 (Mod-2) proximity potential for the different considered fusion systems under categories I (upper panel) and II (lower panel). It should be noted that the calculations are restricted to the energy region$ E\leqslant E_s $ . The data extracted from our previous works [26,27] are also presented for comparison.$ \acute{\gamma_0}(E) = \acute{\gamma_0}\Biggl[a\bigg(\frac{E}{E_s}\bigg)-b\Biggl]\; \; {{\rm{MeV \cdot fm}}}^{-2}, $

(8) where the extracted values of the
$ (a,b) $ constants are equal to (3.2416, 2.4601) and (2.7474, 1.9062) for the fusion systems with negative and positive$ Q $ -values, respectively. The results shown in Fig. 6 reflect a slight difference in the slopes and intercepts of the fitted lines due to the sign of the$ Q $ -values. Considering the above energy-dependent formula in the proximity potential formalism, we suggest a modified form of the surface energy coefficient as defined below:$ \begin{array}{l} \gamma^{\rm{mod}}(T,E) = \left\{\begin{array}{rl}\gamma(T)\biggl[a\bigg(\dfrac{E}{E_s}\bigg)-b\biggl],\; \; \; \; \; {\rm{for}} \; \; {{E}}_{\rm{c.m.}}\leqslant {{E}}_{\rm{s}},\\ \gamma(T),\; \; \; \; \; \; \; \; \; \; \; \; \; \; \; \; \; \; \; \; \; {\rm{for}} \; \; {{E}}_{\rm{c.m.}} > {{E}}_{\rm{s}},\\ \end{array} \right. \end{array} $

(9) where
$ \gamma(T) $ can be calculated using Eq. (5). The above-suggested relation is, in fact, an extension of the calculations detailed in our previous work [26].In Figs. 7 and 8, the experimental data of the representations of the astrophysical
$ S(E) $ factor and logarithmic derivative$ L(E) $ for the heavy-ion fusion reactions studied here are respectively compared with those calculated with different proximity potentials. In the calculations of the astrophysical$ S $ factor representations of the fusion cross sections, we select$ \eta_0 = $ 30.5, 34.0, 47.0, 39.5, 51.0, 68.0, 92.5, 35.5, 39.0, 43.5, 46.0, 59.0, 75.4, and 68.0 for the 11B+197Au, 12C+198Pt, 16O+208Pb, 28Si+64Ni, 28Si+94Mo, 58Ni+58Ni, 60Ni+89Y, 12C+204Pb, 40Ca+40Ca, 48Ca+48Ca, 36S+64Ni, 36S+90Zr, 48Ca+96Zr, and 40Ca+90Zr fusion systems, respectively. We consider$ \eta_0$ = 11.50, 20.0, 22.7, 36.2, and 42.2 for the fusion systems with positive$ Q $ -values, namely 12C+30Si, 24Mg+30Si, 28Si+30Si, 36S+48Ca, and 40Ca+48Ca, respectively. It can be observed from Fig. 7 that the$ S $ factors calculated by the original proximity potential 1977 are consistent with the corresponding experimental data at energies near and above the Coulomb barrier. This model underestimates the lowest-energy points for the considered reactions. In addition, as depicted in Fig. 7, drastic improvements have been achieved by considering the effect of the surface energy coefficient and the thermal effects of hot nuclei in the theoretical results obtained from the Prox. 77 (Mod-1). It can be seen that the clear maximums in the measured$ S $ factors can be reproduced only by the Prox. 77 (Mod-2) calculations. For the logarithmic derivative of the heavy-ion systems of interest, we conclude from an inspection of Fig. 8 that the results provided by the Prox. 77 and Prox. 77 (Mod-1) models are saturated at extremely low incident energies. Conversely, the results calculated with the Prox. 77 (Mod-2) model increase with decreasing incident energy, and a good agreement with the experimental data of$ L(E) $ is obtained in the CC calculations that are based on this modified form of the proximity potential.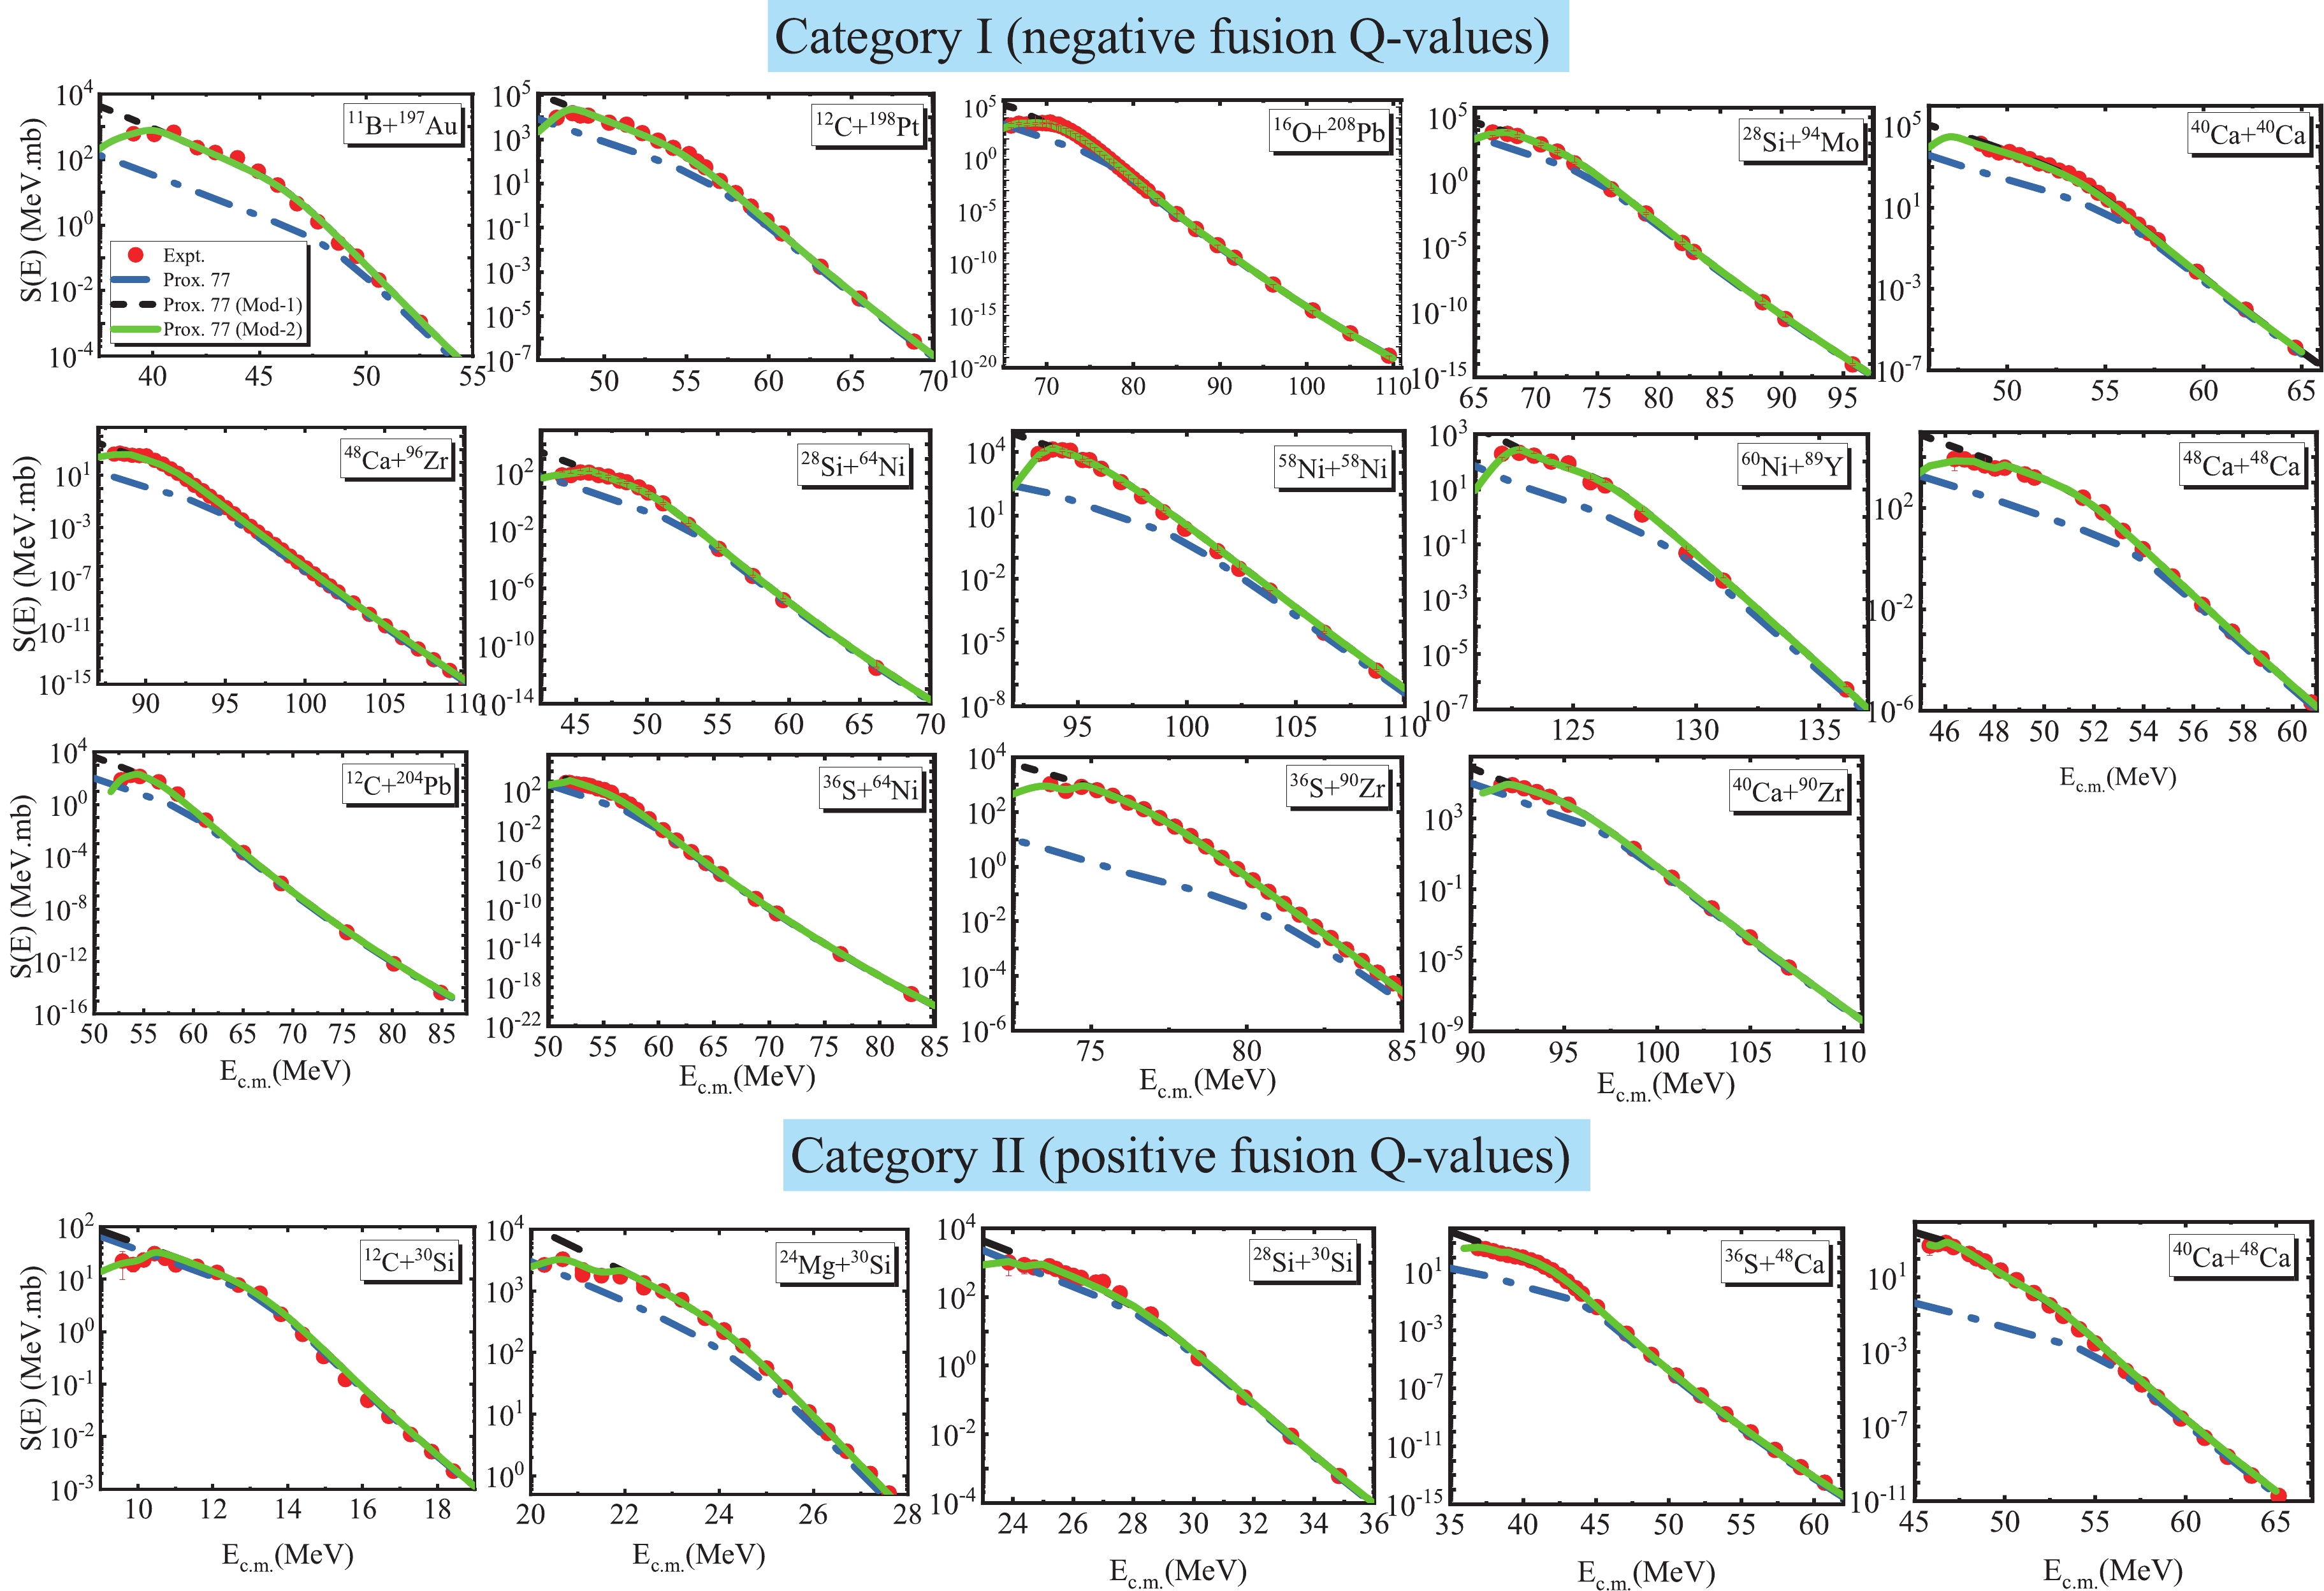
Figure 7. (color online) Same as Fig. 3 except for the astrophysical
$ S(E) $ factor.
Figure 8. (color online) Same as Fig. 3 except for the logarithmic derivative
$ L(E) $ . Prediction for a constant$ S $ factor,$ L_{CS} $ , is presented with the short-dotted (purple) lines. -
It is well known that in the presence of the coupling between the relative motion of the colliding nuclei and their internal structure, the single fusion barrier can be perceived as splitting into a distribution of barrier heights. The concept of the so-called barrier distribution (BD) can be specified as the second derivative of the energy-weighted cross sections [68],
$ B(E) = \frac{{\rm d}^2(E \sigma_{\rm{fus}})}{{\rm d}E^2}\; \; {\rm{mb \cdot MeV}}^{-1}. $

(10) On the basis of the first derivative using the point difference formula, the second derivative of
$ E \sigma_{\rm{fus}} $ can be numerically computed at energy$ (E_1+ 2E_2 + E_3)/4 $ as follows:$\begin{aligned}[b] \frac{{\rm d}^2(E \sigma_{\rm{fus}})}{{\rm d}E^2} =& 2\Biggl[ \frac{(E \sigma_{\rm{fus}})_3-(E \sigma_{\rm{fus}})_2}{E_3-E_2}-\frac{(E \sigma_{\rm{fus}})_2-(E \sigma_{\rm{fus}})_1}{E_2-E_1}\Biggl]\\&\times\frac{1}{(E_3-E_1)}, \end{aligned}$

(11) where
$ (E \sigma_{\rm{fus}})_i $ are appraised at energies$ E_i $ . In the case of equal energy steps$ \Delta E = (E_3-E_2) = (E_2-E_1) $ , it can be observed that the relation reduces to the following form:$ \frac{{\rm d}^2(E \sigma_{\rm{fus}})}{{\rm d}E^2} = \frac{(E \sigma_{\rm{fus}})_3-2(E \sigma_{\rm{fus}})_2+(E \sigma_{\rm{fus}})_1}{(\Delta E)^2}. $

(12) Then, the statistical error
$ \delta_c $ related to the second derivative at energy$ E $ is approximately given by$ \delta_c = \Biggl(\frac{E}{{\Delta E} ^2}\Biggl)\Biggl[ (\delta \sigma_{\rm{fus}})^2_1 - 4(\delta \sigma_{\rm{fus}})^2_2 + (\delta \sigma_{\rm{fus}})^2_3 \Biggl]^{\frac{1}{2}}, $

(13) where
$ (\delta \sigma_{\rm{fus}})_i $ are the errors in the fusion cross sections [69]. Comparisons of the experimental fusion BDs with the calculations based on various versions of the proximity potential formalism are displayed in Fig. 9 for the heavy-ion fusion reactions under categories I and II. While determining the barrier distributions from the theoretical cross sections, we used the same energy step of around$ \Delta E \approx 1 $ MeV. It can be found that the BDs calculated with the original proximity potential 1977 are not in good agreement with the data for the studied reactions. However, it is obvious from Fig. 9 that the best fit to the experimentally observed BD is obtained with the CC calculations for Prox. 77 (Mod-2). This means that the effect of the nuclear surface tension coefficient and also the temperature dependence play an important role in determining the shape of the fusion barrier distribution.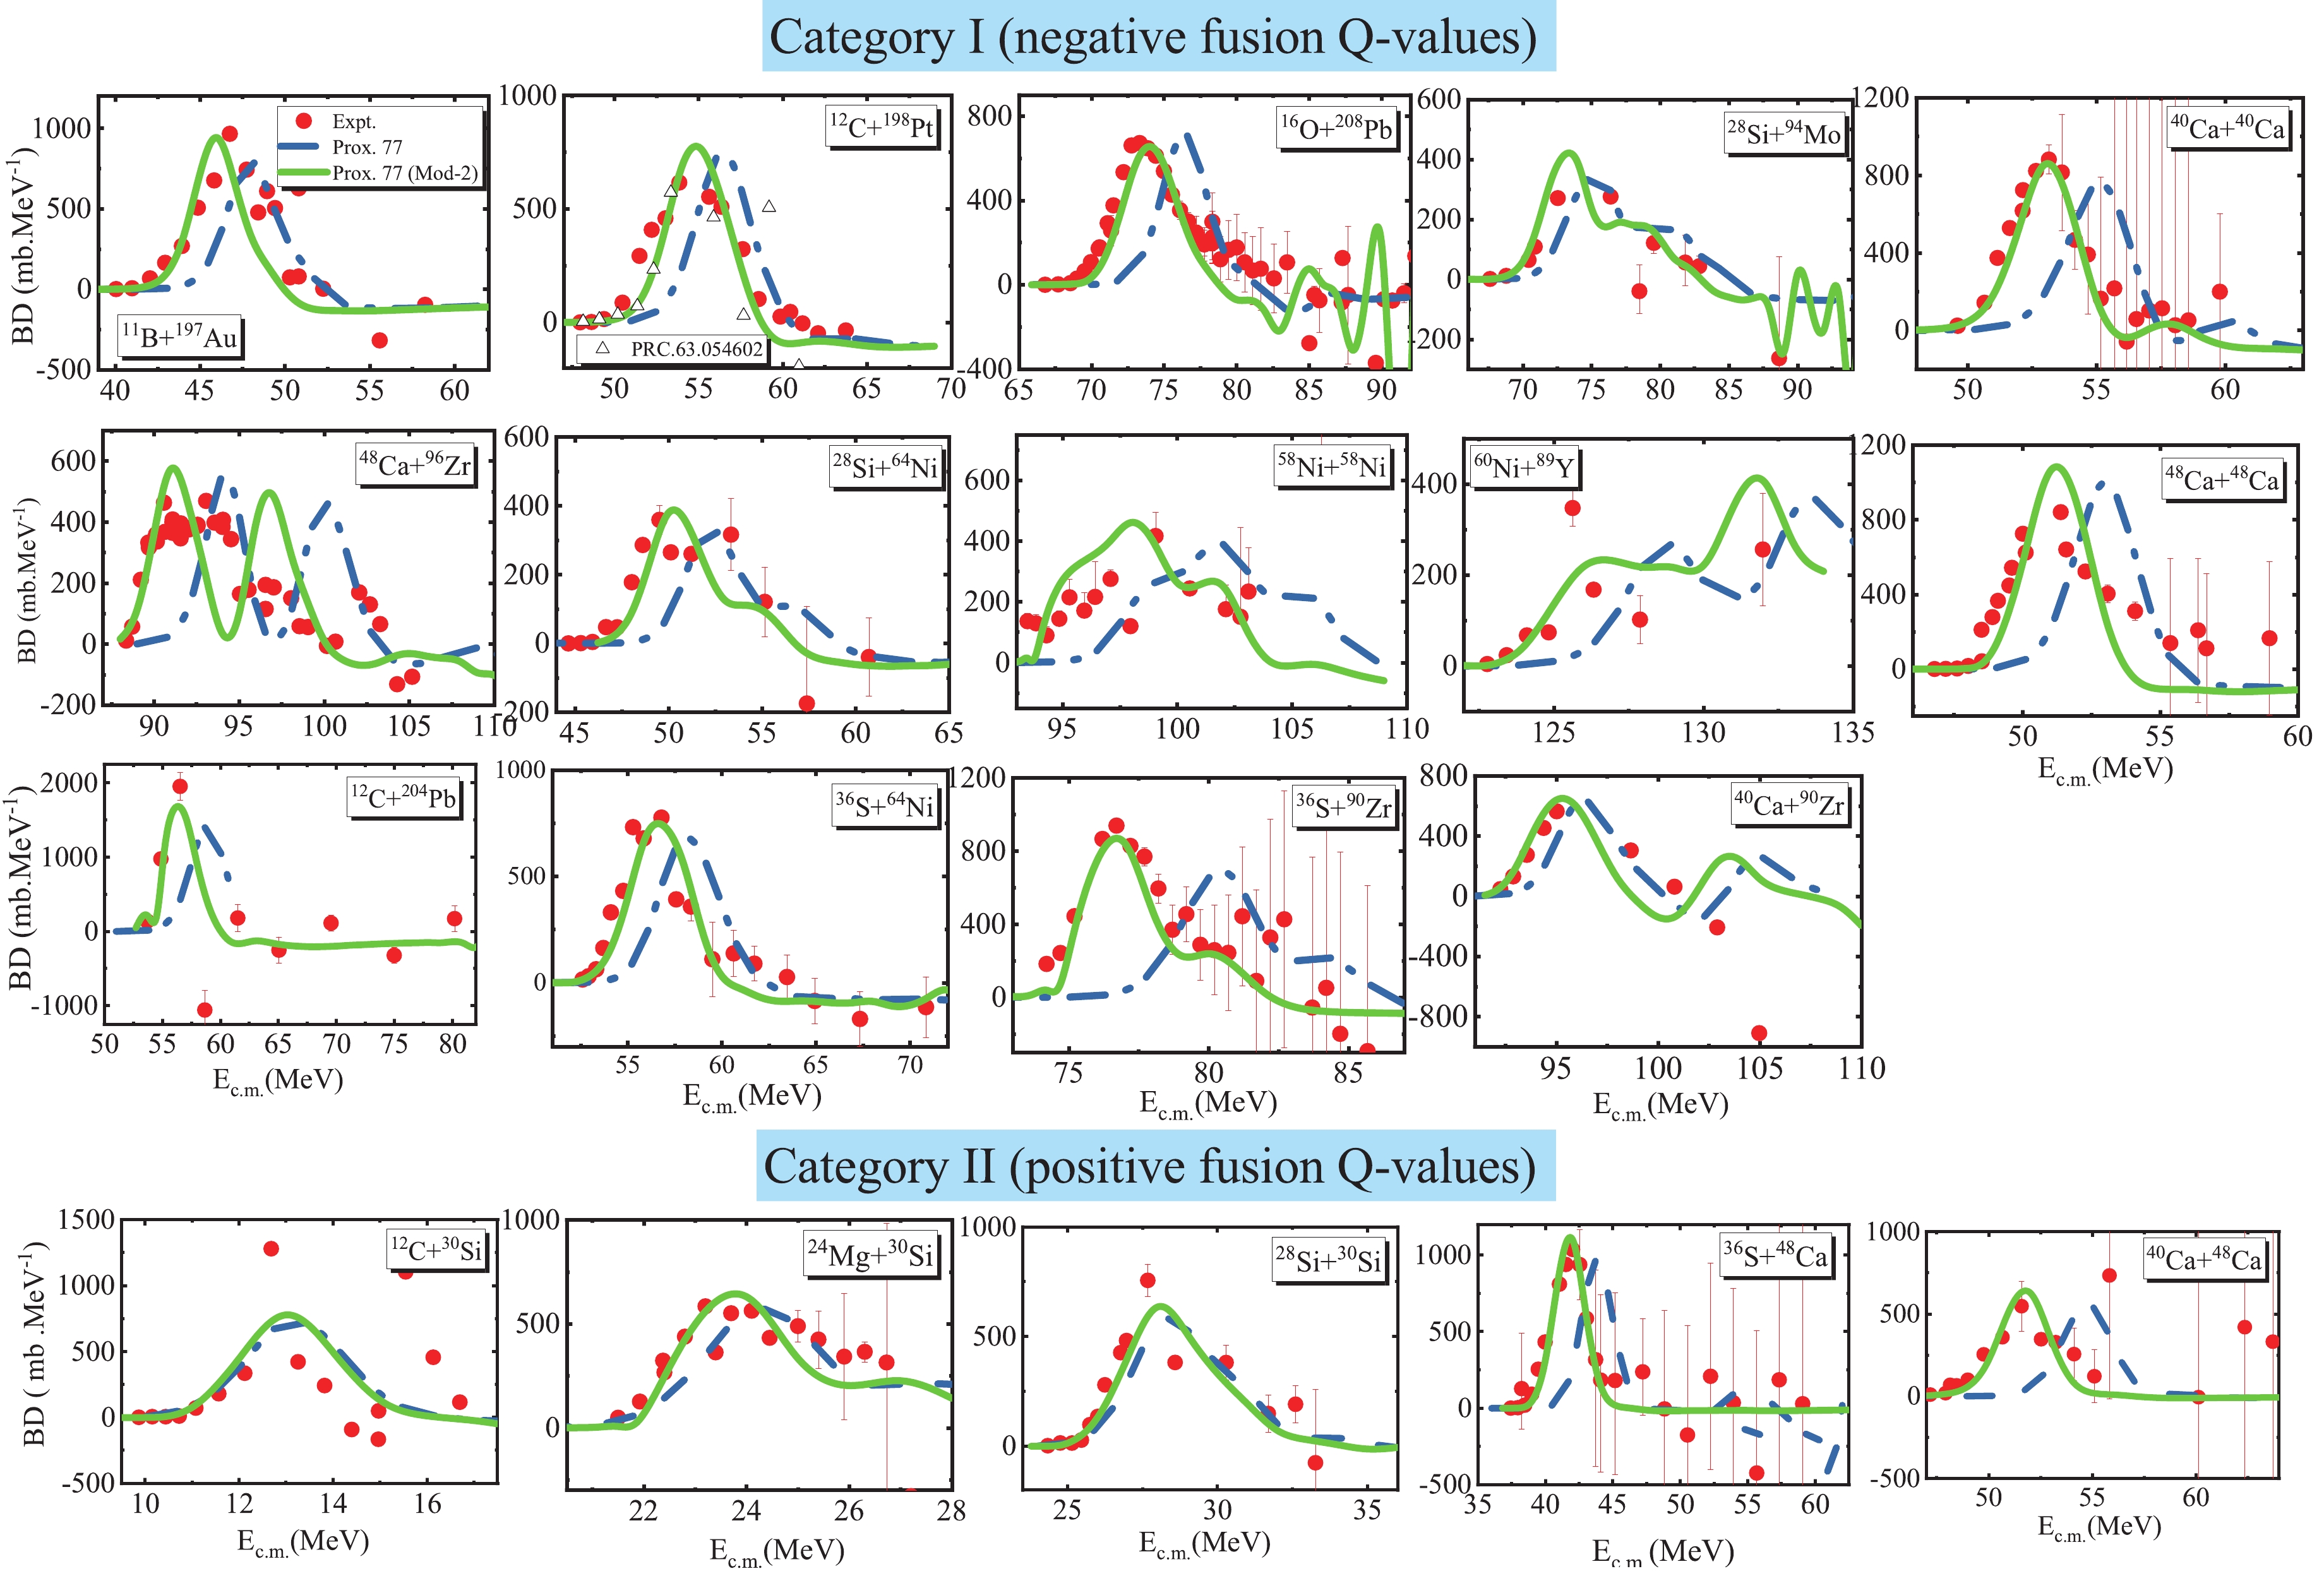
Figure 9. (color online) Comparison between the experimental BDs and those obtained using the CC calculations for various versions of the proximity potential in heavy-ion fusion reactions under categories I (upper panels) and II (lower panels).
-
Using the CC approach and proximity formalism, we systematically analyzed the steep falloff phenomenon of the measured cross sections for fourteen fusion systems with
$ 392\leqslant Z_1Z_2\leqslant 1029 $ under category I (with$ Q<0 $ ) and five fusion systems with$ 84\leqslant Z_1Z_2\leqslant 400 $ under category II (with$ Q>0 $ ). The standard coupled-channels calculations include couplings among the low-lying surface vibration modes$ 2^+ $ and$ 3^- $ of the projectile and target as well as their mutual and multiphonon excitations. In the first step, we calculated the nuclear potentials and fusion cross sections within the framework of the original proximity potential 1977. Our results showed that the deviations of the experimental excitation functions of different colliding systems from the CC calculations using the Prox. 77 potential are large, especially at far sub-barrier energies. For a better description of the fusion cross sections in this energy range, we supplemented the proximity formalism with the effect of the surface energy coefficient$ \gamma $ and temperature dependence. We demonstrated enhanced agreement of our results with the available fusion data when using the Prox. 77 model supplemented with these physical effects. Consequently, the extracted values of the energy at the maximum$ E_s $ are in good agreement with the phenomenological curve for colliding systems with both negative and positive$ Q $ -values. In the energy range corresponding to the steep fall-off phenomenon, we attempted to reproduce the experimental data of the fusion cross sections by considering the energy-dependent potentials via modification of the surface energy constant$ \gamma_0 $ . We conclude that there are excellent agreements between our calculations based on the Prox. 77 (Mod-2) model for the fusion cross sections$ \sigma_{\rm{fus}}(E) $ , astrophysical$ S(E) $ factors, and logarithmic derivatives$ L(E) $ and their corresponding experimental data. In this study, a new energy-dependent form of the nuclear surface tension coefficient,$ \gamma^{\rm{mod}}(T,E) $ , of the proximity formalism was derived by fitting the measurements of the fusion-evaporation excitation functions at low energies. The obtained results revealed that the effect of the sign of the$ Q $ -values on the energy-dependent behavior of the coefficient$ \gamma $ is insignificant. Eventually, it is remarkable that there are some other fusion reactions with either$ Q<0 $ or$ Q>0 $ that need to be considered. However, it can be shown that the required corrections for the interaction potential and therefore the fusion cross sections for these colliding systems are quite different from those observed using the present procedure. For example, our primary analysis based on the original version of the proximity formalism shows that the calculated fusion cross sections for 16O+16O (with$ Q = 16.5415 $ MeV) are overpredicted with respect to the corresponding experimental data in the entire energy range. While, as shown in Fig. 1, we obtained different results for the fusion systems considered in this study. Hence, the proximity approach along with the present corrective effects are unsuitable to address the fusion hindrance phenomenon in these reactions.
Survey of deep sub-barrier heavy-ion fusion hindrance phenomenon forpositive and negative Q-value systems using the proximity-type potential
- Received Date: 2021-04-15
- Available Online: 2021-12-15
Abstract: A systematic survey of the accurate measurements of heavy-ion fusion cross sections at extreme sub-barrier energies is performed using the coupled-channels (CC) theory that is based on the proximity formalism. This work theoretically explores the role of the surface energy coefficient and energy-dependent nucleus-nucleus proximity potential in the mechanism of the fusion hindrance of 14 typical colliding systems with negative


 DownLoad: