


 Abstract
 HTML
HTML Reference
 Related
 PDF
PDF


-
The galactic halo model was proposed in 1964 [1] to describe galactic cosmic ray (CR) propagation. This model assumes that CRs are produced by sources located in the thin galactic disc and are then diffused by the scattering of random magnetic fluctuations in a low-density confinement region extending well beyond the gaseous disc [2]. The theoretical explanation of CR halo formation includes the turbulent cascade of MHD waves [3] and an increase in the Alfvén velocity with height [4]. As a basic characteristic of CR propagation, the halo size is intrinsically connected to many CR-related studies, such as studies of the energy spectrum of CRs [4], the diffuse
$ \gamma $ -ray emission foreground [5], indirect dark matter, or exotic (astro-)physics searches [6-8]. More information about halo size can be found in previous publications [4].Halo size can be independently constrained with the probing of CRs, secondary positrons, radio emissions, and
$ \gamma $ -rays. It is well known that the height of the galactic halo and the normalization of diffusion exhibit a large degeneracy, which is tuned by a secondary-to-primary ratio, such as the boron-to-carbon ratio (B/C) [4, 7, 9-11]. The most widely used probes to solve the degeneracy problem are “CR clocks,” such as radioactive isotopes, for example,$ \rm {}^{10}Be/{}^{9}Be $ [7], as they are very sensitive to the processes occurring in the halo [2, 12, 13]. Nevertheless, past measurements of the isotopic flux ratio in CRs are scarce, limited to low energies, and affected by large uncertainties [14]. Alternatively, elemental ratios (for example Be/B and Al/Mg) can be used to impose constraints on the halo size. With HEAO3 data, a realistic Monte Carlo diffusion model for the propagation of cosmic rays requires a halo height H of 2–3 kpc [15]. With AMS-02 data, a previous study concluded that the measured Be/B ratio provided the most likely value of the halo size at$ \rm H\sim7\; kpc $ , and the minimum value was$ \rm 5\; kpc $ [16]. However, in a different study, estimation with$ \rm {}^{10}Be/{}^{9}Be $ and Be/B provided values of$ \rm H\sim4 $ –$ \rm 5\; kpc $ [8]. As an independent probe, low-energy secondary CR positrons also allow a lower bound to be placed on the halo size (usually at approximately 3–4 kpc), assuming B/C-reduced degeneracy [6, 8, 17-19]. After experiencing energy losses in the diffusion halo, which limits the distance from which positrons reach the earth, they are not very sensitive to the boundaries of the diffusion halo; rather, they are sensitive to the diffusion coefficient. The synchrotron emissions from CR leptons in the MHz to GHz radio band provide information about the magnetized halo height as well [8, 20-22]. They are somewhat less sensitive to large values of the halo size, although upper limits in the range of 10–15 kpc have been derived. In addition, independent halo-thickness constraints can be derived from diffuse$ \rm\gamma $ -rays [23, 24].Unlike charged CRs, the propagation of
$ \rm\gamma $ -rays is mostly unaffected by the interstellar medium (ISM) and galactic magnetic fields (GMFs). Therefore, the emissions retain information about the morphology of the emission region. The Large Area Telescope (LAT) onboard the Fermi$ \rm\gamma $ -ray observatory [25] provides high-quality all-sky$ \rm\gamma $ -ray data from 30 MeV to beyond a few hundred GeV [26]. A global analysis of the diffuse$ \rm\gamma $ -ray emissions measured by the Fermi-LAT satellite found that a larger halo size than usually assumed is required [27, 28]. The$ \rm\gamma $ -ray emissions of large-scale regions are not as sensitive to the spatial morphology of CRs as those from small-size regions, as the former is an integral effect that is likely to eliminate traces. The$ \rm\gamma $ -ray emissivity in peculiar regions with small scales, particularly in the direction perpendicular to the galactic plane, has also been employed to fulfill this task. Halo thickness was constrained to be less than$ \rm 6\; kpc $ with high-velocity clouds (HVCs) and intermediate-velocity clouds (IVCs), which were model-dependent. [29].The above studies of halo size determination using
$ \rm\gamma $ -rays were based on the conventional propagation (CP) model. This model has a simple geometry, and it is assumed that the system has the shape of a cylinder with a radius R and a half height$z_h$ . The diffusion coefficient is constant within the entire halo. Although the CP model reflects the most essential features of the real system, it is challenging to explain various observational phenomena with this model, including the hardening of primary nuclei, the diffuse$ \rm\gamma $ -ray distribution, and CR anisotropy. Instead of a sole propagation halo, in this work, a spatially dependent propagation (SDP) frame was adopted, which effectively reproduced these CR abnormalities to improve estimation of halo thickness. The diffusion volume in the SDP model was divided into two regions: an inner halo (IH:$|z| < \xi z_h$ ) and an outer halo (OH:$|z| > \xi z_h$ ). The size of the IH region is represented by the half-thickness$\xi z_h$ , while that of the OH region is$(1 - \xi)z_h$ . The diffusion coefficient in the IH is dependent on the distribution of the source. We expect the spatial morphology of the CRs in the SDP model to be more sensitive to the diffusion volume than that of the CP model, which could be more easily tested and judged by future observations. In our previous work, with CR anisotropy in the TeV to PeV energy range, we adopted the SDP model to constrain$z_h$ to be less than$ \rm12\; kpc $ [30]. In this work, we studied the halo size based on the SDP model with Fermi-LAT$ \gamma $ -ray observations of HVCs and IVCs. After a recap of the model in Section II, Section III describes the research and results, and Section IV presents the discussion and conclusions. -
While traveling from galactic acceleration sites, CRs may undergo many processes before arriving at Earth. All these physical processes can be described as follows:
$ \begin{aligned}[b]\frac{\partial \psi({\boldsymbol{r}}, p, t)}{\partial t} =& Q({\boldsymbol{r}}, p, t)+\boldsymbol{\nabla} \cdot\left(D_{x x} \boldsymbol{\nabla} \psi-{\boldsymbol{V}}_{c} \psi\right) +\frac{\partial}{\partial p} p^{2} D_{p p} \frac{\partial}{\partial p} \frac{1}{p^{2}} \psi\\&-\frac{\partial}{\partial p}\left[\dot{p} \psi-\frac{p}{3}\left(\boldsymbol{\nabla} \cdot {\boldsymbol{V}}_{c} \psi\right)\right] -\frac{\psi}{\tau_{f}}-\frac{\psi}{\tau_{r}}, \end{aligned} $

(1) where
$\psi({\boldsymbol{r}},p,t)$ is the CR density per unit particle momentum,$Q({\boldsymbol{r}}, p, t)$ is the source distribution,${D_{xx}}$ is the diffusion tensor in physical space, and${D_{pp}}$ the diffusion coefficient in momentum space.${\dot{p}}$ is the momentum loss rate resulting from interactions with the ISM, GMFs, or the interstellar radiation field (ISRF), and${\tau_{\rm f} }$ and${\tau_{\rm r} }$ are the time scales for fragmentation loss and radioactive decay, respectively.${V_{\rm c}}$ is the convection velocity, but convection processes were ignored in this work.The injection spectrum of CR sources is given as follows:
$ Q( p) = q_{0}\; \left\{\begin{array}{ll} \left(\dfrac{p}{ p_{\mathrm{br}}}\right)^{-\nu_{1}} & \text { if }\left(p<p_{\mathrm{br}}\right) \\ \left(\dfrac{p}{p_{\mathrm{br}}}\right)^{-\nu_{2}} \, {\rm e}^{-\frac{p}{ \hat{p}}} & \text { if }\left(p \geqslant p_{\mathrm{br}}\right) \end{array}\right., $

(2) where
$q_0$ is a normalization coefficient,$ \nu_1 $ ($ \nu_2 $ ) is the spectral index below (above)$p_{\mathrm{br}}$ , and${\hat{p}}$ is the cutoff rigidity. The spatial distribution of sources takes the form of an SNR distribution reported previously [31]:$ f(r,z) \propto \left(\frac{r}{r_\odot}\right)^{a}\; {\rm e}^{\left(-b\frac{r -r_\odot}{r_\odot}\right)}\; {\rm e}^{\left(-\frac{|z|}{z_s}\right)}, $

(3) with
$r_\odot = 8.5$ kpc,$z_s = 0.2$ kpc,$ a = 1.69 $ , and$ b = 3.33 $ .The diffusion coefficient,
${ D_{xx}}$ , which depends on the radial distance r, vertical height z, and particle rigidity p, can be written as$ D_{xx}(r, z, p) = D_0 F(r, z) \beta^\eta \left(\frac{p}{p_0} \right)^{\delta_0 F(r, z)} \; , $

(4) where
$D_0$ represents the normalization factor at$p_0$ ;$ \rm\eta $ is the low-energy correction factor of the diffusion coefficient, which was fixed at 0.05;$ \rm\delta_0 $ characterizes the rigidity dependence of the diffusion coefficient; and F(r,z) is anticorrelated with the source density distribution f(r,z). F(r,z) is parameterized as$ F(r,z) = \left\{\begin{array}{*{20}{l}} g(r,z) +\left[1-g(r,z) \right] \left(\dfrac{z}{\xi z_h} \right)^{n} , & |z| \leqslant \xi z_h \\ 1 \; , & |z| > \xi z_h \end{array}\right., $

(5) where n characterizes the sharpness between the inner and outer halos,
$ g(r,z) = \frac{N_m}{1+f(r,z)}, $

(6) and
$N_m$ is a normalized factor. The difference between the CP and SDP models is the value of$F(r,z)$ of the inner halo. For the CP model, it is a constant, while for the SDP model, it is related to the source distribution. Thus, the diffusion coefficients of the CRs with the same rigidity in two different locations are the same for the CP model, while they are related to f(r,z) and$\xi z_h$ for the SDP model.Re-acceleration is modeled as momentum-space diffusion, where the coefficient
$D_{pp}$ is related to the spatial coefficient$D_{xx}$ via the effective$ \rm Alfvénic $ velocity$v_{\rm A}$ , as follows:$ D_{pp}D_{xx} = \frac{4p^{2}v_{\rm A}^{2}}{3\delta(4-\delta^{2})(4-\delta)}, $

(7) where
$\delta = F(r,z)\delta_0$ . More detailed descriptions about the SDP model have been published previously [32-36]. The numerical package DRAGON [37] was used to solve the transport equation. -
We first calculated the
$ \gamma $ -ray emissivity by employing a set of ready-made transport configurations with various halo heights. Because the diffusion properties for different halo sizes could vary, we tuned the propagation parameters based on the secondary-to-primary ratios and calculated the$ \gamma $ -ray emissivity again. -
Propagation parameters used previously [30] were employed to calculate the
$ \rm \gamma $ -ray emissivity. This set of parameters was obtained under the SDP plus local source assumption, which reproduces various anomalies well, such as CR spectrum and CR anisotropy anomalies. The detailed parameters are listed in Table 1. Figure 1 shows the$ \rm\gamma $ -ray emissivities normalized to the value at the Sun's position with this model transport configuration and various halo heights. The gray rectangles [29] represent emissivity scaling factors from the Fermi-LAT, which are the ratios of the$ \gamma $ -ray emissivity ($ \gamma $ -ray emission rate per hydrogen atom) in each region of HVCs and IVCs to the values in the disk in the solar circle, with measured energies between$ \rm 300\; MeV $ and$ \rm 10\; GeV $ . The emissivity of the local gas was assigned to the range from$z = 0\;\rm kpc$ to$ \rm 0.3\; kpc $ (disk). The horizontal widths of the rectangles indicate the lower and upper limits on their distances, and the vertical height in dark gray (light gray) corresponds to the total statistical uncertainties of the emissivity scaling factors. Detailed information about the target regions and their emissivity scaling factors has been reported previously [29].$z_h$ /

kpc$D_0$ /

$\rm 10^{28}\; cm^{2}\; s^{-1}$ 

$N_m$ 

$\rm\delta_{0}$ 

$v_{\rm A}$ /

$\rm\; km\; s^{-1}$ 

SDP+local source $^\ddagger$ 

8.76 0.39 0.65 3.5 CP 5 3.72 0.24 0.46 22 SDP 3.3 3.25 0.25 0.58 6 5 5.04 0.29 0.6 6 9 7.25 0.37 0.65 6 15 10.8 0.40 0.69 6 $^\dagger$ n and

$\xi$ were set to 4 and 0.1, respectively.

$^\ddagger$ This set of parameters was adopted from [30].

Table 1. Propagation parameters
$^\dagger$ .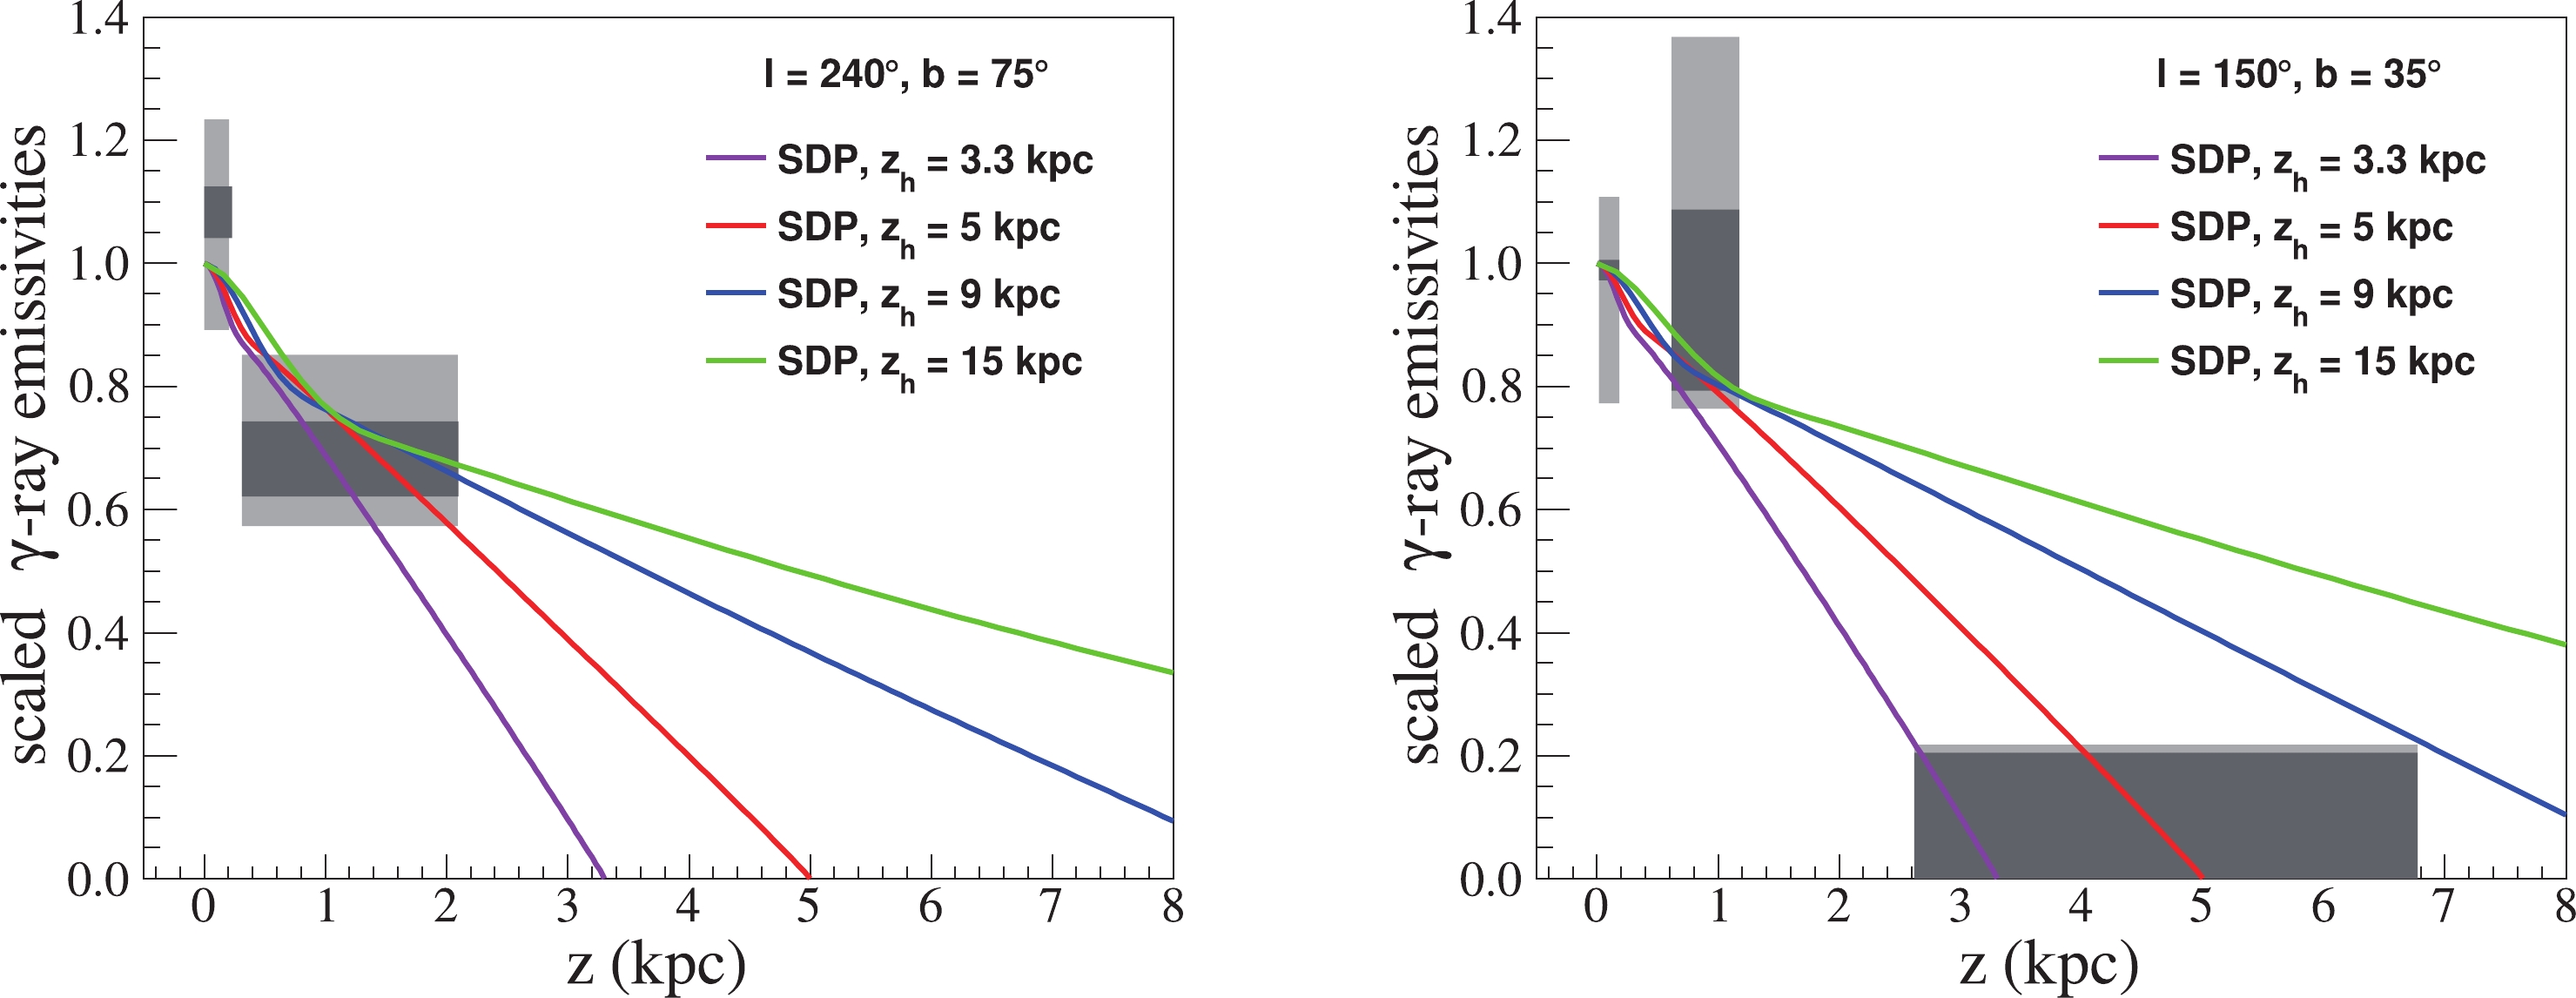
Figure 1. (color online) Model predictions of the
$ \gamma $ -ray emissivity with energies ranging from$ \rm 300\; MeV $ to$ \rm 10\; GeV $ were compared with the data. A set of ready-made transport configurations under the SDP + local source assumption [30] with various halo heights was employed, and the detailed parameters are listed in Table 1. Purple, red, blue, and green lines represent the SDP model with$z_h = 3.3, 5, 9,$ and$ \rm 15\; kpc $ , respectively. Shaded rectangles are the emissivity scaling factors from Fermi-LAT observations [29].There was general agreement between the model curves and measurements in the region of the left panel (
$l = 240^{\circ}, b = 75^{\circ}$ ), which is an extension of the IV Arch. In the region of the right panel ($l = 150^{\circ}, b = 35^{\circ}$ ), together with the emissivity of the low-latitude IVs, upper limits from the HVC in the latitude of$ \rm 2.6 $ –$ \rm 6.8\; kpc $ provide the strongest limit on the value of the halo size. To not exceed the upper limit, the halo size must satisfy$ 3.3\; {\rm kpc} < z_h < 9\; {\rm kpc} $ . Furthermore, the$ \gamma $ -ray emissivity at low latitudes (IH) was nearly the same, regardless of the size of the halo. The differences between the models increased with latitude; thus,$ \gamma $ -ray observations of mid- and high-latitude clouds should be very valuable. -
The results from a set of second-hand fixed propagation parameters and various
$z_h$ values indicated that the relative$ \gamma $ -ray emissivity changed with the thickness of the halo. However, the propagation parameters would change with different halo heights. Below, the results with propagation parameters adjusted by the halo height are presented and used to test the statements above.First, fits of the model prediction to the B/C and
$ \rm {}^{10}Be/{}^{9}Be $ ratios were performed to determine the propagation parameters. The CR spectra and large-scale all-sky$ \rm \gamma $ -rays were used to verify the consistency between the predictions from well-tuned models and observations. Consequently, the tuned transport parameters are listed in Table 1, and diagrams showing the secondary-to-primary ratios, CR spectra, and large-scale all-sky$ \rm \gamma $ -rays are shown in the Appendix. The$ \rm \gamma $ -ray emissivity values were calculated again, and results from the CP model are also shown for comparison.With the propagation parameters listed in Table 1, the
$ \gamma $ -ray emissivity calculation was repeated, and the results are presented in Fig. 2; they are not significantly different from the model curves in Fig. 1. This suggests that the propagation parameters had little effect on the distribution of the$ \rm \gamma $ -ray emissivity for specific$\xi z_h$ . At steady state, propagation is dominated by diffusive processes, and Eq. (1) can be expressed as$ \boldsymbol{\nabla}\; \cdot\; \left( D_{xx}\boldsymbol{\nabla}\psi\right) = \rm-Q $ . Therefore,$ \rm \psi $ is directly proportional to$D_{0}$ . Once the$\xi z_h$ values are selected, the ratio of the fluxes of the$ \rm\gamma $ -rays with the same rigidity in two different locations will be a constant determined by f(r,z).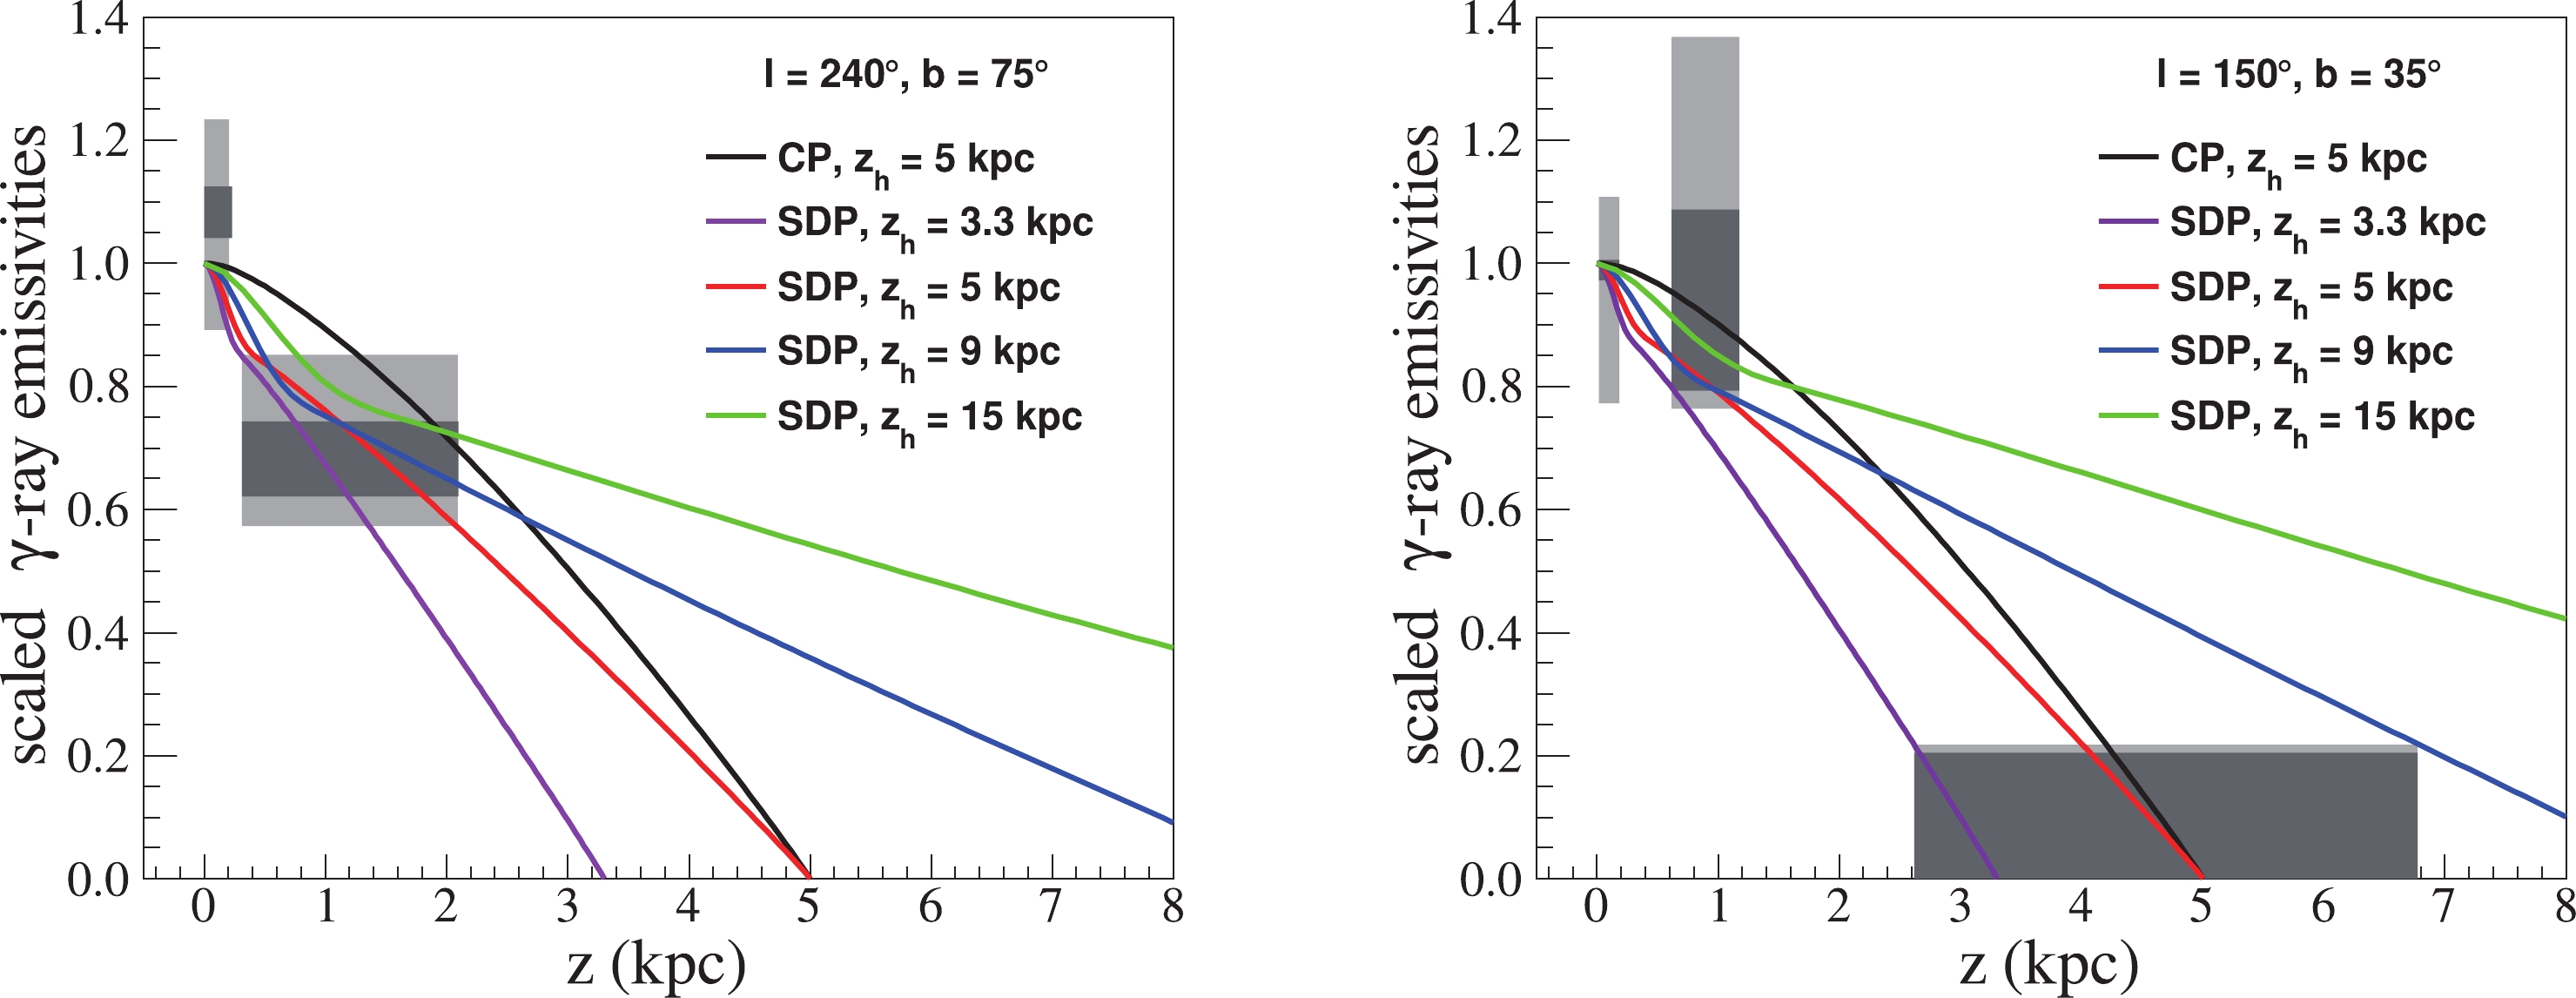
Figure 2. (color online) Model predictions of the
$ \gamma $ -ray emissivity with energies ranging from$ \rm 300\; MeV $ to$ \rm 10\; GeV $ compared with the data. The propagation parameters were properly tuned with various halo heights under the pure SDP model assumptions and are listed in Table 1. Purple, red, blue, and green lines represent the SDP model with$z_h = 3.3, 5, 9,$ and$ \rm 15\; kpc $ , respectively. Black lines are from the CP model. Shaded rectangles are the emissivity scaling factors from Fermi-LAT observations [29]. -
As a tracer of CRs, we would expect that the
$ \gamma $ -ray emissivities would vary with energy based on the SDP model. The left side of Fig. 3 presents the$ \gamma $ -ray emissivities calculated from the SDP and CP models assuming values the of energy between$ \rm 0.3\; GeV $ and$ \rm 1\; TeV $ . With distance from the disk, the curve estimated from the CP model decreases smoothly, and the energy had a slight influence. Increasing the galactocentric radius$z$ to$ \rm 2\; kpc $ resulted in a decrease in the emissivity of up to 40% for the CP model. However, in the SDP model, the emissivity curve had two segments, corresponding to the transition from the IH to the OH. Moreover, as the energies increased, the scaled fluxes close to the disk decreased more rapidly. The decrease in the$ \rm 0.3\; GeV $ $ \gamma $ -ray emissivities within$z < 3\;\rm kpc$ for the SDP model was roughly consistent with that of the CP model. Beyond$ \rm 3\; kpc $ , the SDP model prediction had a slower descent. As the$ \gamma $ -ray energy increased to$ \rm 10\; GeV $ , its emissivity was only approximately half the intensity of that at 3 GeV, with different z values. For even higher energies, the emissivity decreased to less than 10% within 1 kpc.
Figure 3. (color online) Model predictions of the
$ \gamma $ -ray emissivity as a function of the vertical scale from the disk. Solid lines represent the contribution from the SDP model, and dashed lines represent the contribution from the CP model. For the SDP model, the set of parameters for$z_h = 9\; {\rm kpc}$ are adopted here. Left: blue, red, black, and green lines represent photon energies of$ \rm 0.3 $ ,$ \rm 10 $ ,$ \rm 100 $ Gev, and$ \rm 1\; TeV $ , respectively. Right: blue, red, black, and green lines represent$ \gamma $ -ray emissivity from$ \rm 300\; MeV $ to$ \rm 10\; GeV $ at galactocentric radial distances of$ \rm 3, 5, 8.5, $ and$ \rm 15\; kpc $ , respectively. -
To further explore the spatial morphologies of CRs, the right side of Fig. 3 shows the emissivities at various galactocentric radial scales in the disk, ranging from 3 to 15 kpc. The emissivity curve of the CP model underwent a limited change because of the diffusion coefficient being constant throughout the galaxy. It decreased linearly with z from the disk to the boundary of the halo. However, because of the spatially dependent diffusion coefficient, the emissions of the SDP model strongly depended on the galactocentric radius. The larger the galactocentric radius, the slower the decrease in emissivity with z. When the radius increased to a certain extent, the result from the SDP model gradually approached that from the CP model. These properties are highly beneficial for distinguishing them with multi-wavelength observations in the future.
Because of the constant diffusion coefficient, the CP model predicted gentle spatial-morphology changes and limited variations in the various energies and galactocentric radii. In contrast, the emissions of the SDP model strongly depended on the galactocentric radius and energies because of the spatially dependent diffusion coefficient. The propagation parameters were selected as
$z_{h} = 9\; {\rm kpc}$ , but the following discussion should also be valid for other parameters. In addition, the diffusive volume in the SDP model was divided into two regions for this study. The real halo might have more segments, and its characteristics might be more complicated. Observations of mid- and high-latitude clouds in the future can verify or update our model.In summary, based on the SDP model, we performed a study of halo thickness. SDP models with halo heights in the range of
$ \rm 3.3 $ to$ \rm 9\; kpc $ were found to provide good fits to the$ \rm \gamma $ -ray emissivity from high- and intermediate-velocity clouds. The$ \rm \gamma $ -ray emissivity is a good estimator of the halo height. More observations of mid- and high-latitude$ \rm \gamma $ -ray emissivity in the future can advance our understanding of the specific distribution of the CR diffusive halo. -
We thank Kun Fang for helpful discussions about high-velocity clouds.
-
The boron-to-carbon ratio (B/C) has always been considered to be the best quantity to study diffusion properties [38]. The most precise B/C data have been obtained in the rigidity range of 1–103 GV by the AMS-02 experiment [39]. In the left panel of Fig. A1, along with the experimental data, we plot the theoretical predictions calculated with the diffusion model. Lines with different colors represent different values of
$z_h$ . In addition to the secondary-to-primary ratio, the CR isotopic composition of beryllium can also provide unique information on the propagation of CRs in the galaxy. The ratio of$ \rm Be^{10}/Be^{9} $ is shown in the right panel of Fig. A1. Consequently, the tuned propagation parameters are listed in Table 1. Note that in this work,$ \rm \xi $ was fixed at 0.1, as a slight change in its value did not significantly affect the outcome.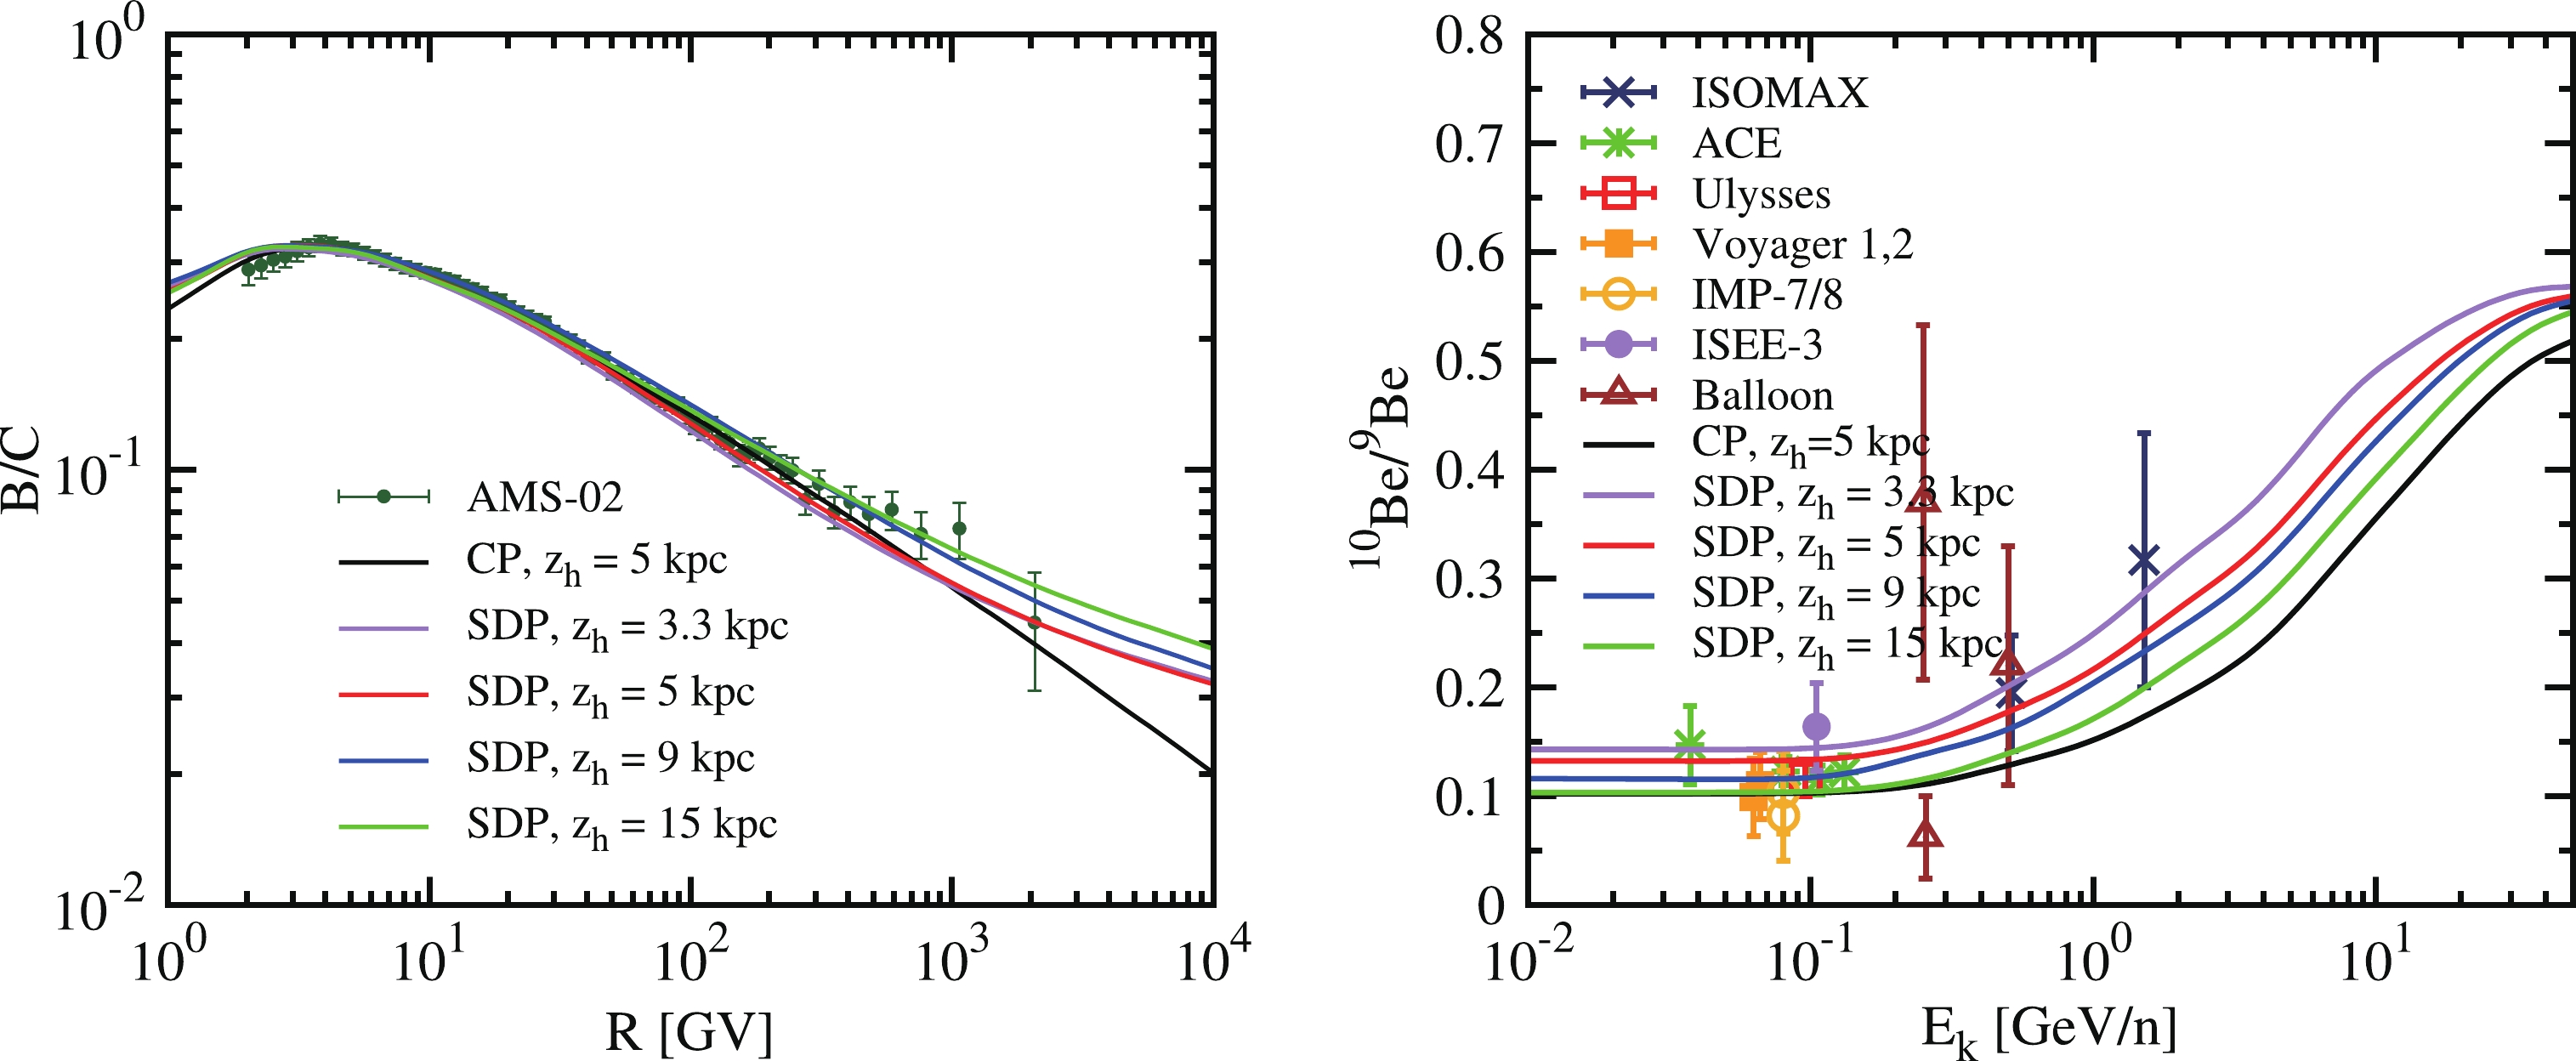
Figure A1. (color online) Boron-to-carbon (B/C) ratio as a function of rigidity (left panel) and
$ \rm Be^{10}/Be^{9} $ ratio as a function of the kinetic energy per nucleon (right panel). B/C data are from AMS02 [39, 40].$ \rm Be^{10}/Be^{9} $ data are from the following experiments: ISOMAX [41], ACE [42], Ulysses-HET [43], Voyager [44], IMP7&8[45], ISEE3-HKH [46], and Ballon [47-49]. -
The left panel of Fig. A2 shows the proton spectrum, to which we paid particular attention because protons provide the dominant contribution to the diffuse
$ \gamma $ -ray spectra. The spectra from the SDP model for various$ \rm\; z_h $ values matched the data well, as did the CP model, except at the high-energy end. Similarly, the helium spectrum is shown in the right panel of Fig. A2. -
Once the parameters of the propagation model were determined, the predicted
$ \gamma $ -ray maps were compared with the Fermi-LAT data. Because large-scale diffuse$ \gamma $ -rays are not as as sensitive as small-sized ones for representing the characteristics of the halo, they were used here to validate the models. Fig. A3 shows the calculated total$ \rm\gamma $ -ray spectrum when the halo size was varied ($z_h$ ). The purple, red, blue, and green lines represent the results from the SDP model at$z_h = 3.3, 5, 9,$ and$ \rm 15\; kpc $ , respectively, and the CP model is plotted as a black line. The model predictions of the$ \gamma $ -ray flux agreed with the data points, considering the uncertainties, except that the flux in the high-energy end was significantly under-predicted by the CP model, which is similar to a previously reported result [28]. It is possible that the predicted emissions from the SDP model in the medium-galactic-latitude (region d) were marginally lower than the observations as a result of faster diffusion with a larger halo size or because of imperfect parameter selection. A comprehensive investigation of the best-fit propagation and injection parameters, based on Bayesian inference, is left for future studies.
Figure A3. (color online) Diffuse
$ \gamma $ -rays in different sky regions. The upper panel of each plot contains several lines: the black line is the CP model, and the purple, red, blue, and green lines represent the SDP model with$z_h = 3.3, 5, 9,$ and$ \rm 15\; kpc $ , respectively. The lower panel of each plot presents the relative differences between the model calculation and data. Data shown as black points are from Fermi-LAT [28]. Propagation parameters are listed in Table 1.
Constraining the cosmic ray propagation halo thickness using Fermi-LAT observations of high-latitude clouds
- Received Date: 2021-03-31
- Available Online: 2021-10-15
Abstract: The diffusive halo is a basic characteristic of cosmic ray (CR) propagation and can advance our understanding of many CR-related phenomena and indirect dark matter. The method used to derive the halo size often has degeneracy problems and is thus affected by large uncertainties. The diffuse


 DownLoad: