-
Clustering is a fascinating phenomenon in hierarchical matter structure [1-5]. In neutron-rich unstable nuclei, the nuclear molecular structure can be formed with various valence-neutron bond configurations [1, 4]. Experimentally, studies on nuclear clustering in unstable nuclei have focused on the light mass area owing to the availability of the radioactive ion beam (see examples in Refs. [6-15]). The cluster structure is often formed and stabilized at the vicinity of the respective cluster-separation threshold [16]. Moreover, experimentally, the cluster structure can be probed via proper nuclear reactions followed by cluster-decay. The reconstruction of the resonant states from the decay fragments, called the invariant mass (IM) method, is sensitive to the states with large cluster partial decay widths. The selection on the decay channel significantly reduces the level density at high excitation energies, in favor of the quantitative extraction of the physics properties of clustering resonant states. Furthermore, the specific decay paths, associated with the structural link between the mother and daughter nucleus, provide a novel method for identifying a particular structure in the mother resonant state [17-19]. This method has been successfully applied in a few recently published experimental studies [11, 14].
Among the predicted and observed cluster states, linear-chain (LC) configuration seems to be the most exotic one that can even lead to the ring structure [1, 20]. The chain structure may originate from the resonances in carbon isotopes, which are built on three
$ \alpha $ -clusters [1, 21]. To date, although the experimental and theoretical investigations do not favor the chain stability in$ ^{12} $ C, they support its existence in$ ^{14} $ C and$ ^{16} $ C, owing to the glue effect of the valence neutrons [11, 13, 14, 22-24]. In our previous measurement, the theoretically proposed$ \sigma $ -bond LC state in$ ^{14} $ C was experimentally validated at 22.5 MeV as the band head of the corresponding molecular rotational band, which decays primarily into the$ \sim 6 $ MeV states of$ ^{10} $ Be [11]. However, other members of this rotational band were not clearly identified owing to the large background and limited detection acceptance for significantly excited states produced in that experiment via a$ ^9 $ Be +$ ^9 $ Be reaction at 45 MeV.In this study, we adopt another reaction system,
$ ^{11} $ B +$ ^7 $ Li at a 55 MeV beam energy, to produce the highly excited states in$ ^{14} $ C. Because$ ^7 $ Li is known to have a strong$ ^3{\rm{H}} + ^4{\rm{He}} $ clustering structure [25], this reaction with the transfer of a triton should be in favor of creating the high lying clustering resonances in$ ^{14}{\rm{C}} $ . -
The experiment was performed at the HI-13 tandem accelerator at the China Institute of Atomic Energy (CIAE) in Beijing. A 55 MeV
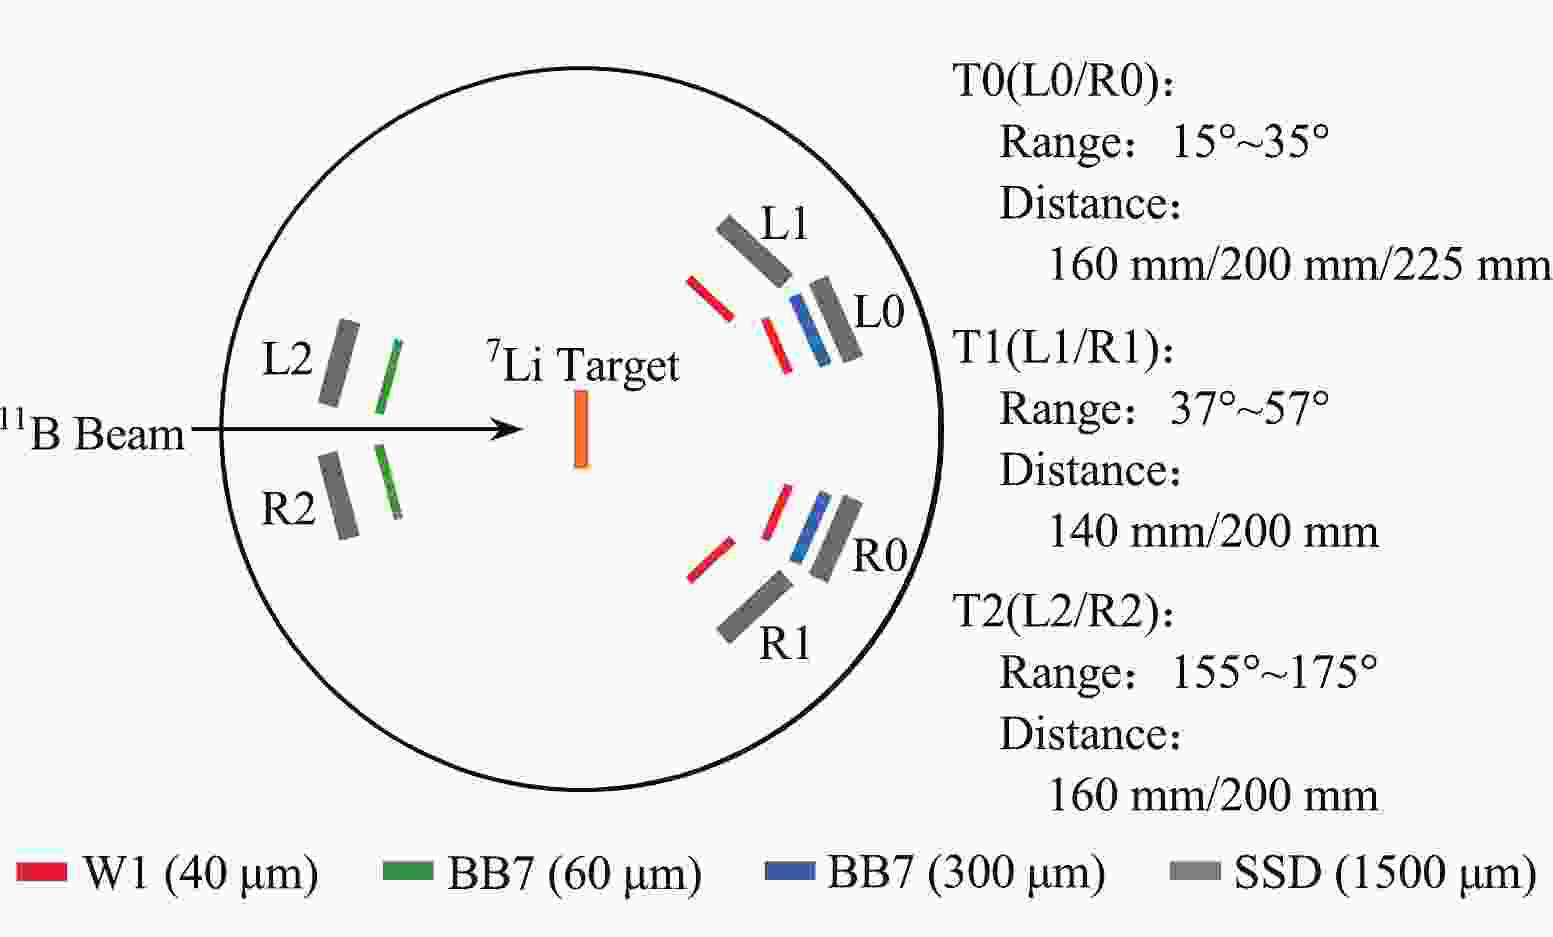
$ ^{11} $ B beam with an intensity of about 8.0 enA was incident on a self-supporting LiF target of 240 μg cm$ ^{-2} $ . A multi-nucleon transfer reaction,$ ^{7} $ Li($ ^{11} $ B,$ ^{14} $ C$ ^{*} $ )$ \alpha $ , with a reaction Q-value of 18.13 MeV was used to populate the high excitation states in$ ^{14} $ C. The recoil$ \alpha $ -particle and two decay fragments,$ ^{10} $ Be +$ \alpha $ , were detected by an array of six charged-particle silicon telescopes, labeled as L0, R0, L1, R1, L2, and R2. These detectors were positioned symmetrically at both sides of the beam axis, as schematically presented in Fig. 1.Two forward telescopes (L0 and R0) were centered at
$ 25^{\circ} $ with respect to the beam direction, with their front faces at a distance of approximately 160 mm from the target center. Each of them comprises two layers of double-sided silicon strip detectors (DSSDs), and one layer of a large-sized silicon detector (SSD). The thicknesses of the two DSSDs were approximately 40 µm (W1) and 300 µm (BB7), respectively, while that of the SSD was 1500 µm (MSX40). The active areas of W1 and BB7 (or MSX40) are 50 mm$ \times $ 50 mm and 64 mm$ \times $ 64 mm, respectively. The front and back sides of the DSSDs are segmented into 16 or 32 strips for W1 and BB7, respectively, which provide optimal two-dimensional position resolutions and allow multi-hit events to be recorded in one single telescope. SSDs were solely utilized to measure the remaining energy of the light particles that may pass through the first two layers of DSSDs. The other two telescope groups (T1 and T2) were used for other purposes [26] and were not relevant to this study.The energy match for all silicon strips in one DSSD has already been achieved by the uniform calibration method described in Ref. [27]. The absolute energy calibration was carried out by adopting an
$ \alpha $ -particle source comprising three energy components (3.18, 5.16 and 5.49 MeV), together with the elastically scattered$ ^9 $ Be from a thin$ ^{197} $ Au target [26]. The typical energy resolutions of the silicon detectors were less than 1.0% for 5.49 MeV$ \alpha $ particles. The position resolutions can be determined by the respective strip widths.The timing signals from the strip detectors were also recorded, which can be used to discard most of the accidentally coincident events. This is important because the strips close to the beam direction must sustain a significantly high signal rate. Excellent particle identification performance, based on
$ \Delta $ E-E method, was achieved for light isotopes after applying proper conditions on the coincidence time, as well as those on the track information across several silicon layers [14]. -
As indicated in the introduction section, reaction Q-value is particularly important in the present work, and it relies on distinguishing the decay paths. For the targeted transfer-decay process,
$ ^7 $ Li($ ^{11} $ B,$ ^{14}{\rm{C^*}}\rightarrow $ $ \alpha +^{10}{\rm{Be}} $ )$ \alpha $ , the$ Q $ -value is defined as$ \begin{aligned}[b] Q=& E_{^{10}{{\rm{Be}}}} + E_{\alpha 1} + E_{\alpha 2} - E_{\rm{beam}} \\ =& M_{^{11}{\rm{B}}} + M_{^{7}{\rm{Li}}} - M_{^{10}{{\rm{Be}}}^*} - 2 \times M_{\alpha} \end{aligned}. $

(1) To maintain the high statistics, we solely measure two decay fragments, the forward emitting
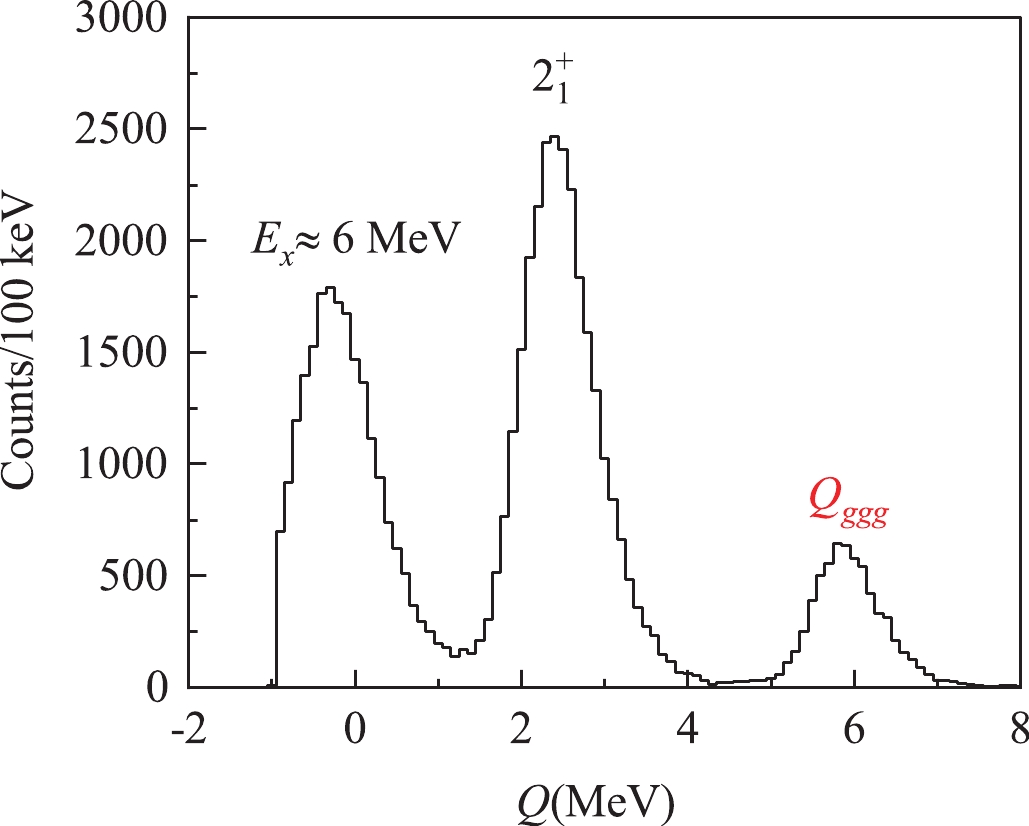
$ ^{10} $ Be and$ \alpha $ , and deduce the energy of the remaining$ \alpha $ -particles according to the momentum-energy conservation of the reaction [11, 13]. In this case, the contamination from the fluoride content in the LiF target may contribute to the Q-value and invariant mass spectra (see below). However, by applying the so-called EP-plot method [28], this contamination can mostly be removed.Figure 2 presents the excellent resolution of the Q-value spectrum, which allows us to clearly discriminate the ground state (
$ Q_{\rm{ggg}} \sim 6\; {\rm{MeV}} $ ) and first excited state ($ E_{\rm{x}} \approx 3.4 \; {\rm{MeV}} $ ,$ 2^+ $ ) of$ ^{10} $ Be. At the excitation energy of approximately 6 MeV ($ Q \sim 0\; {\rm{MeV}} $ ), there are four close-by states in$ ^{10} $ Be, namely 5.958 MeV ($ 2^+_2 $ ), 5.96 MeV ($ 1^- $ ), 6.18 MeV ($ 0^+_2 $ ), and 6.26 MeV ($ 2^- $ ) states, which cannot be separated in the Q-value spectrum and will be labeled as$ \sim 6\; {\rm{MeV}} $ states. We note that the extremely large reaction Q-value of the reaction considered in this study, [$ ^7 $ Li($ ^{11} $ B,$ ^{14}{\rm{C}} $ )$ \alpha $ ,$ Q = 18.13\; {\rm{MeV}} $ ], is crucial in eliminating the background from other reactions with significantly lower Q-values. Furthermore, to achieve the required Q-value resolution, it is important to have optimal energy resolutions for the incident beam and detection system, as well as a small energy loss in the target [11].
Figure 2. (color online) Q-value spectrum for the reaction
$^7$ Li($^{11}$ B,$^{14}{\rm{C^*}}\rightarrow\alpha +^{10}{{\rm{Be}}}$ )$\alpha$ , calculated using the measured$^{10}$ Be and$\alpha$ -particle at forward angles and another$\alpha$ with deduced energy (refer to text for details). The peaks in the spectrum are associated with the ground and excited states (as marked) of the final fragment$^{10}$ Be.Using the two decay fragments measured by L0 and R0 telescopes, namely the
$ ^{10} $ Be and$ \alpha $ -particle, the relative energy (or decay energy) of the resonances in$ ^{14} $ C can be reconstructed according to the standard invariant mass (IM) method [6, 11, 13, 14]. A contamination reaction,$ ^7 $ Li($ ^{11} $ B,$ ^{10}{\rm{Be}} $ )$ ^8{\rm{Be}}\rightarrow 2\alpha $ , might emerge. This reaction possesses the same final mass combination as our targeted reaction and hence cannot be eliminated by the Q-value selection. We verified this assertion by using the two-dimensional Dalitz-plot corresponding to the reconstruction of$ ^{14} $ C and$ ^{8} $ Be. It was determined that the$ ^8 $ Be decay does not significantly affect the$ ^{14} $ C decay owing , most likely, to the angular coverage of the L0(R0) telescope that is not in favor of detecting the recoil$ ^8 $ Be remnants. The excitation-energy (relative energy plus the corresponding separation energy) spectra, conditioned by the Q-value peaks as presented in Fig. 2, can be fitted by continuum backgrounds plus a number of resonance peaks. The continuum backgrounds appear similar to those presented in Fig. 2 of Ref. [11] but with significantly less relative contributions, owing to the actual selection of the reaction channel. In Fig. 3, we plot the spectra with the backgrounds subtracted, to obtain a better illustration of the resonance peaks. Each peak curve in the figure is a convolution of the Breit-Wigner (BW) function with the Gaussian-type energy-resolution function [14]. The energy resolution functions and detection efficiency (acceptance) curves, as a function of the relative energy, were simulated by considering a reasonable angular distribution of the produced$ ^{14} $ C and its decay fragments, as well as the actual detection setup, energy and position resolutions of the detectors, and applied cuts in the data analysis [11, 14]. Because the efficiency curves (Fig. 3) do not significantly affect he number of counts and the width of each peak [14], we did not incorporate them into the BW resonance shape.
Figure 3. (color online) Excitation-energy (relative energy plus the corresponding separation energy) spectra conditioned by the Q-value peaks in Fig. 2 and with the continuum backgrounds subtracted [11]. The peak curves (red-solid lines) are BW functions convoluted by energy resolution functions, obtained by fitting to the experimental spectra. The simulated detection efficiency curves (yellow-dashed lines) are also plotted with an arbitrary unit. The vertical blue-dashed lines are used to guide the eyes for the peak positions of the resonances.
-
In the theoretical work of Baba and Kimura using the improved AMD model [17, 18], the
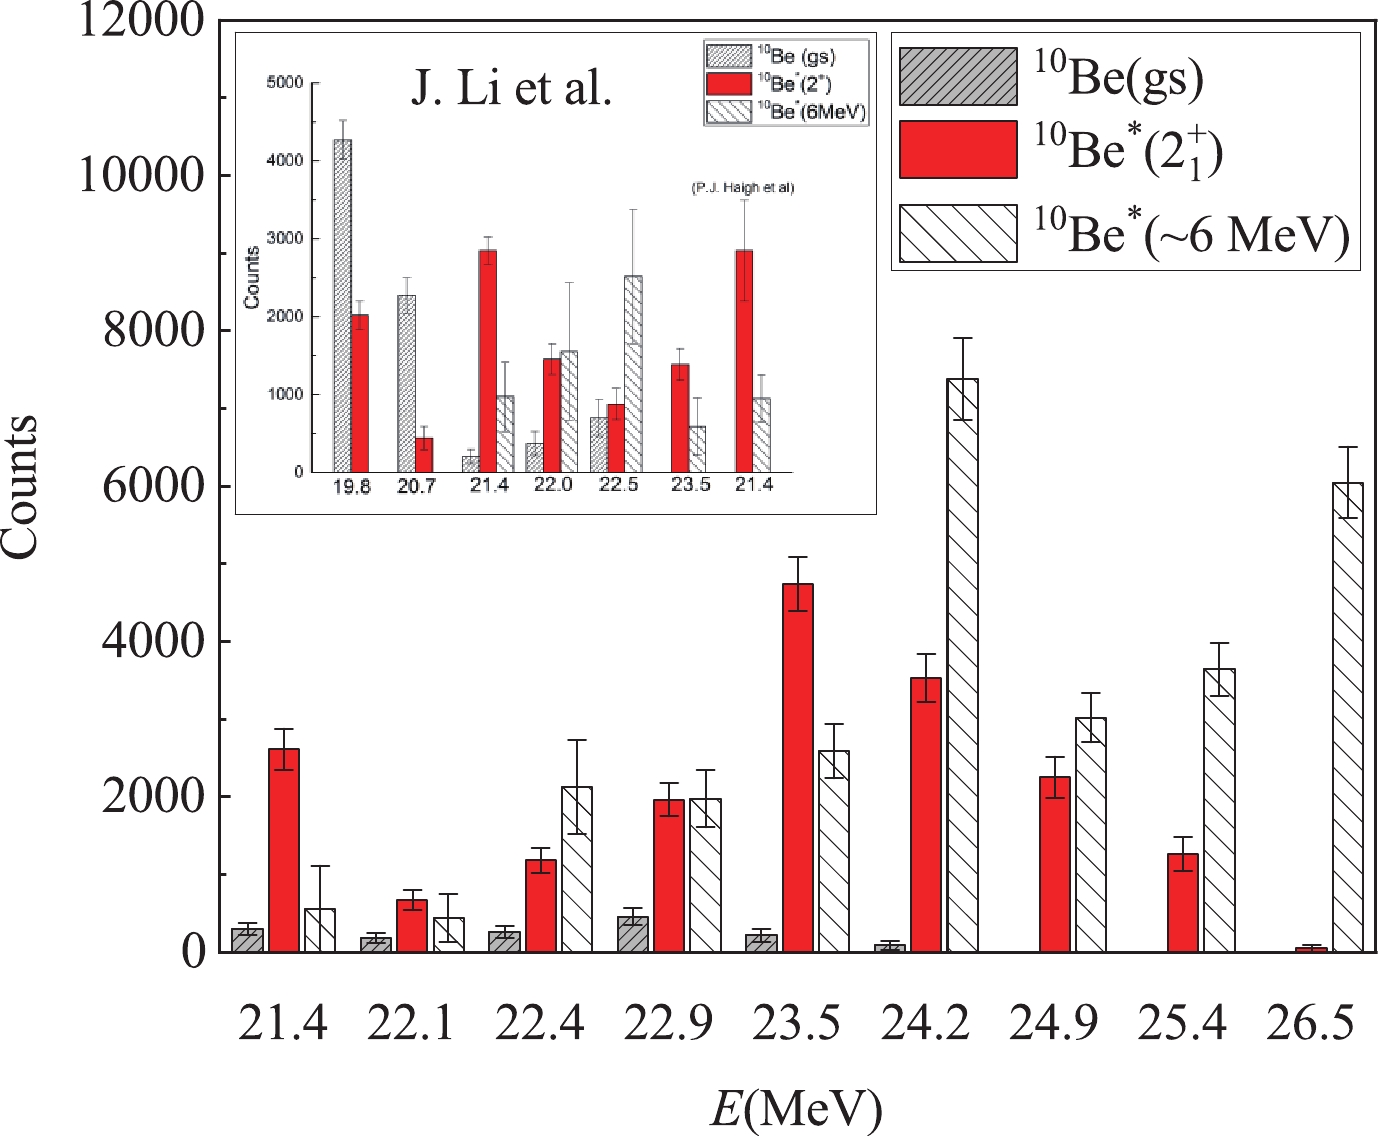
$ \pi $ -bond and$ \sigma $ -bond LC molecular structures were predicted for$ ^{14} $ C, each of which forms a rotational band situated at high excitation energy ranges. Evidently, the decay paths of these two structure configurations are very selective, with the former decaying predominately into the ground and first excited states ($ 2^+ $ , 3.4 MeV) and the latter to the$ \sim $ 6 MeV states of$ ^{10} $ Be. These distinctive decay properties are attributed to the structural link (overlaps) between the mother and daughter nuclei. Because the well-established molecular configuration exists in each of the low lying states of$ ^{10} $ Be [18, 29], they can be adopted as the selective condition in tracing the same type of configuration in the mother resonant state [11]. It should be noted that, among the four states of$ ^{10} $ Be close to$ \sim $ 6 MeV, only the 6.18 MeV ($ 0^+_2 $ ) state possesses a clear$ \sigma $ -bond molecular structure, whereas the other three states ($ 2^+_2, 1^- $ and$ 2^- $ ) have different structures [29]. Therefore, if the mother resonance in$ ^{14} $ C is of the typical$ \sigma $ -bond configuration, the strong decay to the$ \sim $ 6 MeV state basically indicates a transition to the 6.18 MeV ($ 0^+ $ ) state, while the contributions from other three states should be relatively small. The theoretical analysis in Ref. [18] also supports this view. However, if the the mother resonance in$ ^{14} $ C possesses other structures, such as the triangle or$ \pi $ -bond LC structure, it will predominantly decay into the ground and the first excited states of$ ^{10} $ Be. This means that a relatively strong decay to the$ \sim $ 6 MeV states of$ ^{10} $ Be is quite an exclusive signature of the$ \sigma $ -bond configuration in$ ^{14} $ C.From the reconstructed IM spectra in Fig. 3, we can extract the relative decay width for each resonant state, which is proportional to the number of counts in each fitted peak divided by the corresponding detection efficiency [11, 14]. The results covering multiple decay paths are plotted in Fig. 4, with the inset presenting the previously reported numbers [11].

Figure 4. (color online) Relative decay width taken from the number of counts in each resonance peak (Fig. 3) corrected by the corresponding detection efficiency. The grey-upward-hashed, red-filled, and white-downward-hashed bars represent the relative widths for decaying to the ground, 3.4 MeV (
$2^+$ ), and$\sim$ 6 MeV states of$^{10}$ Be, respectively. The inset gives the results from the work of Li et al. [11] with a comparable result of Haigh et al. [30].First, we note that the previously observed resonance at 21.4(2) and 23.5(2) MeV are excellently reproduced by the present work, and they decay predominantly into the first excited state (3.4 MeV,
$ 2^+ $ ) of$ ^{10} $ Be, thereby characterizing the$ \pi $ -bond molecular configuration [18].The 22.4(2) MeV state verifies the feature of the previously reported 22.5 MeV state, with a predominant decay to the
$ \sim6 $ MeV states of$ ^{10} $ Be. Because it is the observed lowest energy resonance with this exotic decay property, as well as the one in excellent agreement with the AMD prediction [17, 18], we may assign it as the band head of the positive-parity$ \sigma $ -bond LC molecular rotational band. Subsequently, in addition to its consistency with the prediction and relatively strong or predominate decay width to the$ \sim6 $ MeV states of$ ^{10} $ Be, the observed 22.9(2) and 24.2(2) MeV resonances can be assigned as the$ 2^+ $ and$ 4^+ $ members of the same band, respectively. It is natural that these observed resonances may incorporate some mixture of configurations other than the$ \sigma $ -bond structure. Therefore, they may exhibit non-negligible relative decay widths to the ground and first excited states of$ ^{10} $ Be, as can be observed from the figure. The actual observations and analysis provide novel and strong evidences for the existence of the exotic$ \sigma $ -bond LC structure in$ ^{14} $ C.In Fig. 4, we can observe more states at 24.9(2) and 25.4(2) MeV that increasingly exhibit stronger relative decay widths to the
$ \sim6 $ MeV states of$ ^{10} $ Be. However, their energy positions do not coincide with the predicted members of the positive-parity$ \sigma $ -bond LC band. Further theoretical investigations are required to determine whether they belong to the negative-parity band or other structure systematics. The 26.5(3) MeV state is also a novel observation with an extreme decay property. However, because the fitted peak, which might comprise multiple narrow states, is significantly wide, further experimental studies are still required. -
A multi-nucleon transfer and cluster decay experiment,
$ ^7 $ Li($ ^{11} $ B,$ ^{14} $ C$ \rightarrow\alpha $ +$ ^{10} $ Be)$ \alpha $ , was carried out at a beam energy of 55 MeV. This reaction channel exhibited an extremely large Q-value in favor of populating the highly excited states of$ ^{14} $ C. The obtained Q-value spectrum exhibited a sufficiently optimal resolution to discriminate the decay paths collected to the ground, first excited (3.4 MeV), and$ \sim $ 6 MeV states of$ ^{10} $ Be. Due to the clear molecular structure in each low lying state of$ ^{10} $ Be and the structural link between the mother and daughter nuclei during the decay process, the selection on the Q-value peaks was beneficial in tracing the molecular structure in$ ^{14} $ C resonances. Particularly, a relatively strong decay to the$ \sim $ 6 MeV states of$ ^{10} $ Be clearly indicated the presence of the$ \sigma $ -bond linear chain configuration in$ ^{14} $ C.A number of resonances in
$ ^{14} $ C were observed in the present experiment, and their relative decay widths associated with various final states in$ ^{10} $ Be were extracted. Some of these states agree substantially well with previous observations, thus validating the effectiveness of the present measurement and analysis. Particularly, the observed 22.4(2) MeV state verifies the$ \sigma $ -bond linear chain feature, which was previously reported by Li et al. [11] and predicted by the AMD calculations [17, 18]. Above this band head state, two novel resonances at 22.9(2) and 24.2(2) MeV were identified, which agree well with predicted$ 2^+ $ and$ 4^+ $ members of the positive-parity$ \sigma $ -bond linear-chain molecular rotational band in$ ^{14} $ C. The present measurement provides novel evidences for the existence of the most exotic clustering chain structure in neutron-rich carbon isotopes.The other three resonances at higher energies of 24.9(2), 25.4(2) and 26.5(3) MeV were also observed to decay predominately into the
$ \sim $ 6 MeV states of$ ^{10} $ Be, thus indicating the presence of strong$ \sigma $ -bond molecular structures as well. However, their ascription in band systematics remains unclear; hence, further theoretical and experimental investigations are required. -
The authors thank the staff of the HI-13 tandem accelerator at CIAE for providing excellent technical and operational support during the experiment.
Novel evidence for the σ-bond linear-chain molecular structure in 14C
- Received Date: 2021-05-01
- Available Online: 2021-08-15
Abstract: A multi-nucleon transfer and cluster decay experiment,


 Abstract
 HTML
HTML Reference
 Related
 PDF
PDF


 DownLoad: