


 Abstract
 HTML
HTML Reference
 Related
 PDF
PDF


-
Entanglement entropy, as a vital tool for measuring the entanglement of quantum systems, has been extensively investigated in recent years. For a strongly coupled quantum system which is in a pure state, the entanglement entropy between the subsystem
$ {\cal{A}} $ and its complement$ \bar{{\cal{A}}} $ is proportional to the area of the boundary$ \partial {\cal{A}} $ to the leading order [1]. In the context of AdS/CFT correspondence [2-4], the Ryu-Takayanagi (RT) formula [5,6] conjectures that the entanglement entropy can be evaluated as the area of the minimal surface$ \gamma_{{\cal{A}}} $ in the bulk which is homologous to the subregion$ {\cal{A}} $ on the boundary. Such a surface is also called the RT surface or its covariant version, the HRT surface [7]. The RT formula has been extensively tested in various holographic models and has been specifically computed for subregions with variety of shapes [8,9]. In particular, its significant role in diagnosing the quantum critical phenomena in strongly coupled systems was disclosed in [10-21].Investigating the dynamical behavior of a system response, such as entanglement entropy, by perturbing the system away from the equilibrium state, is crucial for characterizing the features of a non-equilibrium system. A simple case is the evolution of a system after the quench process, which can be realized by turning on an external source for a short time. As a result, the system is excited and subsequently equilibrates as it evolves. In the holographic duality, the thermal quench can be modeled by the Vaidya-AdS geometry, which describes the collapse of a null shell that initially falls from the boundary of AdS to the bulk, and eventually forms a Schwarzschild-AdS (SAdS) black brane.
The evolution behavior of HEE during the quench process was previously studied in [22-33] for a subregion with the shape of a strip and a disk. For an annular subsystem
$ {\cal{A}} $ , a study of the thermalization process is still lacking. HEE for such a subregion was computed for a static background in [34,35]. It is interesting to note that there exist two possible configurations for the HRT surface. One has a hemi-torus shape [36,37], while the other has a two-disk shape [38-40]. The precise configuration the HRT surface depends on the ratio of the inner radius to the outer radius of the annulus. Moreover, the rate of entanglement growth is captured by the "entanglement tsunami" diagram [25,27], which treats the null shell as a wave entangling the region$ {\cal{A}} $ with the outside. Since the growth rate generally depends on the ratio of the two radii, it is intriguing to study the phase transition of the HRT surface$ \gamma_{\cal{A}} $ , as well as the maximal rate of entanglement growth during the holographic quench process.The paper is organized as follows. In Sec. 2, we introduce the setup for the Vaidya-AdS background. The integral expressions for the area of the HRT surface are derived for a subregion with the shape of an annulus and in the pure AdS background. The mutual information across the annular subsystem
$ {\cal{A}} $ is briefly discussed. In Sec. 3, we present our numerical results for the time dependence of HEE during the quench. In addition, various phase transitions are illustrated in detail. The maximal rate of entanglement growth in each case and the dependence on the thickness of the shell are also discussed. Sec. 4 gives our conclusions and discussion. -
In this section, we first introduce the Vaidya-AdS4 metric, which describes the geometry of a collapsing null shell falling from the boundary to form an SAdS black hole. We then derive the expression for the area functional of an annular domain
$ {\cal{A}} $ , and show two possible configurations of the HRT surface$ \gamma_{\cal{A}} $ in the pure AdS4 case. Finally, we discuss the characteristics of the mutual information across the annulus. -
Consider the Vaidya-AdS4 metric in the Eddington-Finkelstein coordinates
$ {\rm d}s^2 = \frac{1}{z^2}\left(-f(v,z){\rm d}v^2-2{\rm d}v{\rm d}z+{\rm d}r^2+r^2{\rm d}\theta^2\right), $

(1) with
$ f(v,z) = 1-\frac{M}{2}\left(1+\tanh \frac{v}{v_{0}}\right)z^3,\nonumber $

where we have set the AdS radius
$ R_{\rm AdS} = 1 $ .$ M $ characterizes the mass of the black hole, and$ v_0 $ labels the thickness of the null shell. In this setup, the coordinate$ v $ labels the boundary time$ t $ when$ z\rightarrow 0 $ . Moreover, in the limit$ v\rightarrow -\infty $ , the metric in (1) approaches$ f(v,z) = 1, $

which is the AdS metric, while in the limit
$ v\rightarrow \infty $ , the metric approaches$ f(v,z) = 1-M z^3, $

which is just the metric of the SAdS spacetime.
-
On the boundary, consider a subregion
$ {\cal{A}}(r,\theta) $ defined as an annulus with$ r\in\left[R_1,R_2\right] $ and$ \theta\in\left(0,2\pi\right] $ . Due to the spherical symmetry, the region$ {\cal{A}} $ is completely specified by the radius$ r $ . The corresponding area of the extremal surface$ \gamma_{\cal{A}} $ anchored at$ \partial{\cal{A}} $ is described by$ z = z(r), \qquad v = v(r) $

and reads
$ A[\gamma_{\cal{A}}] = 2\pi\int_{R_1}^{R_2}{\rm d}r\frac{r}{z^{2}}\sqrt{1-2v'z'-f(v,z)v'^2}. $

(2) The equations of motion are obtained by extremizing the area functional (2). It should be noted that as the inner radius
$ R_1\rightarrow0 $ , the above area functional reduces to the functional corresponding to a spherical region$ {\cal{A}} $ with radius$ R_2 $ (see [22,25,28]).Before the thermal quench, the geometry is a pure AdS4 spacetime and the corresponding area functional reduces to
$ A[\gamma_{\cal{A}}] = 2\pi\int_{R_1}^{R_2}{\rm d}r\frac{r}{z^{2}}\sqrt{1+z'^2}. $

(3) The phase transition of the HRT surface in the AdS4 spacetime has been investigated in literature. As the ratio of the outer radius
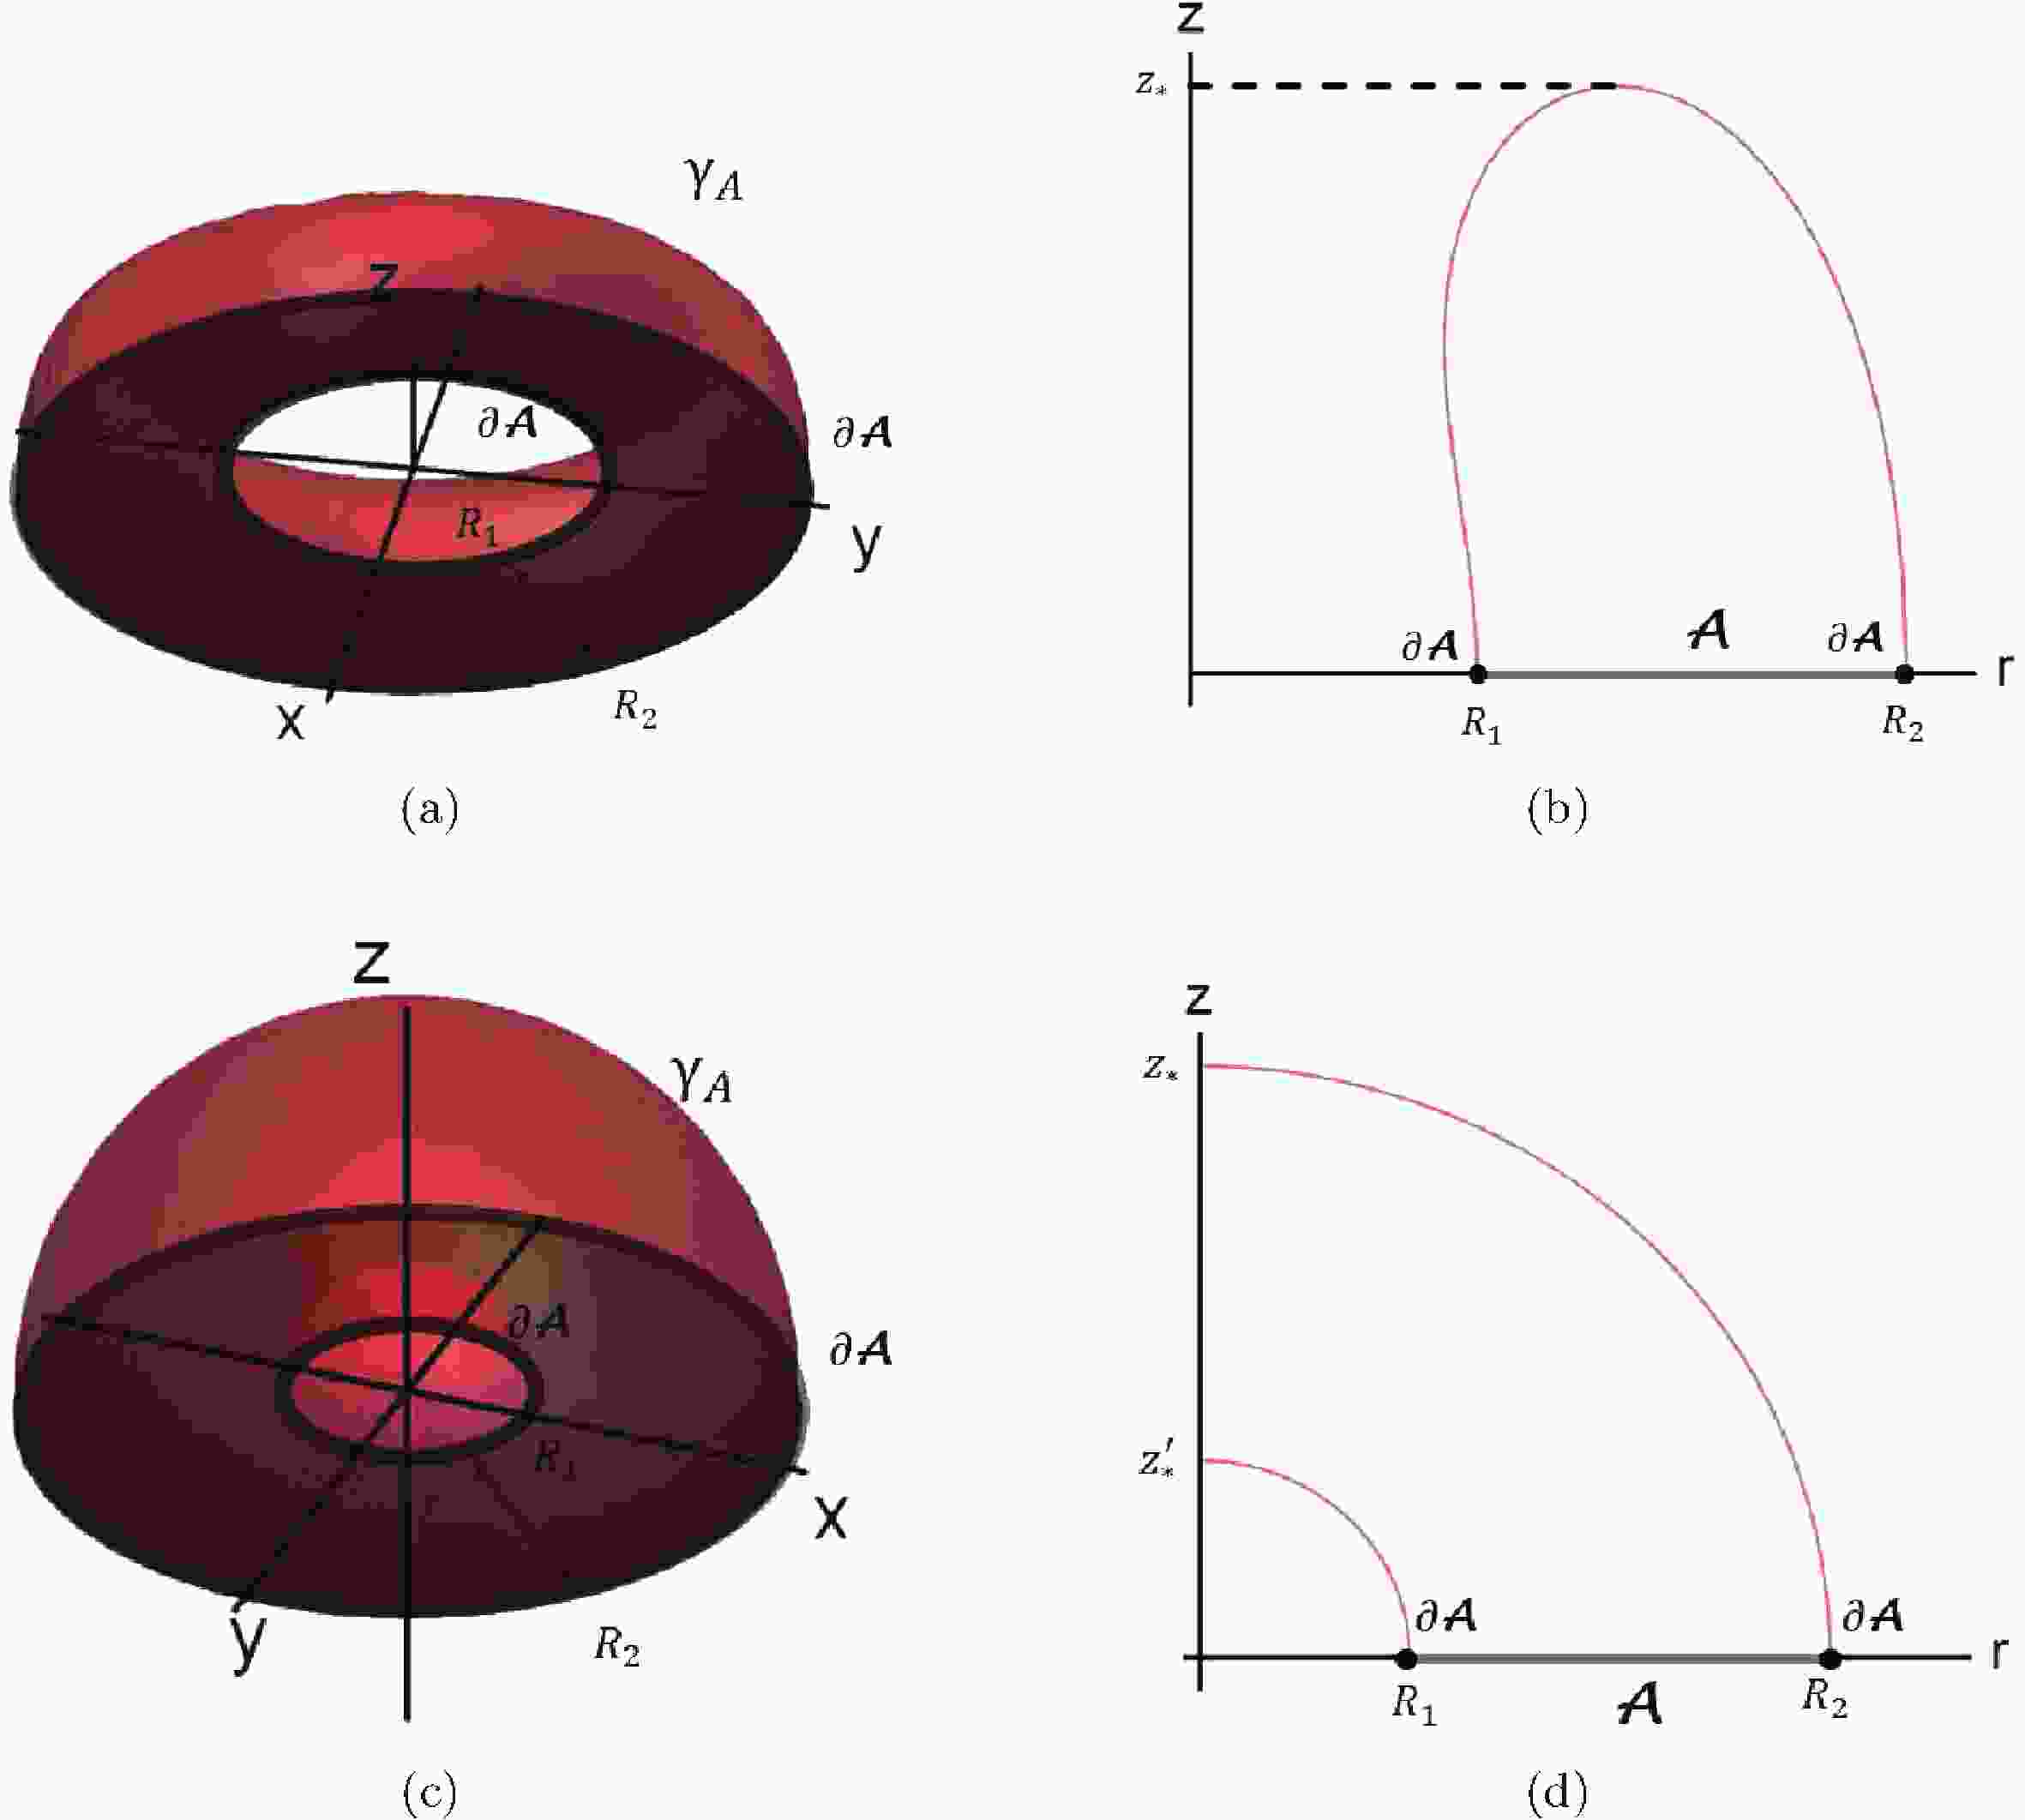
$ R_2 $ to the inner radius$ R_1 $ approaches one, the HRT surface is in the hemi-torus phase (Fig. 1(a)). When the inner radius$ R_1 $ is reduced and the ratio$ R_2/R_1\rightarrow 2.4 $ [35], the configuration of the HRT surface undergoes a phase transition from the hemi-torus to the two-disk phase (Fig. 1(c)).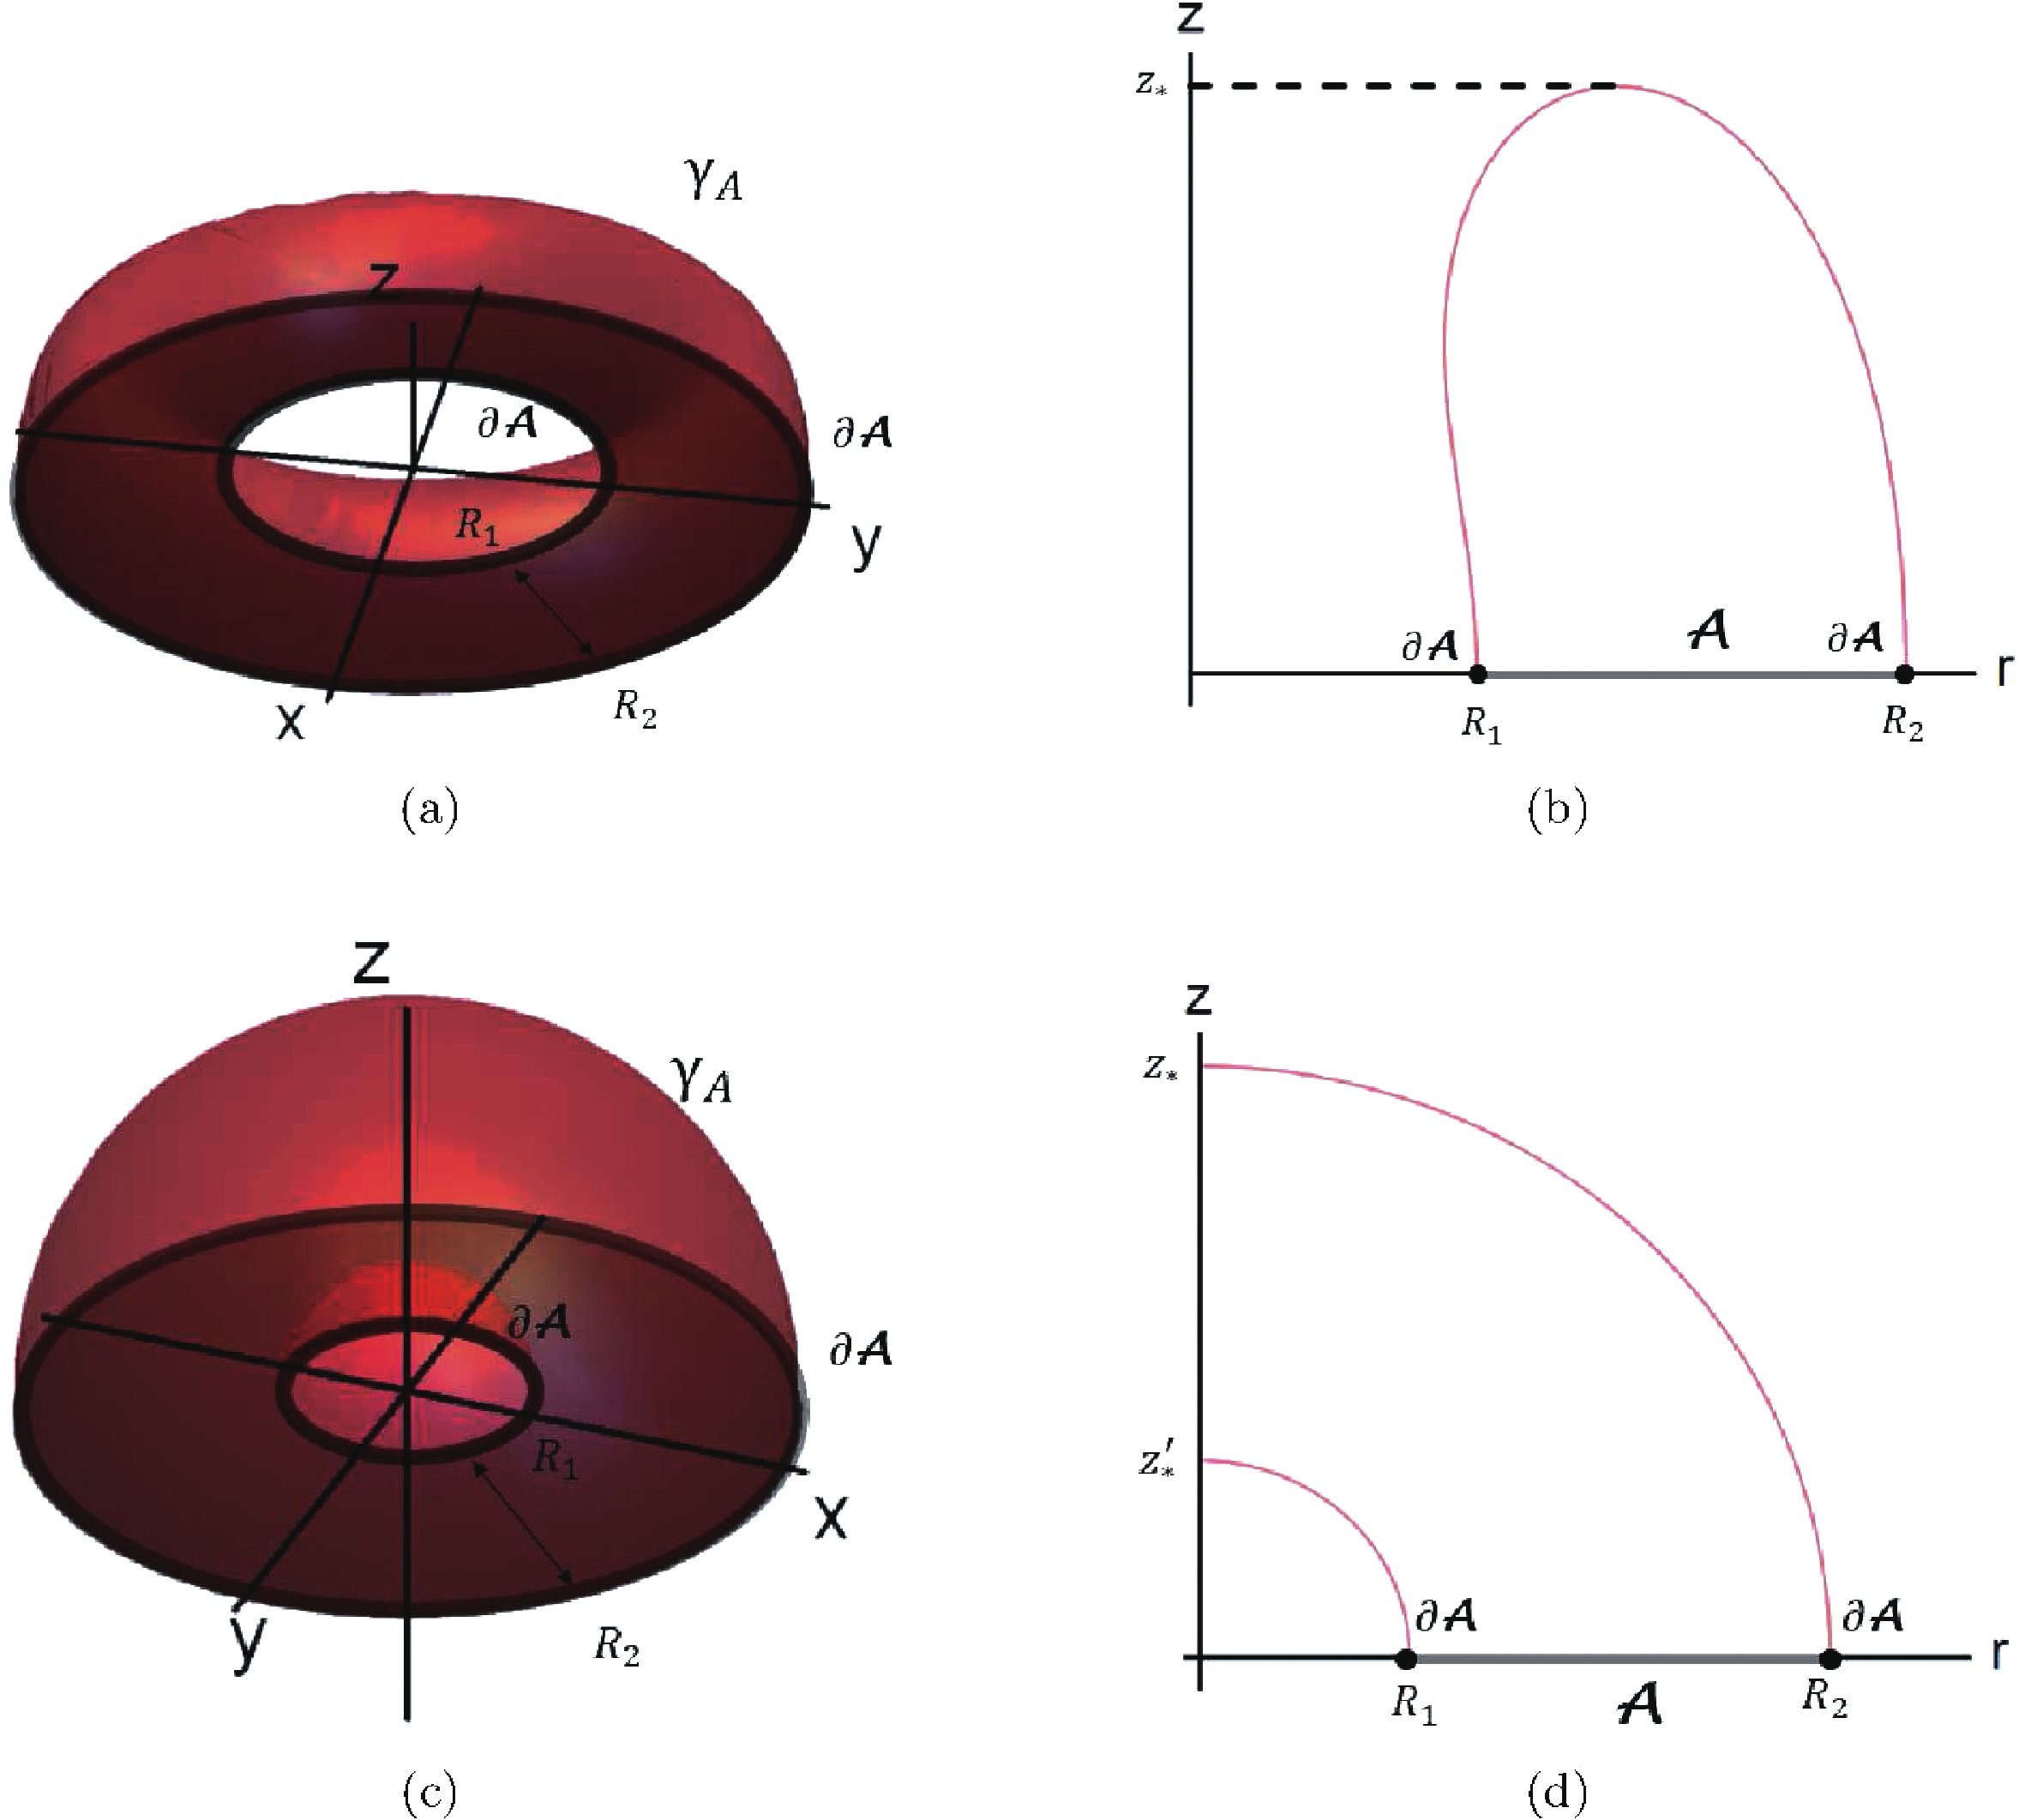
Figure 1. (color online) (a) illustrates the extremal surface
$ \gamma_{\cal{A}} $ with the hemi-torus shape. (b) is its cross-section after suppressing the$ \theta $ direction. (c) illustrates the extremal surface$ \gamma_{\cal{A}} $ with the two-disk shape, and (d) is its cross-section after suppressing the$ \theta $ direction. -
Mutual information between two disjoint subsystems
$ B_1 $ and$ B_2 $ is defined as$ I(B_1 ; B_2) \equiv S(B_1)+S(B_2)-S(B_1 \cup B_2) \geqslant 0. $

(4) Specifically, for an annular subregion
$ {\cal{A}} $ of the boundary, we take$ {\cal{B}}_1 $ and$ {\cal{B}}_2 $ as two disjoints subsystems, located in$ r\leqslant R_1 $ and$ r\geqslant R_2 $ respectively, as shown in Fig. 2(a).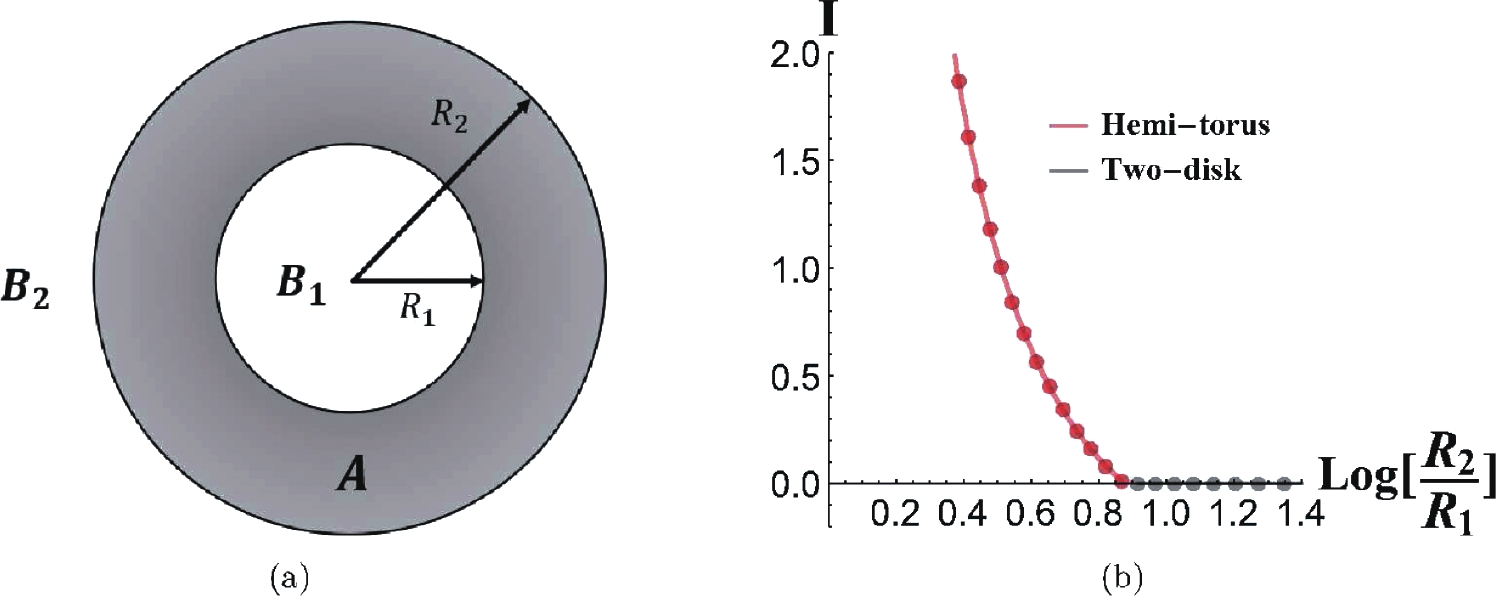
Figure 2. (color online) In (a),
$ {\cal{A}} $ represents the subsystem we investigate, while$ {\cal{B}}_1 $ and$ {\cal{B}}_2 $ are two disjoint subsystems separated by$ {\cal{A}} $ . In (b), the holographic mutual information$ I $ between$ {\cal{B}}_1 $ and$ {\cal{B}}_2 $ is plotted for different ratios of the radii$ R_1 $ and$ R_2 $ in the AdS4 background. The phase transition occurs at$ R_2/R_1\approx2.4 .$ In the holographic setup, when the inner radius
$ R_1 $ is reduced while$ R_2 $ is fixed, the mutual information between$ {\cal{B}}_1 $ and$ {\cal{B}}_2 $ decreases monotonically to zero, which is consistent with the results in [8,34,35]. Furthermore, the HRT surface$ \gamma_{\cal{A}} $ , corresponding to the annulus$ {\cal{A}} $ , is in the hemi-torus phase for$ I({\cal{B}}_1;{\cal{B}}_2)>0 $ , while it is in the two-disk phase for$ I({\cal{B}}_1;{\cal{B}}_2) = 0 $ , as shown in Fig. 2(b).For a general quantum system, mutual information measures the entanglement and correlations between the subsystems, and gives an upper bound for the correlations. Therefore, for a system in a pure state, if the HRT surface
$ {\cal{A}} $ is in the hemi-torus phase, the d.o.f. of the subsystem$ {\cal{B}}_1 $ are generally entangled with those of the subsystem$ {\cal{B}}_2 $ . However, if the HRT surface$ \gamma_{\cal{A}} $ is in the two-disk phase, there is no entanglement between them.So far, we derived the integral expressions for the entanglement entropy between the subsystem
$ {\cal{A}} $ and its complement, and discussed the mutual information across the subsystem$ {\cal{A}} $ in a pure AdS4 spacetime. In the next section, we investigate the evolution of HEE in the Vaidya-AdS4 spacetime. -
First of all, to get rid of the ultra-violet (UV) divergence at
$ z\rightarrow0 $ , we only consider the finite term in (2), which is$ A_{\rm Ren} = A[\gamma_{\cal{A}}]-\frac{R_1+R_2}{\epsilon}, $

(5) where
$ \epsilon $ is the UV cut-off. It is manifest that$ A_{\rm Ren} $ is cut-off independent. We fix all free parameters, the mass$ M = 1 $ , the thickness of the shell$ v_0 = 0.3 $ , the outer radius of the annulus$ R_2 = 5 $ and the inner radius$ R_1\in[0.5,4.5] $ .Specifically, the extremal surface
$ \gamma_{{\cal{A}}} $ is parameterized by$ z = z(\phi), \quad r = r(\phi), \quad v = v(\phi), $

(6) where
$ \phi $ is the polar angle as shown in Fig. 3. Since the three variables in (6) are not independent, it is necessary to introduce a constraint equation. In the hemi-torus phase, the constraint equation is
Figure 3. (color online) The parameterization of the HRT surface. For the HRT surface in the hemi-torus phase, the parameter
$ \phi $ is shown in (a) with$ 0\leqslant \phi \leqslant \pi $ . For the HRT surface in the two-disk phase, the parameter is shown in (b) with$ 0 \leqslant \phi \leqslant \frac{\pi}{2} .$ $ z(\phi)\cos(\phi)-\left(r(\phi)-\frac{R_1+R_2}{2}\right)\sin(\phi) = 0, \quad (0\leqslant \phi\leqslant \pi) $

(7) and the boundary conditions are
$ z(0) = z(\pi) = 0, \quad v(0) = v(\pi) = t, \quad r(0) = R_2, \quad r(\pi) = R_1. $

In the two-disk phase, the constraint equation is
$ z(\phi)\cos(\phi)-r(\phi)\sin(\phi) = 0,\quad \left(0\leqslant \phi\leqslant \frac{\pi}{2}\right) $

(8) and the boundary conditions reduce to
$\begin{gathered} z(0) = z' \left(\frac{\pi }{2}\right) = 0,\quad v(0) = t,\quad v'\left(\frac{\pi }{2}\right) = 0,\quad \hfill \\ r(0) = {R_2}\;({\text{or}}\;{R_1}),\quad r \left(\frac{\pi }{2}\right) = 0. \hfill \\ \end{gathered} $

The above constraint equations (7) and (8) are imposed on the area functional (2) by the method of Lagrange multipliers. The corresponding e.o.m. can be numerically solved by the method of finite differences.
We now present the numerical results for the evolution of HEE based on the renormalized area
$ A_{\rm Ren} $ . The time dependence of HEE on the ratio of the two radii$ R_1/R_2 $ is illustrated in Fig. 4(a). It is obvious that the entanglement entropy increases almost linearly① with time in the intermediate stage of the thermal quench and finally saturates. Moreover, defining the rate of entanglement growth as
Figure 4. (color online) (a) illustrates the evolution of HEE for
$ R_1/R_2 = 0.1, 0.3, 0.5, 0.7 $ and$ 0.9 $ . (b) illustrates the rate of entanglement growth in units of length of$ \partial{\cal{A}} $ . (c) is the contour plot of HEE during the evolution for different ratios$ R_1/R_2 $ ; lighter color corresponds to larger value of HEE.$ V_{\cal{A}} = \frac{1}{R_1+R_2}\frac{{\rm d} A_{\rm Ren}}{{\rm d}t}, $

we find that it always increases with time in the early stage and eventually decreases to zero at equilibrium, as shown in Fig. 4(b). In general, the saturation value and the saturation time increase with the width of the region
$ {\cal{A}} $ , which is quite a common phenomenon in literature. As the HRT surface for a wide boundary region$ {\cal{A}} $ usually stretches deep into the bulk region, the null shell also takes a longer time to reach this region during the holographic quench process. As a consequence, it takes a longer time to get to saturation. Furthermore, the saturation time approaches a constant as the ratio$ R_1/R_2\rightarrow0 $ , as shown in Fig. 4(c). This result indicates that in the region where$ R_1/R_2 $ approaches zero, the HRT surfaces with different$ R_1 $ are in the two-disk phase near saturation. Since the outer radius$ R_2 $ is fixed, all HRT surfaces which are in the two-disk phase share the same outer part of the extremal surface and have the same saturation time.It should be noted that the evolution of HEE has an irregular saturation when
$ R_1/R_2 = 0.3 $ . This result reveals that the HRT surface undergoes a phase transition during the thermal quench. The other results in Fig. 4(a) and 4(b) demonstrate that the HRT surfaces are always in the same phase during the quench. We analyze these results in more detail in the next subsection. -
In Fig. 5(a), we show the time evolution of HEE for different inner radii
$ R_1 $ . The region marked in red represents the HRT surface in the hemi-torus phase, while the region in gray represents the HRT surface in the two-disk phase. In general, the HRT surfaces are in the hemi-torus phase as the ratio of two radii$ R_1/R_2 $ approaches one, otherwise if$ R_1/R_2\ll1 $ the HRT surfaces are in the two-disk phase. In addition, the critical$ R_1 $ , which may be defined as the borderline of the two phases, shifts non-monotonically during the thermal quench, as shown in Fig. 5(b). At the early stage of the quench, the critical point shifts towards the outer radius$ R_2 $ . After reaching its peak at$ t\approx1.80 $ , the critical point decreases monotonically to a lower level and eventually becomes stable.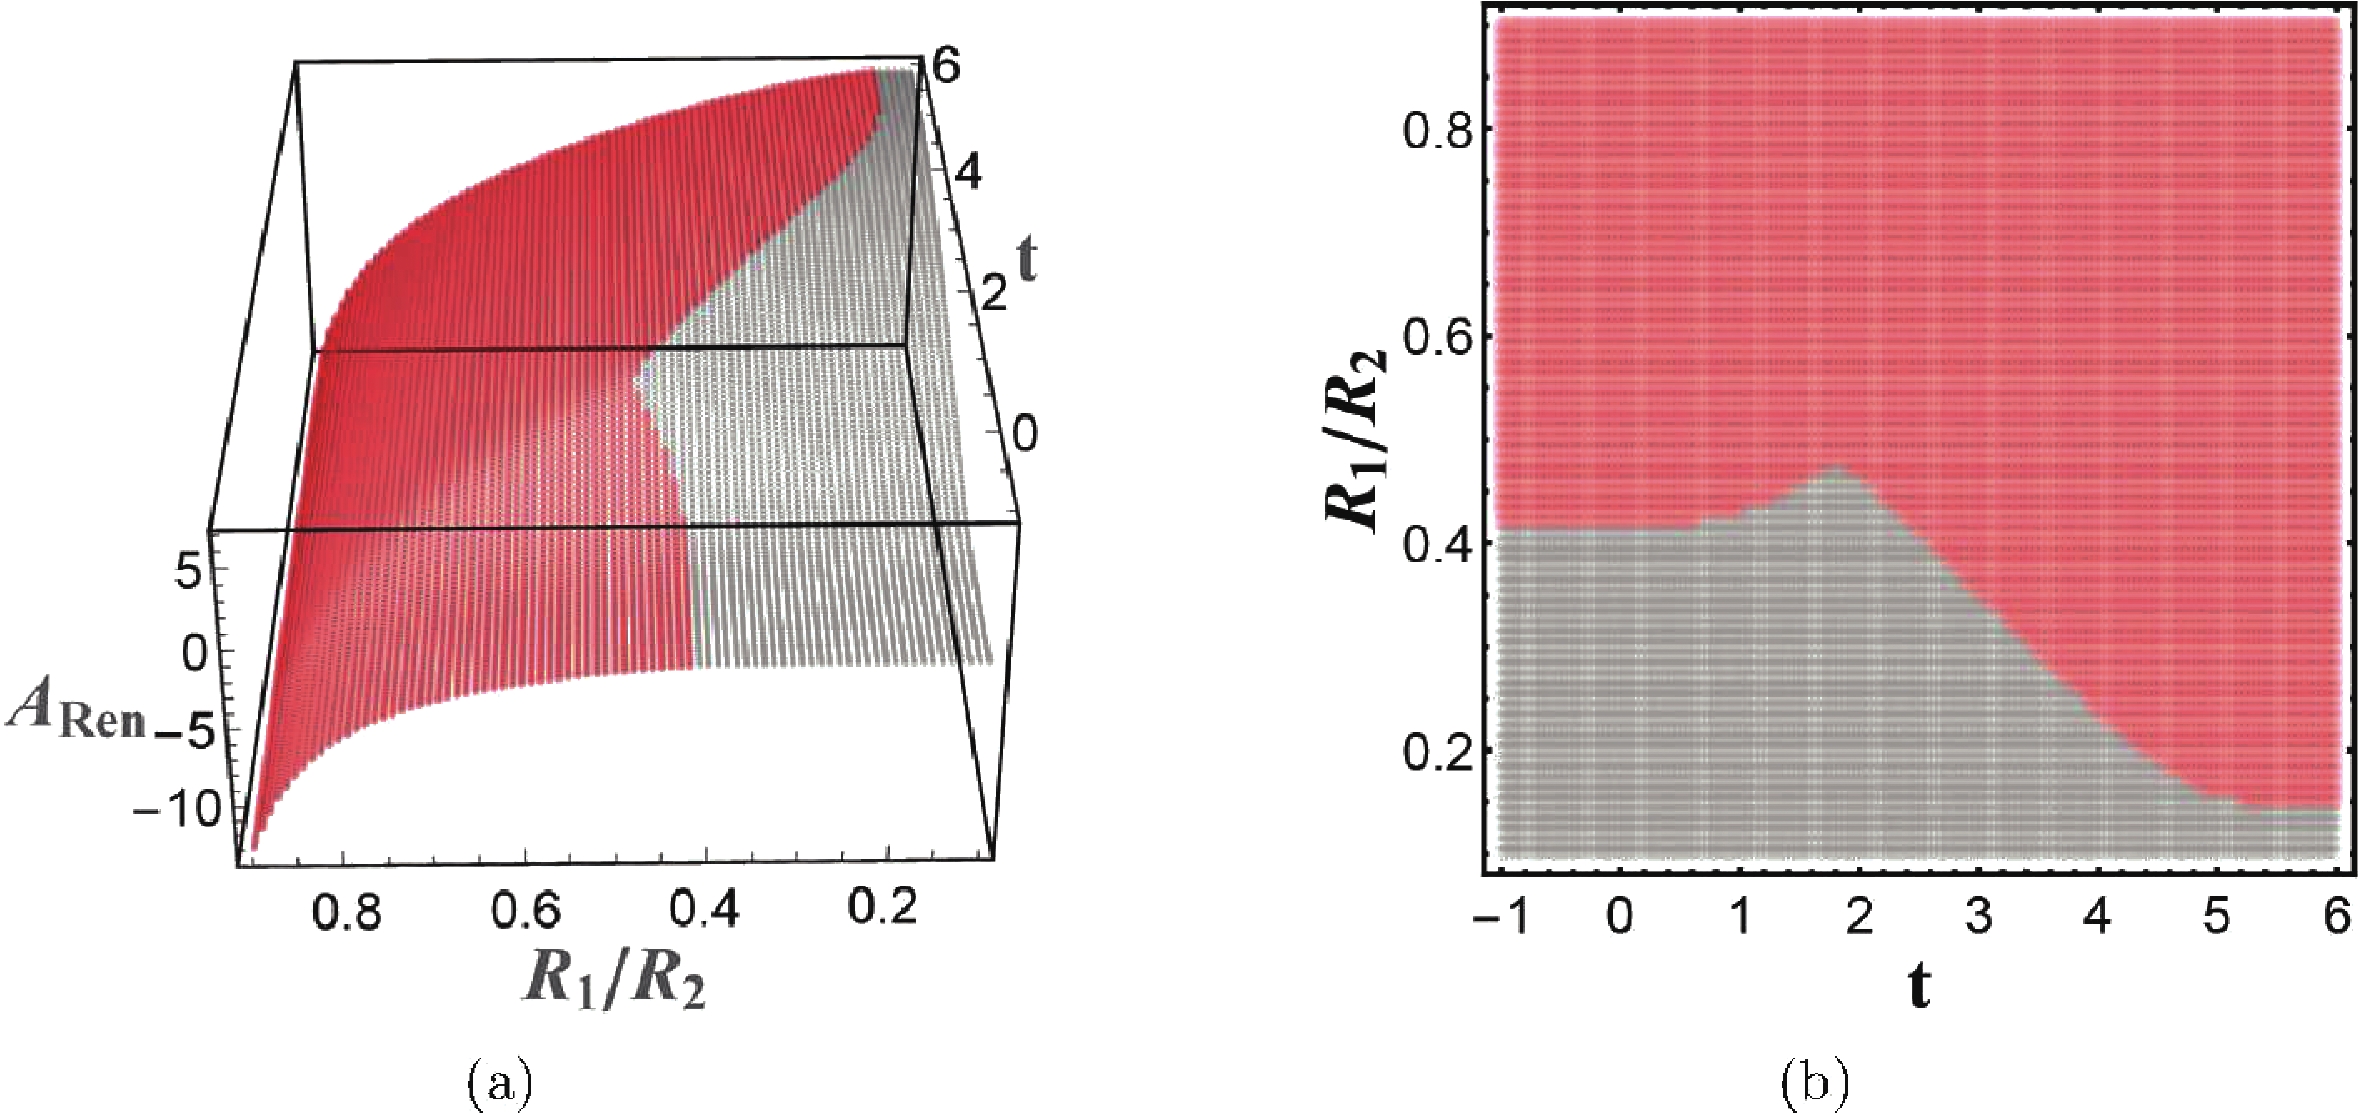
Figure 5. (color online) The evolution of HEE for different
$ R_1/R_2 $ is shown in (a). The curves in red indicate that the HRT surface is in the hemi-torus phase, while grey indicates that the HRT surface is in the two-disk phase. (b) is the projection of (a) on the$ (R_1/R_2,t) $ plane, which is convenient for identifying the phase for any parameter$ R_1/R_2 $ and at any moment.The low level of the critical point, at a later time, can be understood from Fig. 6. In the early stage, a candidate in the two-disk phase possesses a smaller area and is thus the HRT surface. As the evolution proceeds, the other candidate in the hemi-torus phase starts to compete with the candidate in the two-disk phase and eventually becomes the HRT surface in the late stage. Note that in the late stage, the candidate in the two-disk phase has a thin bottleneck near
$ R = 0 $ and this will naturally lead to the candidate in hemi-torus phase becoming the HRT surface. In addition, the larger the ratio$ R_1/R_2 $ , the earlier the thin bottleneck occurs. As a consequence, the phase transition occurs earlier during the evolution.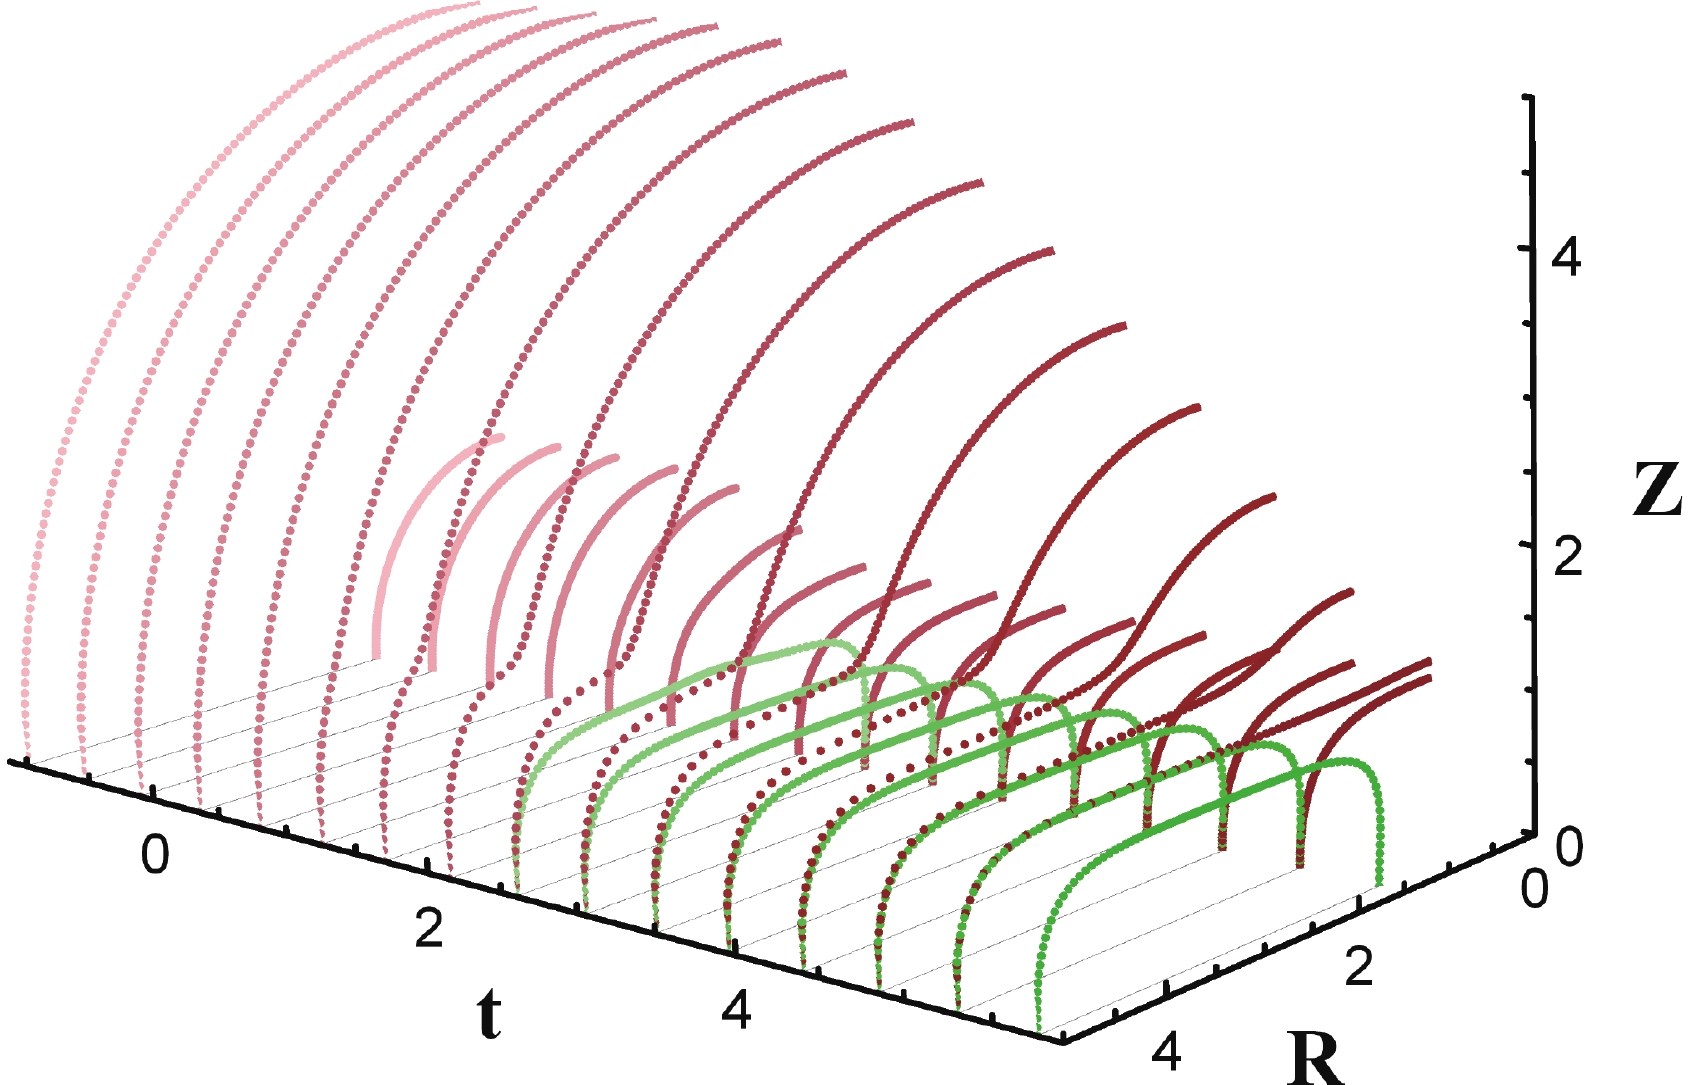
Figure 6. (color online) Two candidates for the HRT surface anchored on
$ \partial{\cal{A}} $ are shown for each step of the evolution. The candidate in the two-disk phase is plotted in red, and the candidate in the hemi-torus phase in green. Note that the HRT surface does not exactly lie on the time step, but the figure is a sufficiently good approximation.It is interesting to note that for a fixed ratio
$ R_1/R_2 $ , a phase transition occurs during the thermal quench. Further, the times of phase transition depends on the value of the ratio. Accordingly, the evolution of HEE during the quench process can be characterized by the following three distinct types.● Region with no phase transition
For the ratio
$ R_1/R_2\geqslant 0.48 $ , the HRT surface is always in the hemi-torus phase during the quench process, while for$ R_1/R_2\leqslant 0.14 $ , the HRT surface is always in the two-disk phase, as shown in Fig. 7(a). Note that without a phase transition, the evolution of HEE of an annular domain is similar to that of a ball-shaped domain [22,26] since the evolution curve is always smooth (Fig. 7(d)). Moreover, a subsystem$ {\cal{A}} $ with greater$ R_2-R_1 $ generally possesses a greater saturation value and longer saturation time, as discussed above.
Figure 7. (color online) The shadowed regions in (a), (b) and (c) represent regions with no phase transition, single phase transition and double phase transition, respectively, during the evolution of HEE with a fixed
$ R_1/R_2 $ . The curves in grey exhibit the evolution of HEE in the two-disk phase, while the curves in red exhibit the evolution of HEE in the hemi-torus phase.● Region with a single phase transition
In the interval
$ 0.14 \leqslant R_1/R_2 \leqslant 0.42 $ , the HRT surface is in the two-disk phase in the early stage of evolution, and then undergoes a phase transition to the hemi-torus phase which persists until saturation is reached, as shown in Fig. 7(b). In addition, the critical point decreases almost linearly with time$ t $ , and ultimately reaches a global minimum which is consistent with the critical point in the Schwarzschild-AdS geometry.When the system approaches the critical point, the first derivative of HEE with respect to time
$ t $ is discontinuous (Fig. 7(e)). Similarly, both the saturation value and the saturation time generally increase with$ R_2-R_1 $ . During the evolution, the discontinuity of the derivative of HEE with respect to time mostly occurs when the boundary region$ {\cal{A}} $ is a strip and the width of the strip is greater than the event horizon. The difference is that when the boundary$ {\cal{A}} $ is a strip, the discontinuity occurs due to the multiple values of the extremal surface [22,26,29,30], but when the boundary region$ {\cal{A}} $ is an annulus, the discontinuity occurs due to the phase transition from the two-disk phase to the hemi-torus phase.● Region with a double phase transition
In the interval
$ 0.42\leqslant R_1/R_2\leqslant 0.48 $ , there is a peak of the borderline between the two phases, and therefore in this region the HRT surface changes phase twice for a fixed$ R_1/R_2 $ , as shown in Fig. 7(c). In the early stage, the HRT surface is in the hemi-torus phase, and in the intermediate stage it undergoes a first phase transition from the hemi-torus phase to the two-disk phase. Eventually, the HRT surface undergoes a second phase transition to the original hemi-torus phase, which persists until the equilibrium is reached.It is intriguing that when the system approaches the first critical point (at which the phase changes from the hemi-torus phase to the two-disk phase), the time derivative of HEE seems to be continuous, which is different from the behavior of the system at the second critical point, as shown in Fig. 7(f). When the HRT surface undergoes the second phase transition, the time derivative of HEE is discontinuous, which is consistent with the region with a single phase transition. Furthermore, after passing through the second critical point, the system does not reach the equilibrium immediately. This phenomenon is in contrast to the strip case, where the discontinuity only occurs at the equilibrium.
After identifying the three distinct regions of HEE evolution, we would like to know what is the entanglement growth in these regions, and how different values of the parameters affect them. In the next two subsections, we explore the dependence of the rate of entanglement growth
$ V_{\cal{A}} $ on the ratio of the two radii$ R_1/R_2 $ , as well as the dependence of the evolution of HEE on the thickness$ v_0 $ of the null shell. -
As discussed in [25,27], the rate of linear growth in the intermediate stage provides a geometric interpretation of the entanglement growth, since during the thermal quench a wave propagates inward from the boundary of
$ {\cal{A}} $ . The region which was covered by the wave is entangled with the region outside$ {\cal{A}} $ , while the region which is not yet covered is generally not entangled with the outside. Naturally, when the wave covers the whole region$ {\cal{A}} $ , saturation occurs. This phenomenon is called "entanglement tsunami", and the speed of the tsunami is characterized by the maximal rate of entanglement growth$ V_{\max} $ during the evolution.We point out that the dependence of the tsunami speed
$ V_{\max} $ on the ratio$ R_1/R_2 $ exhibits a distinct behavior in regions with different phase transitions, as shown in Fig. 8. In the region with no phase transition ($ R_1/R_2\leqslant 0.14 \cup R_1/R_2\geqslant 0.48 $ ), the tsunami speed$ V_{\max} $ always decreases with the ratio$ R_1/R_2 $ . In particular, when the ratio$ R_1/R_2\rightarrow1 $ , the maximal rate of entanglement growth$ V_{\max} $ decreases to zero. In the region with a single phase transition ($ 0.14\leqslant R_1/R_2 \leqslant 0.42 $ ), the tsunami speed$ V_{\max} $ decreases linearly at first, and then increases after reaching a local minimum. In the region with a double phase transition ($ 0.42\leqslant R_1/R_2 \leqslant 0.48 $ ), the speed of entanglement tsunami reaches a local maximum. This means that the wave-front shifts with the rate away from the boundary$ \partial{\cal{A}} $ . Moreover, in a relativistic system, it is natural to expect that the maximal rate of entanglement growth is constrained by causality. In our calculations, the fastest rate of entanglement tsunami occurs at$ t\approx0.46 $ ,$ V_{\max} = 0.51 $ , which is smaller than the speed of light. The result is consistent with Refs. [25,27], and exhibits a global maximal growth rate of the 4-dimensional SAdS in the limit of a rapid quench.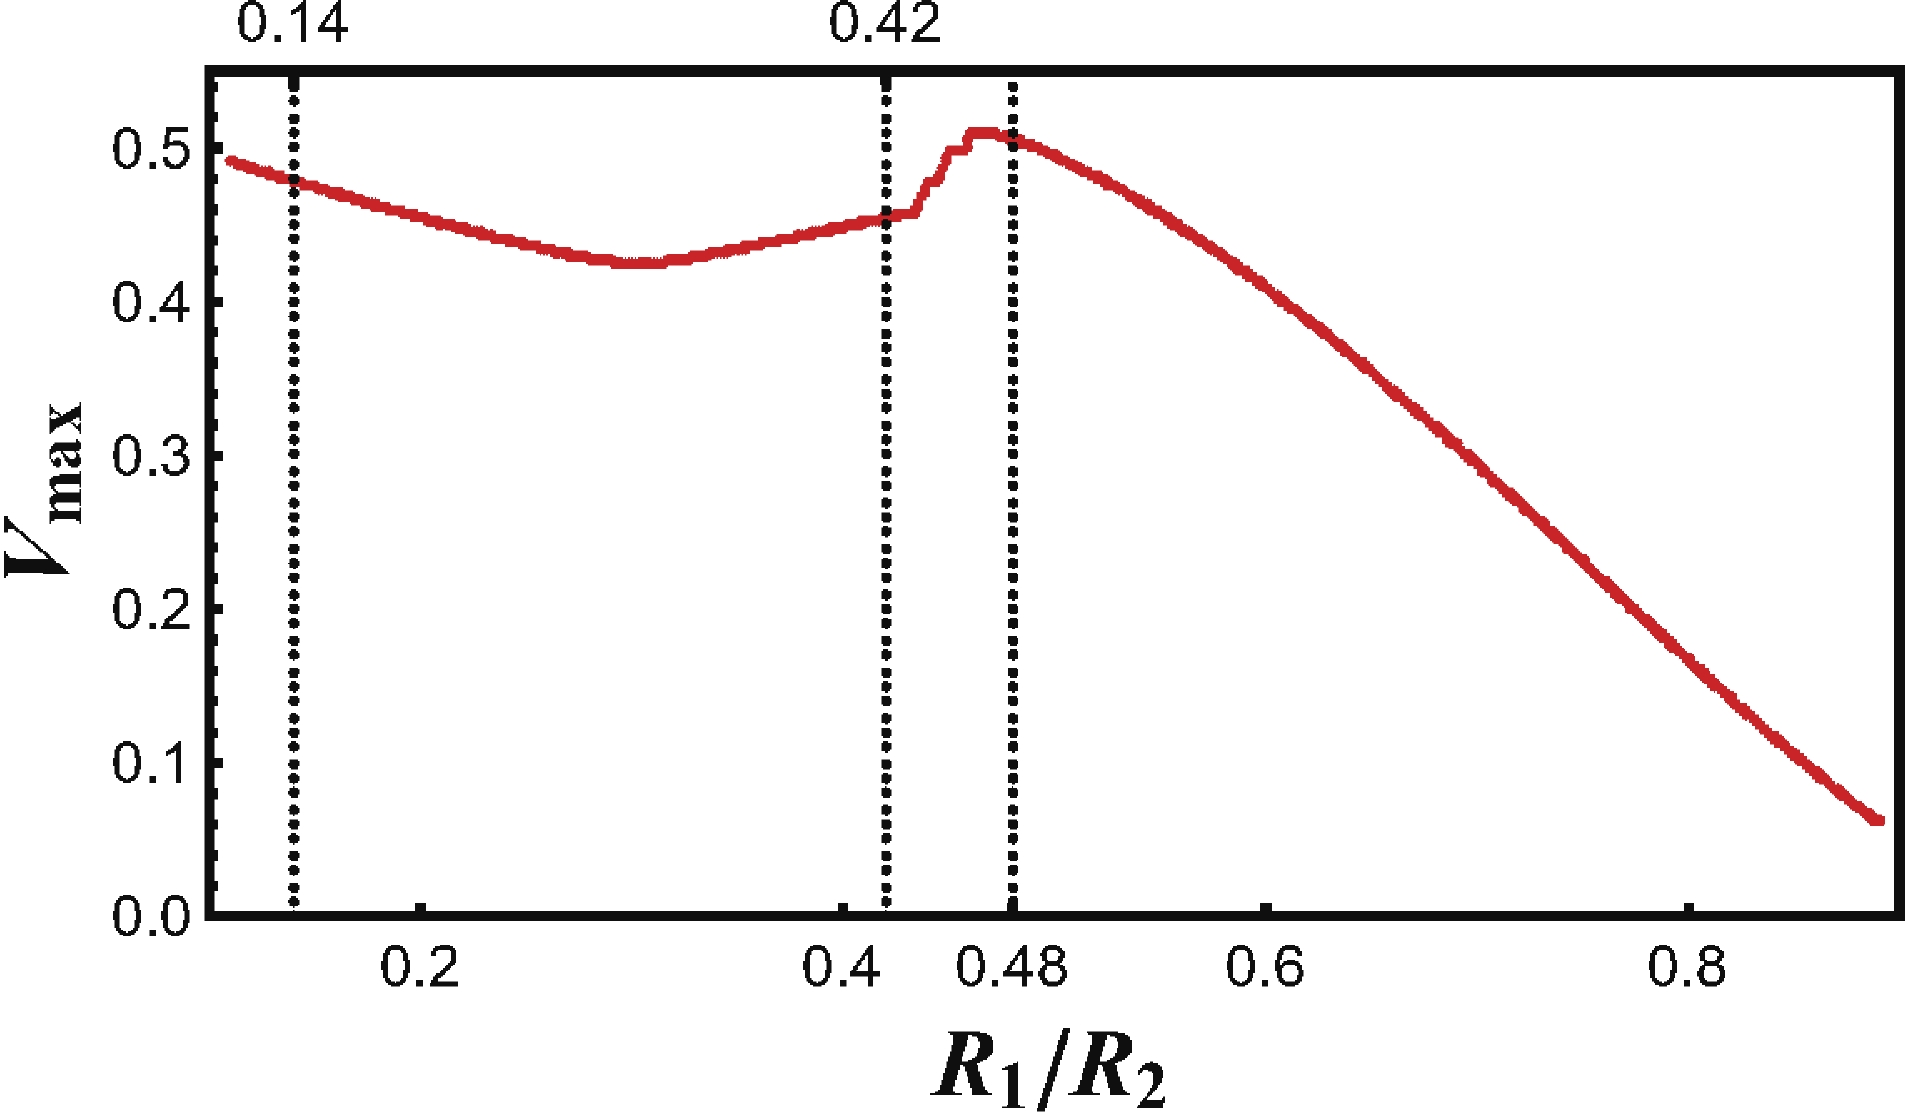
Figure 8. (color online) The maximal rate of entanglement growth
$ V_{\max} $ for different ratios of the two radii$ R_1/R_2 $ , plotted in red. The three dashed lines divide the phase diagram into three distinct regions, as discussed in Sec. 3.1. -
The thickness of the null shell
$ v_0 $ also characterizes the speed of the quench. We define the mass function$ m(v) $ as$ m(v)\equiv\frac{M}{2}\left(1+\tanh\frac{v}{v_0}\right). $

(9) For small
$ v_0 $ , the mass$ m(v) $ of the system increases rapidly to the final saturation, while for large$ v_0 $ ,$ m(v) $ increases slowly, as shown in Fig. 9. Therefore,$ 1/v_0 $ characterizes the speed of the quench process: the larger the value of$ 1/v_0 $ , the sooner the quench saturates.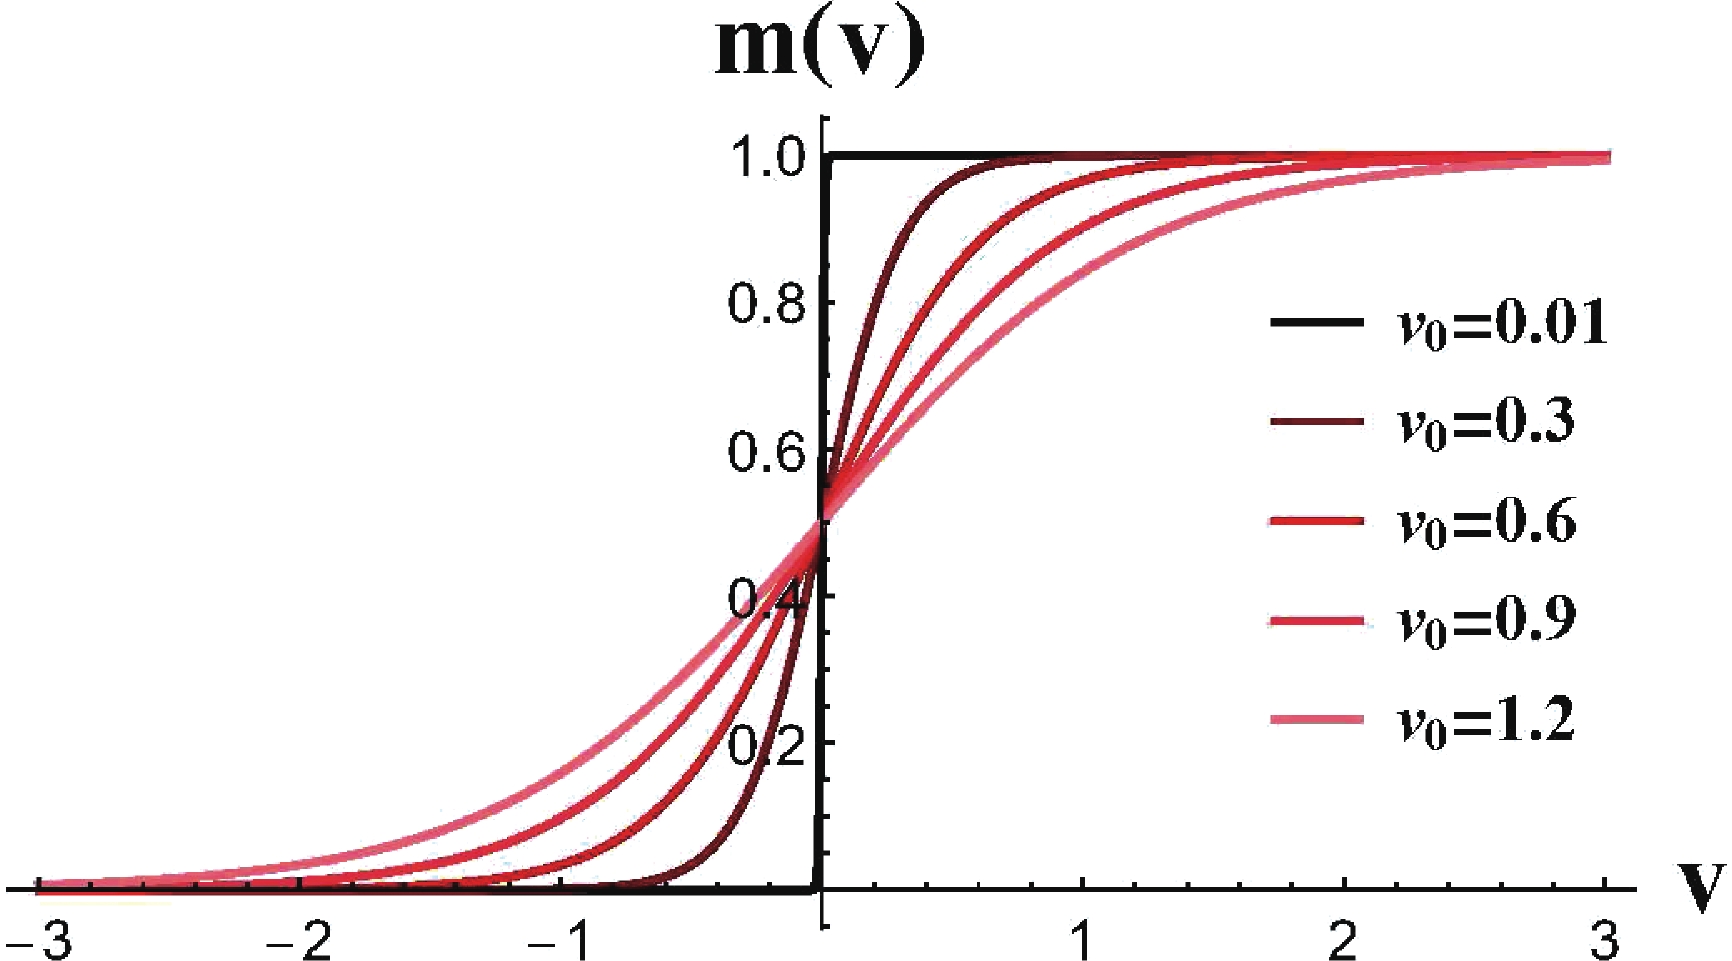
Figure 9. (color online) The evolution of the mass function
$ m(v) $ shows that it increases rapidly for small$ v_0 .$ In Fig. 10, we plot the evolution of HEE for various values of the parameter
$ v_0 $ . The position of the critical point near equilibrium is not affected by$ v_0 $ . For larger$ v_0 $ , the subsystem$ {\cal{A}} $ takes a longer time to reach equilibrium.
Figure 10. (color online) The evolution of HEE for various values of the parameter
$ v_0 $ . The red region represents the HRT surface in the hemi-torus phase, while the grey region represents the HRT surface in the two-disk phase.The most prominent feature in Fig. 10 is the change of size of the region with a double phase transition. For small
$ v_0 $ , the peak of the critical point is very sharp. When$ v_0 $ increases, the peak of the critical point decreases and eventually vanishes, such that the region with a double phase transition finally disappears. -
We have investigated the holographic thermalization process of an annular subsystem
$ {\cal{A}} $ on the boundary of the Vaidya-AdS geometry. Two distinct configurations of the HRT surface were obtained, the hemi-torus phase and the two-disk phase. The precise phase of the HRT surface depends on the ratio of the inner radius to the outer radius of the annulus. In addition, the maximal rate of entanglement growth$ V_{\max} $ exhibits a distinct behavior for different ratios of the two radii.During the thermalization process, the system with a fixed
$ R_1/R_2 $ possibly undergoes a phase transition, or a double phase transition, from a hemi-torus configuration to a two-disk configuration, or vice versa. The occurrence of various phase transitions is determined by the ratio of the two radii of the annulus, and three distinct regions were identified. When the annulus is suffiently wide, or narrow, the HRT surface$ \gamma_{\cal{A}} $ is always in the two-disk phase or the hemi-torus phase, there is no phase transition during the whole process, and the entanglement tsunami propagates more slowly for a larger ratio$ R_1/R_2 $ . In the interval$ 0.14\leqslant R_1/R_2 \leqslant 0.42 $ , the phase transition occurs once during thermalization, and the propagation of the entanglement tsunami reaches a local minimum. It is quite intriguing that there exists a region where phase transition occurs twice during thermalization. The HRT surface is in the hemi-torus phase for early times, in the two-disk phase for intermediate times, and in the hemi-torus phase for late times. The propagation of the entanglement tsunami reaches a local maximum, which means that the entanglement grows fairly quickly in the region with a double phase transition. Moreover, the local maximum obtained is consistent with the fastest rate of entanglement growth in the rapid quench limit, which means that the rate is constrained by causality. In addition, the region with a double phase transition becomes wide for a fast quench, and narrow, or even vanishes, for slow quenches.In this paper, we discussed the evolution of HEE following a global quench. It would be interesting to generalize our analysis to the inhomogeneous and anisotropic cases. Moreover, due to the restrictions of the numerical method, we only investigated quenches with a thickness of the null shell
$ v_0\geqslant 0.3 $ . It would also be worth to investigate the evolution of HEE in the thin shell limit, since the diagram of entanglement tsunami is more precise than in the case of a finite thickness$ v_0 $ .We are very grateful to Li Li, Chao Niu, Qiang Wen and Cheng-Yong Zhang for helpful discussions and suggestions.
Entanglement entropy of an annulus in holographic thermalization
- Received Date: 2019-09-29
- Available Online: 2020-02-01
Abstract: The thermalization process of the holographic entanglement entropy (HEE) of an annular domain is investigated in the Vaidya-AdS geometry. We determine numerically the Hubeny-Rangamani-Takayanagi (HRT) surface, which may be a hemi-torus or two disks, depending on the ratio of the inner radius to the outer radius of the annulus. More importantly, for some fixed ratio of the two radii, the annulus undergoes a phase transition, or a double phase transition, during thermalization from a hemi-torus to a two-disk configuration, or vice versa. The occurrence of various phase transitions is determined by the ratio of the two radii of the annulus. The rate of entanglement growth is also investigated during the thermal quench. The local maximal rate of entanglement growth occurs in the region with a double phase transition. Finally, if the quench process is sufficiently slow, which may be controlled by the thickness of the null shell, the region with a double phase transition vanishes.


 DownLoad: