-
Exploring the phase structure of strongly interacting nuclear matter is one of the main goals of heavy-ion collision experiments. Owing to the asymptotic freedom nature of quantum chromodynamics (QCD), nuclear matter is expected to undergo a phase transition from hadrons to a quark-gluon plasma (QGP) phase [1]. Lattice QCD calculations show that at small baryon chemical potential and high temperature this transition is a smooth crossover. However, it cannot give accurate predictions for a large chemical potential owing to the sign problem of the lattice QCD [2]. A first-order phase transition is expected at high baryon chemical potential from various model calculations [3-6]. The end point of this possible first-order phase boundary toward the crossover region is called the QCD critical end point (CEP). The location of the CEP in the QCD phase diagram or even its existence has not been confirmed yet [7-9].
It has been predicted that the fluctuations (susceptibilities) of conserved charges, such as baryon number, electric charge, and strangeness, are sensitive to QCD phase transition. The experimental measurements of the fluctuations of conserved quantities were performed in the beam energy scan (BES) program by the STAR experiment at the Relativistic Heavy-Ion Collider (RHIC). The STAR experiment observed a nonmonotonic energy dependence of the fourth order (
$ \kappa\sigma^{2} $ ) net-proton fluctuations in the most central Au+Au collisions [10-15]. Furthermore, this nonmonotonic behavior cannot be described by various transport models [13, 16, 17]. The STAR experiment also measured the sixth order cumulants of the net-proton multiplicity distributions in Au+Au collisions at 200 GeV [18]. This was done to find the signature of the crossover at small baryon chemical potential values. In order to investigate the contribution of the possible criticality physics to the conserved charges fluctuations, we adopt an effective quark model, the Nambu-Jona-Lasinio (NJL) model [19, 20] to calculate the various fluctuations up to eighth order in two cases, one with the CEP and without. By comparing the differences between the two cases, one can see how the various baryon number susceptibilities change sign and magnitude in the QCD phase diagram as a function of the temperature and baryon chemical potential. This can provide valuable insight for the investigation of the signs of the QCD phase transition and/or critical point in heavy-ion collisions with baryon number fluctuations.In previous studies, these quantities were investigated up to the fourth order [21-28]. We choose the NJL model as a representative because other effective models such as the Polyakov-loop improved NJL model [29, 30], linear
$ \sigma $ model [31], the Polyakov-Quark-Meson (PQM) model [32-34], the Gross-Neveu (GN) model [22], or Dyson-Schwinger equations [35-40] all share similar phase structure with it. We are mainly interested in the qualitative behavior of the susceptibilities (the location of the CEP in the NJL model tends to be at higher$ \mu_B $ and lower T though).The chemical potential of u, d quarks are almost the same in experiments [41]; therefore, we set them to be equal throughout this work. The chemical potential of the strange quark is smaller; however, owing to the large mass of s quark, it does not significantly vary the phase diagram, thus having a little influence on the susceptibilities [28]. Throughout our calculations, we assume that the fire-ball is near the thermal equilibrium at freeze-out, although critical slowing of dynamics would be important if the fire-ball passes the CEP [42, 43]. In addition, the changes in the expansion dynamics and interactions that produce variations in particle spectra and acceptance independent of critical phenomena may blur the signal [44]. However, these non-equilibrium effects do not affect the purpose of our present study to find the difference of higher-order susceptibilities between critical and noncritical phase transition.
-
Nambu-Jona-Lasinio (NJL) model is an effective Lagrangian of quarks with local four-point/six-point interactions. This model might serve as a suitable approximation for QCD in the low-energy limit, assuming that gluon degrees of freedom can be frozen into effective point-like interactions between quarks. An advantage of this model is that it can be designed to incorporate all global symmetries of QCD and enables one to “see” the dynamical symmetry breaking mechanisms at work. It offers a simple scheme to study spontaneous chiral symmetry breaking and its manifestations in hadron physics, such as dynamical quark mass generation, the appearance of a quark pair condensate, and the role of pions as Goldstone bosons. The disadvantage of the model is that it does not have the color confinement property of QCD [19, 20]. In the last section of this paper, we will also adopt the recent EPNJL model which incorporates confinement by including the Polyakov loop [45, 46].
The Lagrangian density we adopt is the three-flavor NJL model with scalar and vector interactions, along with the t'Hooft interaction that breaks the U(1)A symmetry:
$\begin{split} {\cal L} =& \bar \psi (i/\!\!\!\!\partial - {m_0})\psi + {G_S}\left[{(\bar \psi {\lambda _i}\psi )^2} + {(\bar \psi i{\gamma _5}{\lambda _i}\psi )^2}\right]\\& - {G_V}\left[{(\bar \psi {\gamma _\mu }{\lambda _i}\psi )^2} + {(\bar \psi {\gamma _\mu }{\gamma _5}{\lambda _i}\psi )^2}\right]\\& - K({\rm det}\Big[\bar \psi (1 + {\gamma _5})\psi \Big] + {\rm det}\Big[\bar \psi (1 - {\gamma _5})\psi \Big]), \end{split}$

(1) where
$ m_0={\rm diag}(m_{u0},m_{d0},m_{s0}) $ is the bare mass matrix.$ \lambda_i $ are the Gell-Mann matrices, and the determinant is taken in the flavor space. The model's parameters are taken from Ref. [47], which are determined by fitting to the mass and decay constant of various mesons. The bare quark masses are$ m_{u0}=m_{d0}=5\ {\rm MeV}, m_{s0}=136\ {\rm MeV} $ . The three-momentum cutoff$ \Lambda=631\ {\rm MeV} $ , and$ G_S=1.83/\Lambda^2, K= $ $ 9.29/\Lambda^5$ . At a finite temperature and chemical potential, we have one additional term$ \mu_0 \psi^{\dagger}\psi $ , where$ \mu_0 $ is the bare chemical potential matrix. After performing mean-field approximation, the following equations hold:$\left\{ \begin{array}{l} {m_i} = {m_{i0}} - 4{G_S}\langle {{\bar q}_i}{q_i}\rangle + 2K\langle {{\bar q}_m}{q_m}\rangle \langle {{\bar q}_n}{q_n}\rangle (i \ne m \ne n),\\ {\mu _i} = {\mu _{i0}} - 4{G_V}\langle q_i^†{q_i}\rangle , \end{array} \right.$

(2) with
$ \langle\Theta\rangle=\displaystyle\frac{{\rm Tr} (\Theta {\rm e}^{-\beta(\mathcal{H}-\mu_i \mathcal{N}_i)})}{{\rm Tr}( {\rm e}^{-\beta(\mathcal{H}-\mu_i\mathcal{N}_i)})} $ being the grand canonical ensemble average, and i= u, d, s. These are a set of self-consistent equations that relate the bare and effective mass/chemical potential of the quarks.The various susceptibilities are defined as:
$\frac{{\partial \langle q_i^†{q_i}\rangle }}{{\partial {\mu _j}}} = {\chi _{ij}},\ \ \frac{{{\partial ^2}\langle q_i^†{q_i}\rangle }}{{\partial {\mu _j}\partial {\mu _k}}} = {\chi _{ijk}},\ \ \frac{{{\partial ^3}\langle q_i^†{q_i}\rangle }}{{\partial {\mu _j}\partial {\mu _k}\partial {\mu _p}}} = {\chi _{ijkp}},...$

(3) We calculated these susceptibilities using symbolical differentiation, which prevents truncation and rounding errors due to numerical differentiation. Furthermore, we changed the base from {u, d, s} at quark level to the conserved charges {B, Q, S} by using
$\left\{ \begin{array}{l} {\mu _u} = \displaystyle\frac{1}{3}({\mu _B} + 2{\mu _Q}),\\ {\mu _d} = \displaystyle\frac{1}{3}({\mu _B} - {\mu _Q}),\\ {\mu _s} = \displaystyle\frac{1}{3}({\mu _B} - {\mu _Q} - 3{\mu _S}). \end{array} \right.$

(4) -
Two cases are considered in this work: GV= 0, which has a CEP and has been studied extensively, and GV= 0.5GS (given by renormalization-group analysis [48, 49]), which remains a crossover transition throughout the phase diagram [7]. As can be seen from Fig. 1, the two cases have very similar phase structures at low
$ \mu_B $ .
Figure 1. Phase diagram of the order parameter mu (the constituent up quark mass) in MeV. (a) GV= 0 case where a CEP is present. The thick line shows the boundary of the first-order phase transition (b) GV= 0.5GS case where there is no critical behavior.
To relate our calculation with experiments and other model calculation, we consider the following ratios:
${m_n}(X) = \frac{{{T^n}\chi _X^{(n + 2)}}}{{\chi _X^{(2)}}},\ \ \ n = 1,2,3,...$

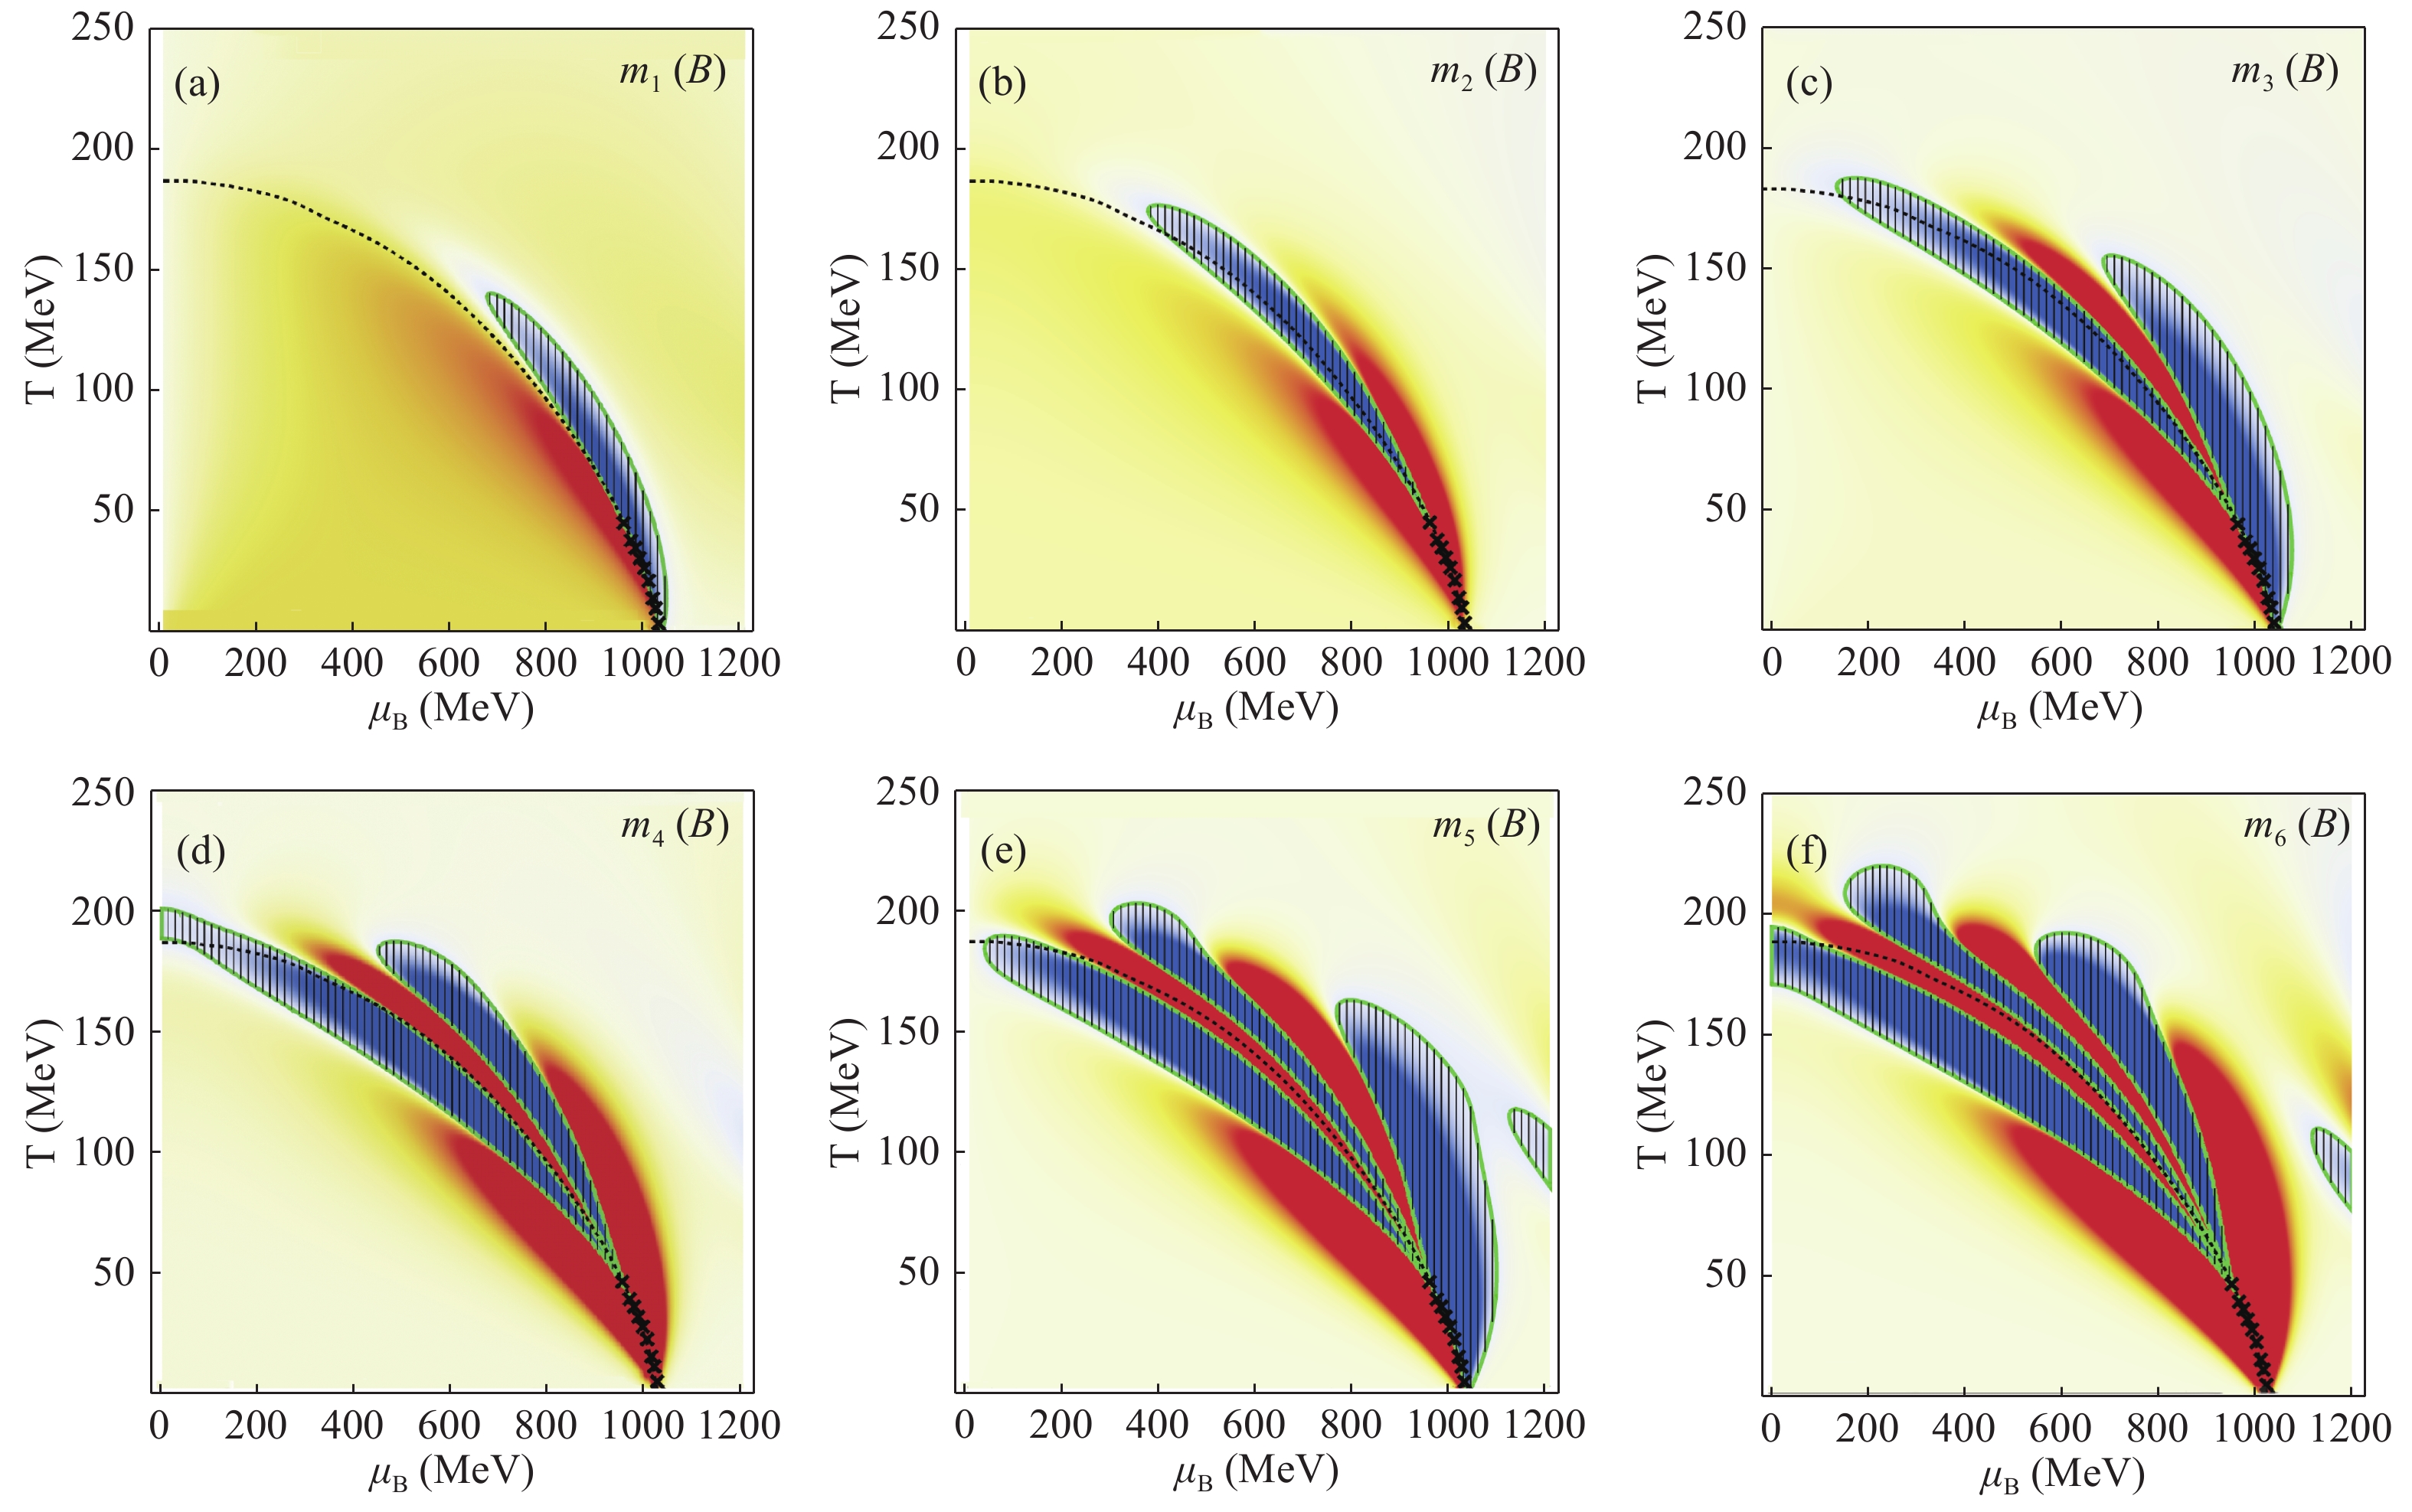
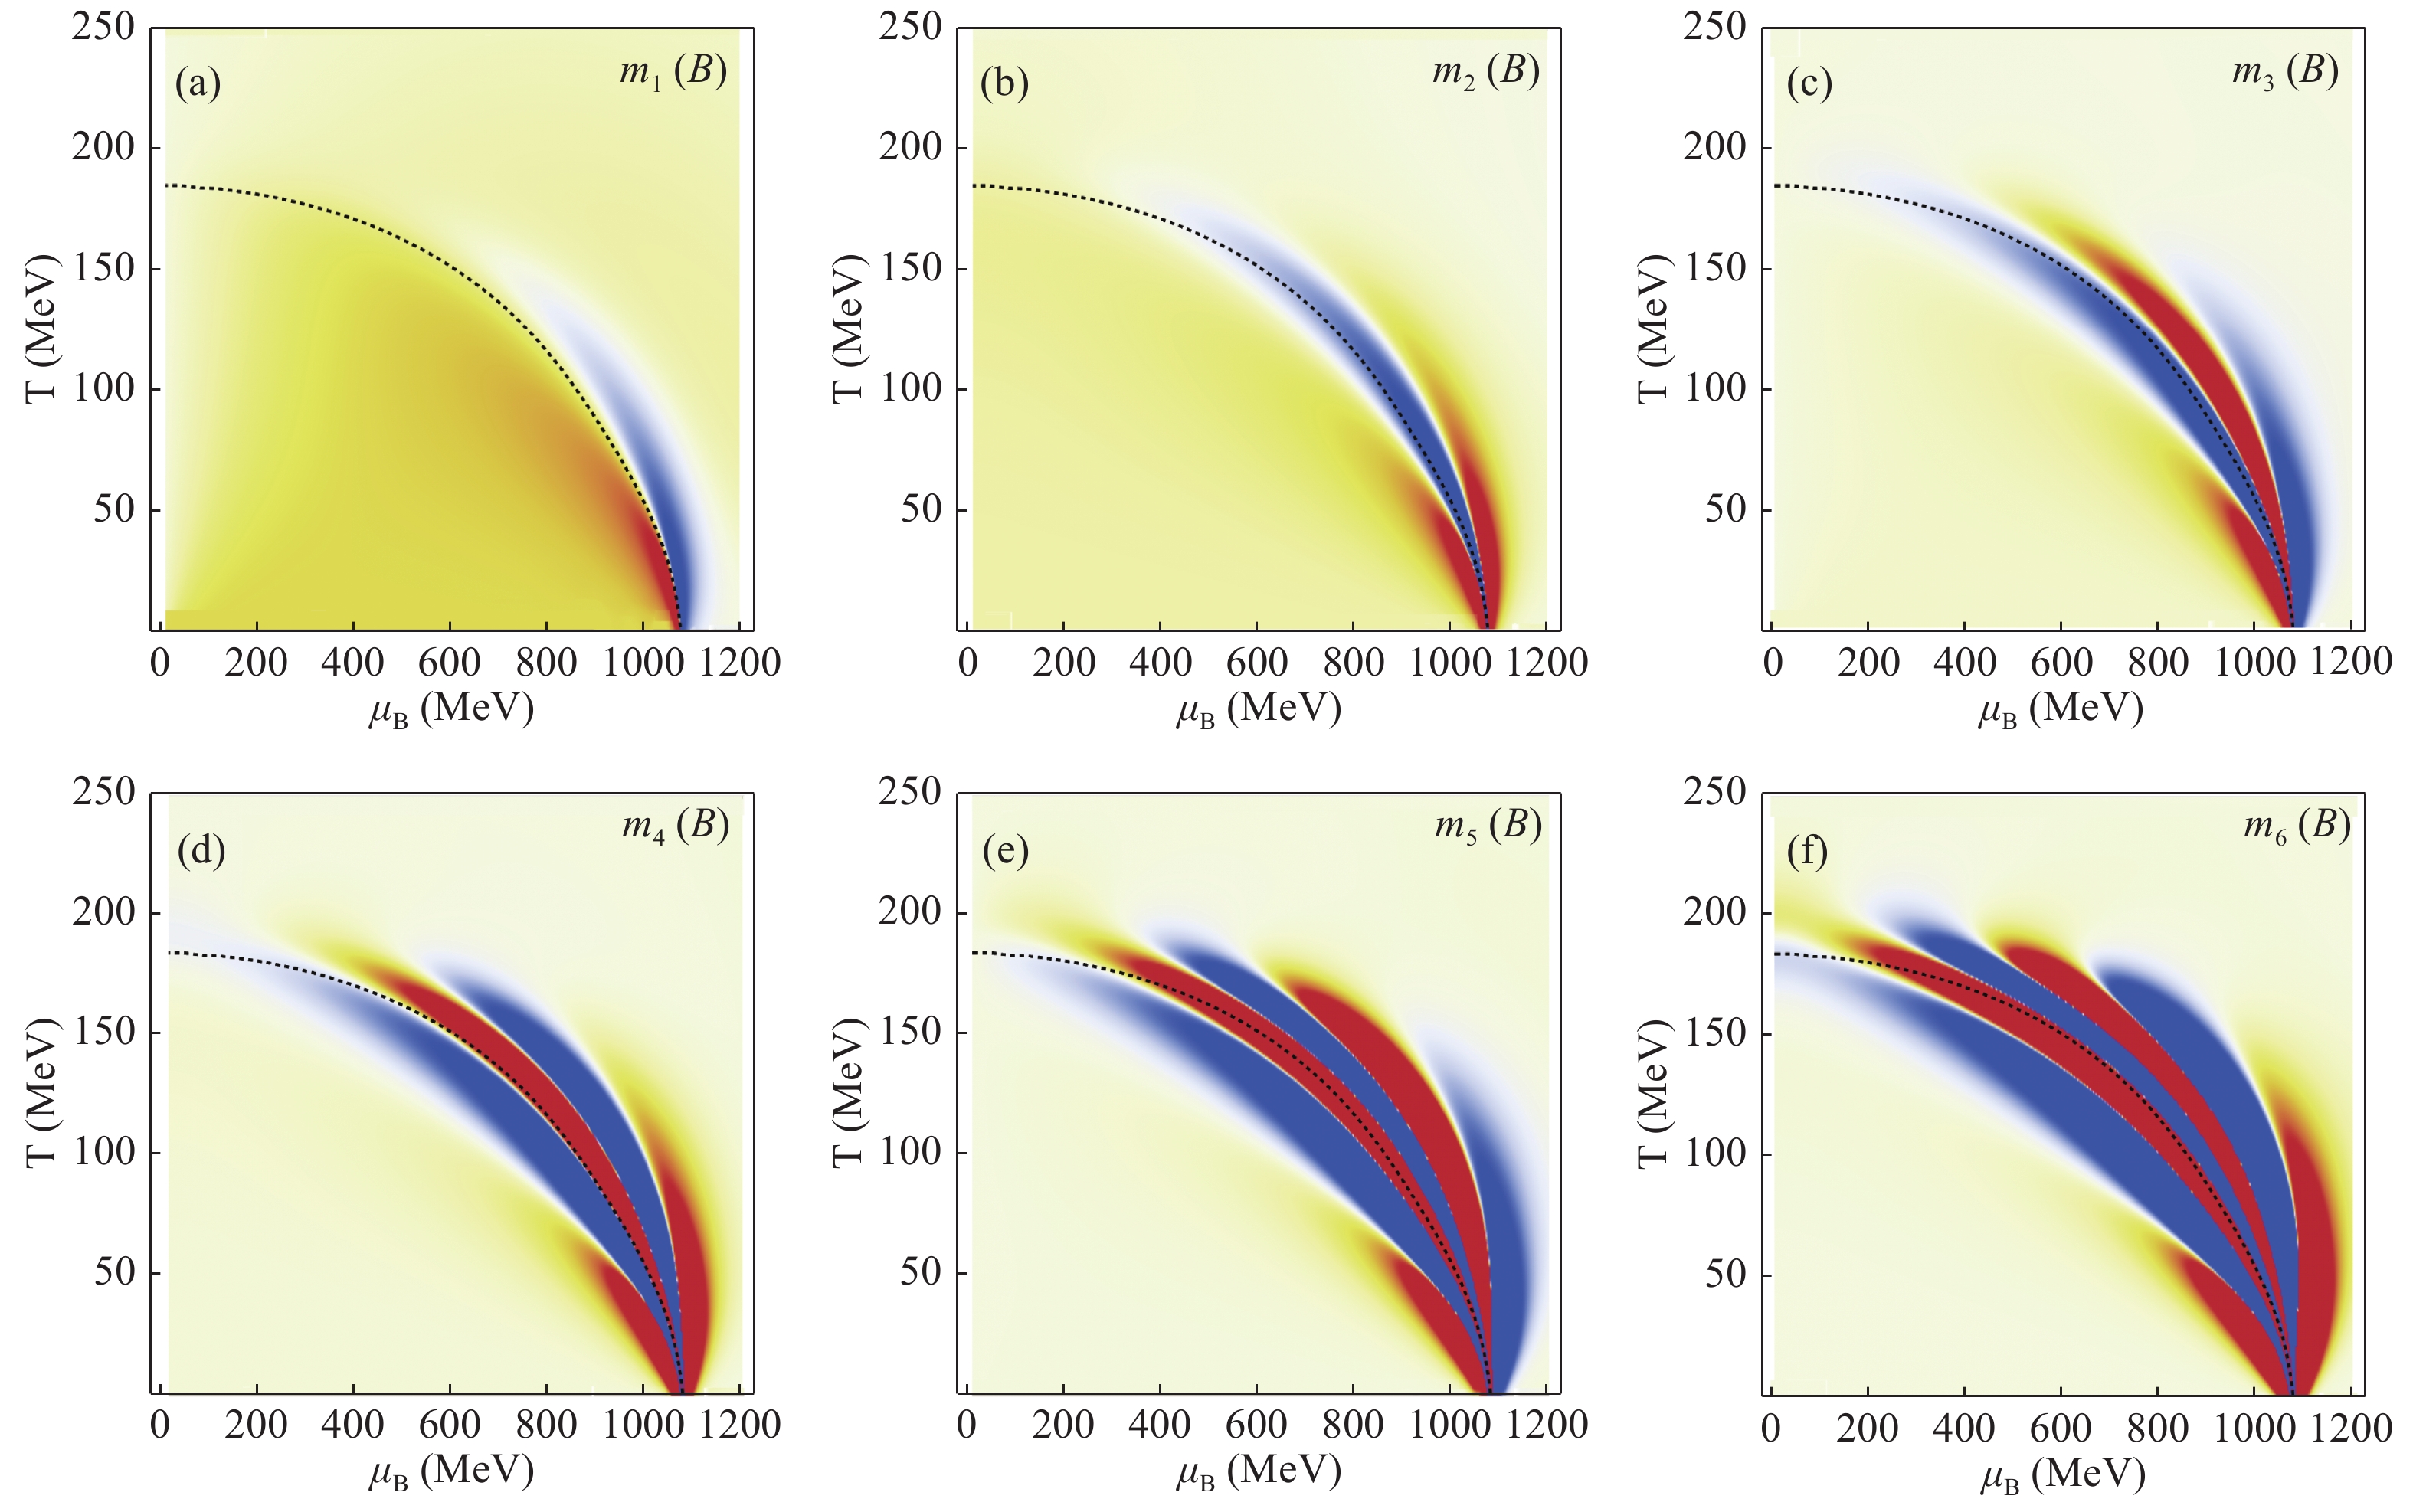
(5) where x= B, Q, S. These ratios are then independent of the volume of the system. The signs of these ratios with x = B are shown in Fig. 2 and Fig. 3. Red regions indicate a positive value, and blue regions indicate a negative value. The yellow regions represent values very close to 0.

Figure 2. (color online) Sign of mn of baryon number for GV= 0. Red region represents positive value, while blue zone represents negative value. The dashed line is the crossover line, while the crosses represents the first-order phase transition curve. The negative regions are also enclosed by a solid green line and filled with stripes for illustration purpose.

Figure 3. (color online) Sign of mn of baryon number for GV = 0.5GS. Red region represents positive value, while blue region represents negative value. The dashed line is the crossover line.
Near the phase boundary (the crossover line and the possible first-order phase transition line), the difference in the signs of the signals (the moments) is not significant. The negative regions in Fig. 2 (a) and (b) are the same as predicted in Refs. [24] and [25] by universal analysis. However, a similar sign pattern is also observed in the case with no CEP (see Fig. 3). If we measure data away from the phase boundary, we may not be able to say if the CEP is present only by analyzing the sign of the data. The most significant difference between the two cases is at the low T (large
$ \mu_B $ ) part of the phase boundary. In particular, across the first-order phase transition line (denoted by crosses in Fig. 2), the signal changes sign for only 0 (even order) or 1 (odd order) time. However, for the no CEP case, the number of times the signal changes sign increases across the boundary as the order becomes higher. If we can measure enough data points across this part of the phase boundary, we may be able to say if the phase transition is first-order or crossover.Next, we want to study the magnitude of the various susceptibilities. In Fig. 4, we plot the region where the magnitude of
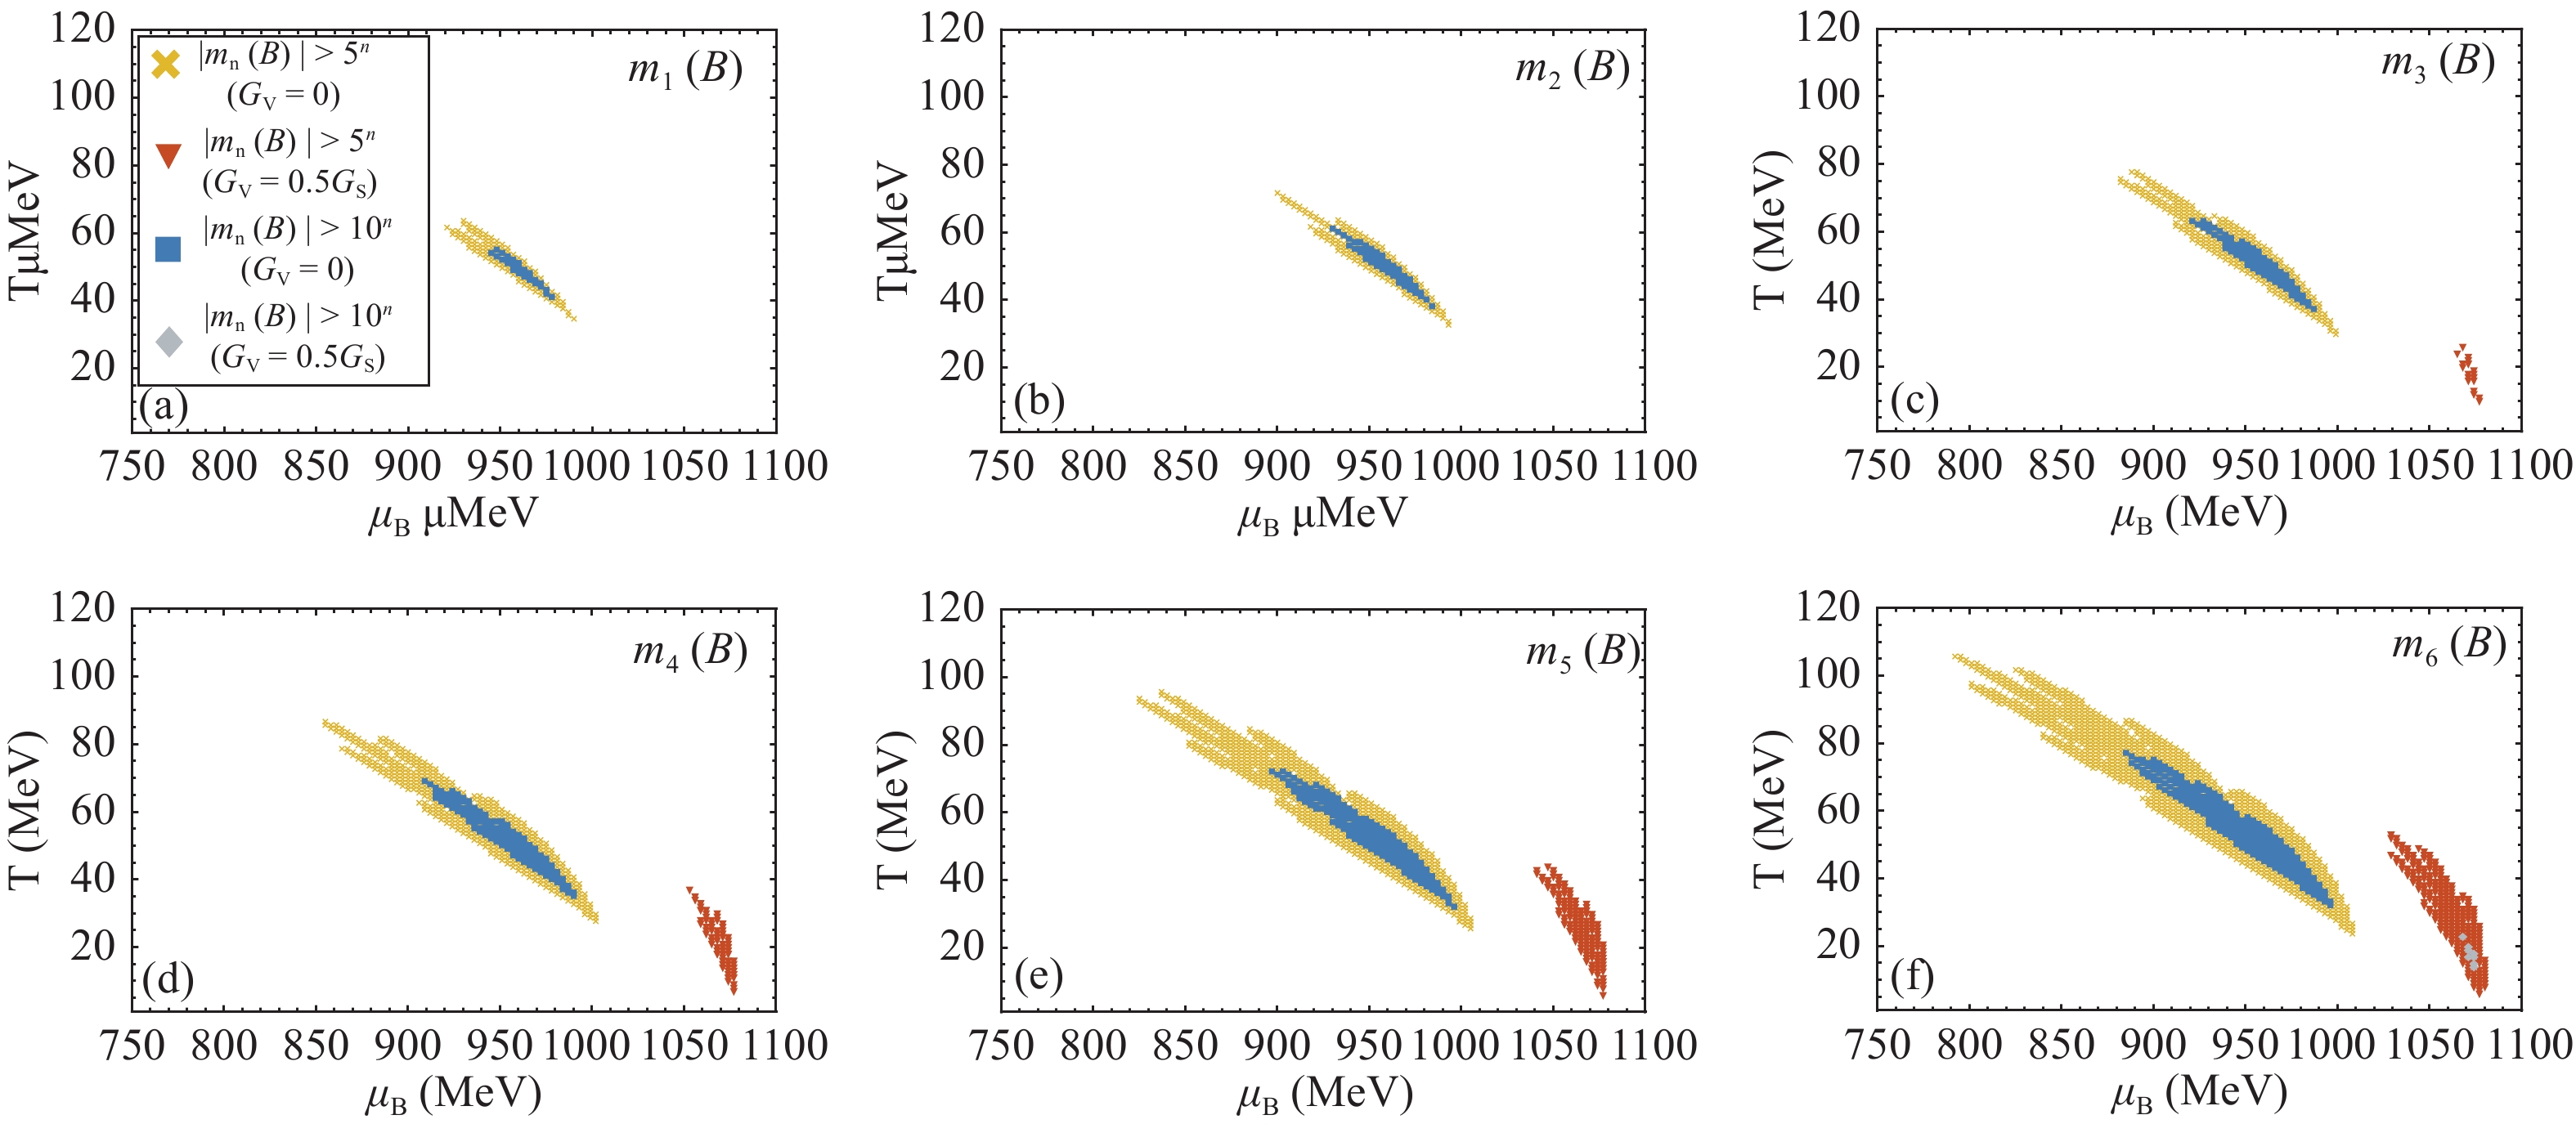
$ m_n(B) $ is greater than 5n or 10n for both cases. For the CEP case, has a large area where large signals are expected while the case with no CEP has only a small area. Besides, owing to criticality, the maximum magnitude of signals of the case with CEP can be even greater if we carefully observe the region around the CEP (in Fig. 4, the region where$ m_n(B)>10^n $ is still sizable). However, by only analyzing the magnitude of the signal in current experiments, we can not yet say if the CEP is present. Critical phenomenon or a very rapid crossover phase transition can both give large susceptibilities. However, we can perform finite size scaling analysis to identify the nature of the phase transition. The magnitude of the crossover transition signals will not depend on the volume of the system, while the critical signals will show power law dependence.
Figure 4. (color online) Region where the magnitude of
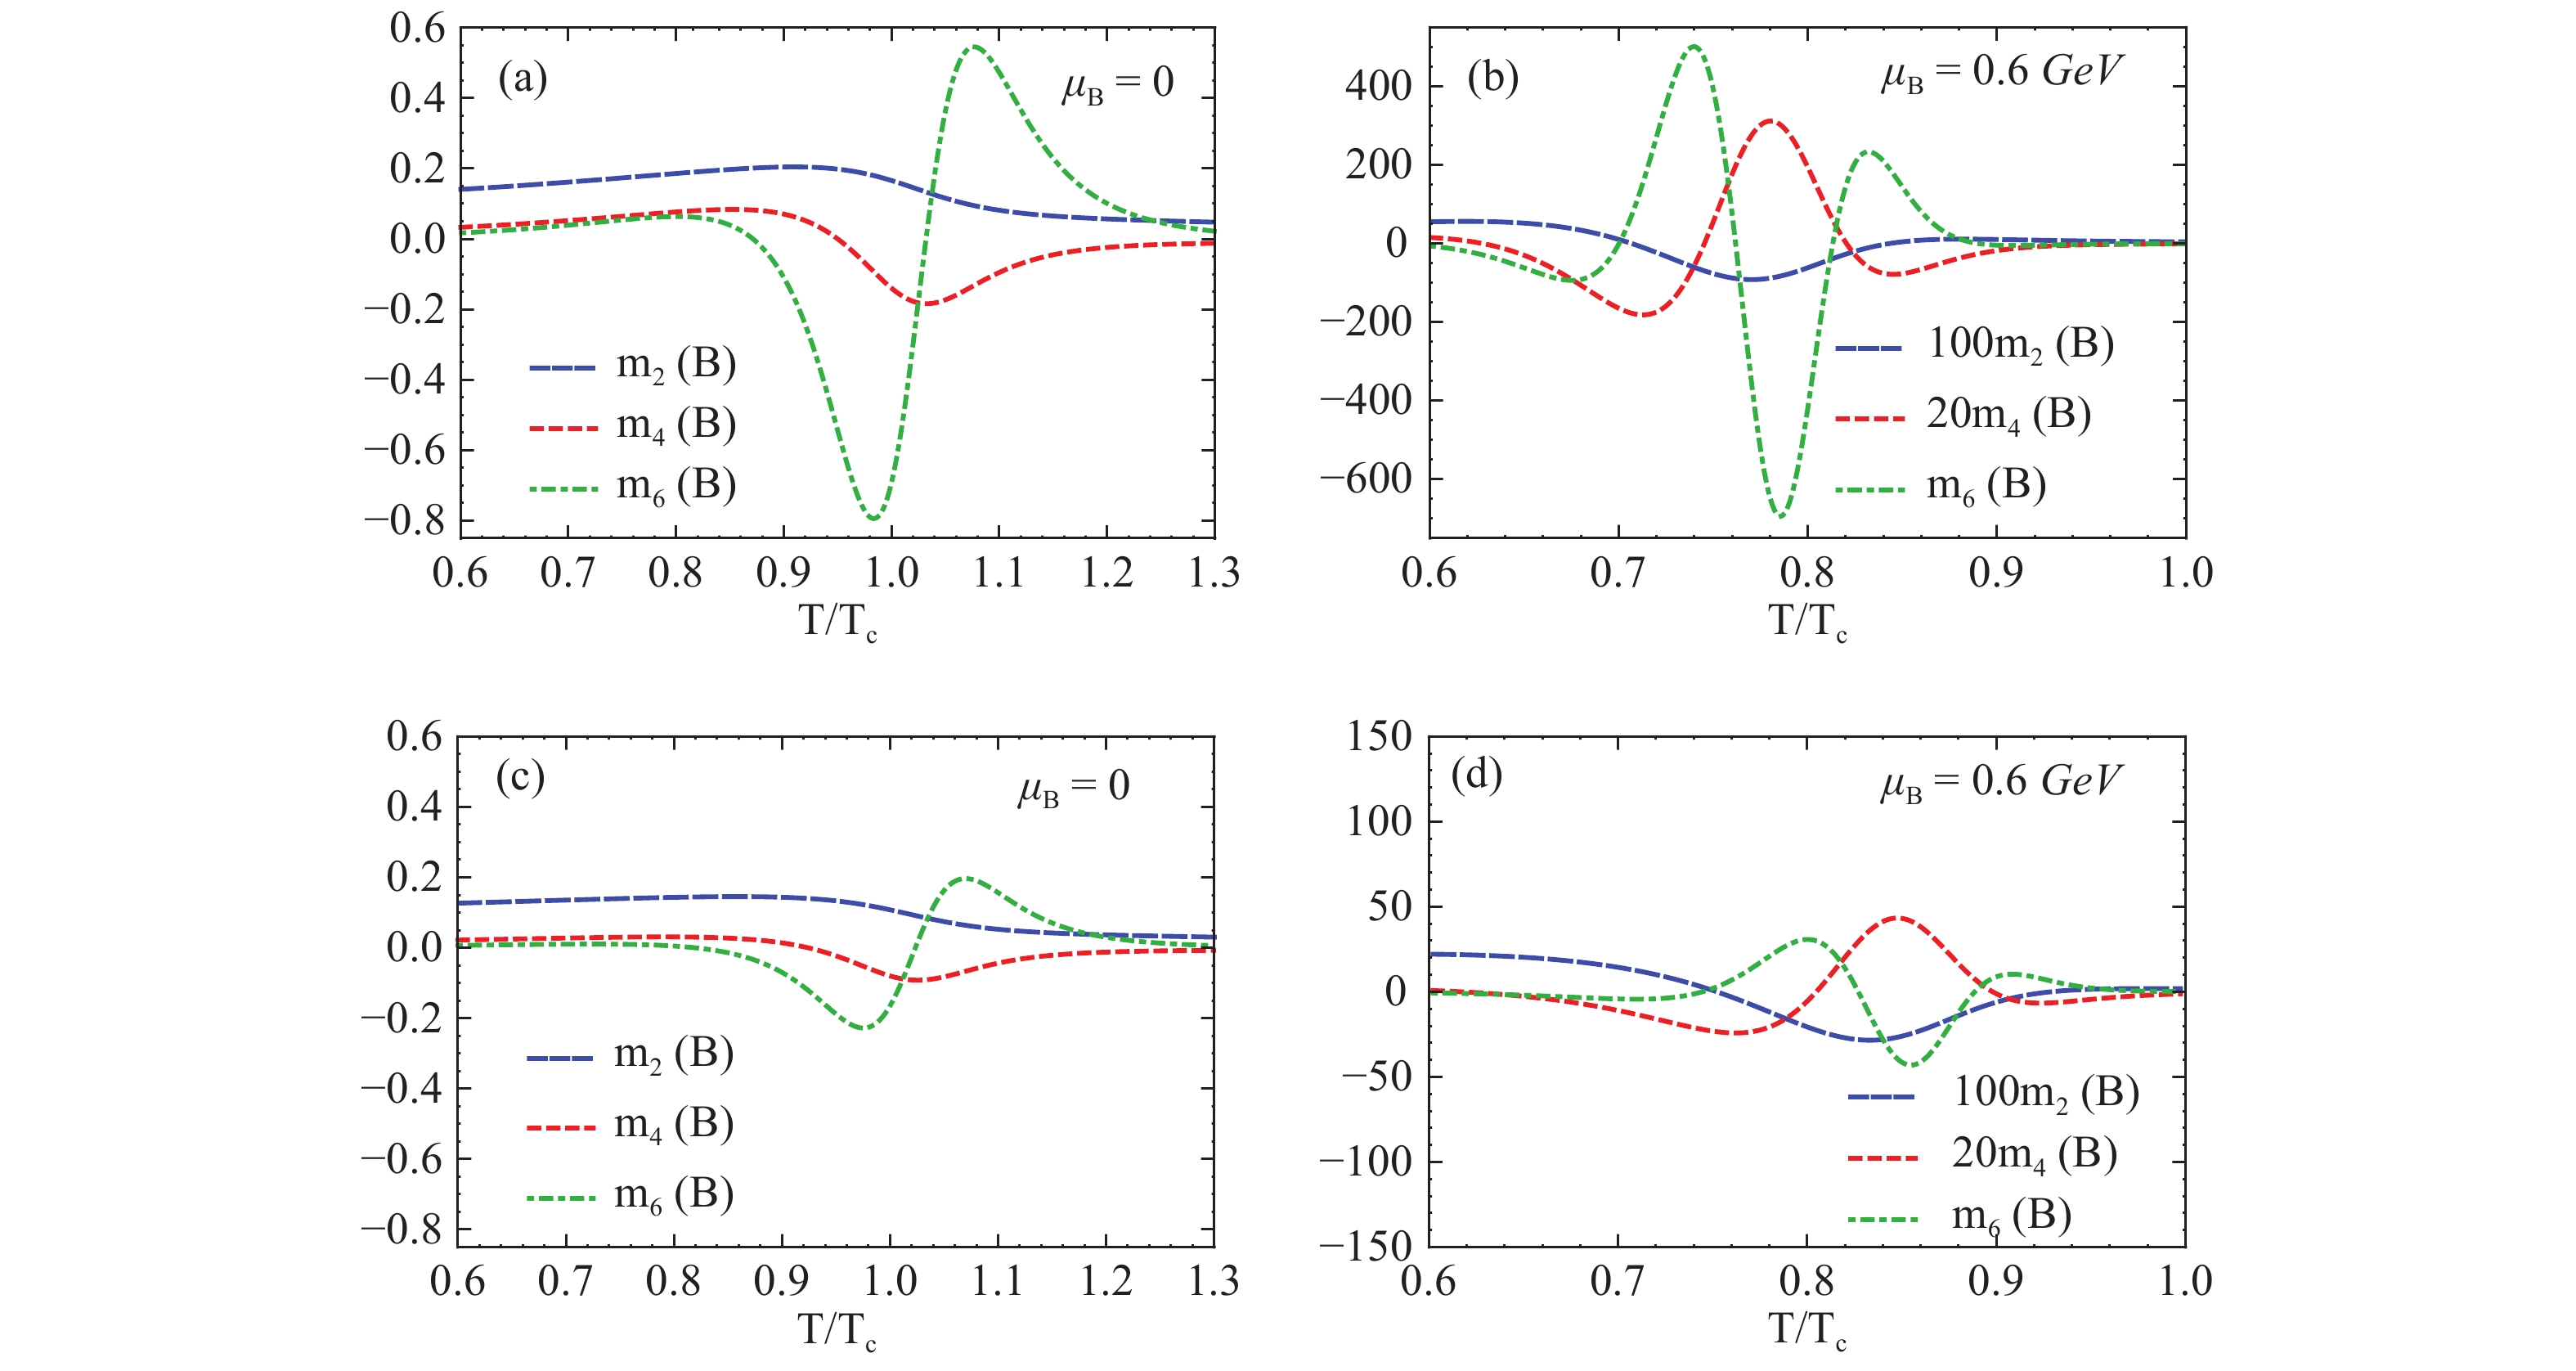
${ m_n(B)>5^n }$ (yellow crosses and red triangles) or 10n (blue squares and gray diamonds) for the two cases. The left regions indicates the GV= 0 case, and the right regions indicate GV= 0.5GS case.Fig. 5 shows various baryon number susceptibilities with fixed
$ \mu_B $ , where Tc is the critical temperature, which is approximately 170 MeV and is the transition temperature at$ \mu_B=0 $ . We can see that the susceptibilities of the two cases have very similar trend. The case with CEP will give larger susceptibilities than the case without the CEP. The sign changes are also more clearly shown here, compared with Fig. 2 and 3.
Figure 5. (color online) Susceptibilities of the two cases with different
${ \mu_B }$ . (a)${ \mu_B=0,\ G_V=0} $ (b)$ {\mu_B=0.6\ {\rm GeV}, \ G_V=0 }$ (c)${ \mu_B=0,\ G_V=0.5\,G_S }$ (d)${ \mu_B=0.6\ {\rm GeV}, \ G_V=0.5\,G_S} $ We expect our conclusion will still apply to more complicated and realistic model calculations. In Fig. 6, we calculated the baryon number moments mn(B) of the EPNJL model, which contains the confinement effect by introducing the Polyakov loop [45, 46]. We calculated the susceptibilities up to the fourth order at present as this calculation is much more slow. That is, the sign pattern of the moments is very similar to the NJL result.

Figure 6. (color online) m1(B) and m2(B) from an EPNJL calculation. Similar sign pattern as the NJL result is present. The CEP is denoted by a black dot. Parameters are taken from Ref. [46].
-
In this study, we investigated various baryon number susceptibilities up to the eighth order within the NJL model. We find that higher order susceptibilities are very sensitive and carry a large amount of information about the phase transition. The flip in the sign is closely related to the location of the phase transition, and the magnitudes of higher-order signals are generally larger. It should be very beneficial to measure higher-order fluctuations in experiments. The case with the CEP will give very large signals if we can come sufficiently close to the CEP. However, a rapid crossover transition can also yield large signals and give a similar sign pattern as it approaches the phase boundary. The two cases both agree with the phase structure given by the lattice calculation at low chemical potential [50]. Further, the sign patterns qualitatively agree with the current experimental data [13] (the comparison between the case with CEP and experiment data is provided in Ref. [28]). If we only focus on the sign of the baryon number fluctuations, we may not be able to say if the CEP is present. We need to move across the phase boundary (the possible first-order transition line) for more information and perform finite size scaling analysis to identify the nature of the phase transition. For future experimental measurements, it should be meaningful to use different kinds of ions (with different freeze-out curves) for collision to find a larger region on the phase diagram [51, 52]. If there is a CEP and all the measured data points are inside the phase boundary, we should expect a rapid increase in the magnitude of the data as we approach the phase boundary.
Probing the QCD phase structure with higher order baryon number susceptibilities within the NJL model
- Received Date: 2018-11-14
- Available Online: 2019-03-01
Abstract: Conserved charge fluctuations can be used to probe the phase structure of strongly interacting nuclear matter in relativistic heavy-ion collisions. To obtain the characteristic signatures of the conserved charge fluctuations for the quantum chromodynamics (QCD) phase transition, we study the susceptibilities of dense quark matter up to eighth order in detail, using an effective QCD-based model. We studied two cases, one with the QCD critical end point (CEP) and one without owing to an additional vector interaction term. The higher order susceptibilities display rich structures near the CEP and show sign changes as well as large fluctuations. These can provide us information about the presence and location of the CEP. Furthermore, we find that the case without the CEP also shows a similar sign change pattern, but with a relatively smaller magnitude compared with the case with the CEP. Finally, we conclude that higher order susceptibilities of conserved charge can be used to probe the QCD phase structures in heavy-ion collisions.


 Abstract
 HTML
HTML Reference
 Related
 PDF
PDF


 DownLoad: