-
Nuclear fission and its residues play significant roles in energy production, nuclear waste management, national security, and fundamental science research. The nuclear fission phenomenon was discovered more than 80 years ago. However, because of its complexity, the fully microscopic description of the fission process remains challenging. Several phenomenological methods have been developed, such as the macroscopic-microscopic (MM) + Langevin approach [1, 2], MM + Brownian motion [3], and MM + statistic model [4]. There are two popular microscopic approaches for the description of nuclear fission process, both of which are based on the effective nucleon-nucleon interactions. One is time-dependent density functional theory (TDDFT) [5–8]. In TDDFT, only one fission event is simulated, by propagating the nucleons independently. The most probable charge, mass, and total kinetic energy distributions of the fission fragments and the mean values of various fission observables can be extracted from the TDDFT calculations. The other is the time dependent generator coordinate method (TDGCM), which has been used to calculate the fission yields according to nonrelativistic Skyrme and Gogny functionals [9–14] and relativistic energy density functionals [15–17]. In the TDGCM, the nuclear wave function is described as a superposition of generator states parameterized by a vector of collective coordinates and can be applied to an adiabatic description of the entire fission process. Most applications of the TDGCM to nuclear fission dynamics have been calculated at zero temperature. In Ref. [18], the TDGCM and TDDFT are combined to model the entire process of induced fission and investigate the dynamics of low-energy-induced fission of
$ ^{240} $ Pu.The energy dependence of fission observables is an important and interesting problem. It is a key issue for nuclear applications and for the evaluation and verification of theoretical methods. One way to study the energy dependence of fission observables is to include the finite temperature effect. The fission yield distributions for neutron-induced fission with different energies studied by using semiclassical approaches with a finite temperature have been reported in Refs. [3, 19–21]. In Refs. [16, 17] the dynamics of induced fission in the framework of finite-temperature formalism based on the relativistic energy density functional were investigated. The finite-temperature Hartree-Fock-Bogoliubov (FT-HFB) methods based on nonrelativistic Skyrme and Gogny functionals [22–26] have been used for the dependence of the potential energy surface and fission barriers on the excitation energy, but the FT effects on the induced fission mass distribution have not been carried out. In our previous study [27], we examined the PES of
$ ^{240} $ Pu in the framework of zero-temperature DFT, with a focus on the effect of the pairing correlations on the fission-related observables. In the present study, we aimed to investigate the FT effects on the induced fission dynamics of$ ^{239} $ Pu (n, f). FT-DFT was used for the calculation of the PES, and the TDGCM was adopted for the study of fission yields with different energies of the incident neutron.The remainder of this paper is organized as follows. The theoretical framework is introduced in Sec. II. Calculation results and discussions are presented in Sec. III. In Sec. IV, the study is summarized, and conclusions are presented.
-
Nuclear energy density functional theory (DFT) is widely used for the study of low-energy nuclear physics and nuclear astrophysics [28–30]. The Skyrme DFT is adopted in the present study, which can give good descriptions of ground-state properties of nuclei in nearly the whole nuclear chart. One conventional way to describe the excited states of the compound fissioning nuclei is to include the finite temperature in the DFT. We list the formulations related to FT-DFT briefly here. The complete and detailed formulations can be found in Ref. [28]. At a given temperature T, the normal density ρ and pairing tensor κ can be obtained as follows:
$ \begin{aligned}[b] \rho= UfU^T+V(1-f)V^T ,~~ \kappa= UfV^T+V(1-f)U^T\,, \end{aligned} $

(1) where U and V are the matrices for the Bogoliubov transformation, and f is the Fermi-Dirac occupation factor, which is given as
$ \begin{eqnarray} f_i=\frac{1}{1+{\rm e}^{\beta E_i}}, \end{eqnarray} $

(2) where
$ \beta=1/k_BT $ , and$ k_B $ is the Boltzmann constant.$ E_i=[(\varepsilon_i-\lambda)^2+\Delta_i^2]^{1/2} $ represents the quasi-particle energy, and$ \varepsilon_i $ and$ \Delta_i $ represent equivalent single-particle energies and the pairing gap, respectively. λ denotes the Fermi level. In the finite temperature framework, when the compound nucleus is in a state of thermal equilibrium at temperature T, for the whole collective space, the thermodynamical potential relevant for deformation effects is the Helmholtz free energy$ F= E-TS $ , which is evaluated at a constant temperature T [23]. S represents the entropy of the compound nuclear system, which is given as$ \begin{equation} S = -k_B\sum\limits_i[f_i \ln f_i + (1- f_i) \ln(1-f_i)], \end{equation} $

(3) and E represents the binding energy of the deformed nucleus, which is obtained via a self-consistent finite-temperature mean-field calculation with constraints on the multipole moments.
The collective mass parameters are calculated with the perturbative cranking approximation [22, 31]
$ \begin{eqnarray} \mathcal{M}^{Cp}=\hbar^2\left[M^{(1)}\right]^{-1}\left[M^{(3)}\right]\left[M^{(1)}\right]^{-1}, \end{eqnarray} $

(4) with the moments computed as [32]
$ \begin{eqnarray} M^{(K)}_{\alpha\beta} =2\sum\limits_{\mu<\nu} \frac{ (U^{T}Q_{\alpha}V + V^{T}Q_{\alpha}U)_{\mu\nu}(U^{T}Q_{\beta}V + V^{T}Q_{\beta}U)_{\mu\nu}}{(E_{\mu}+E_{\nu})^{K}}, \end{eqnarray} $

(5) at zero temperature and
$ \begin{aligned}[b] M^{(K)}_{\alpha\beta}=&\sum\limits_{\mu<\nu}\frac{ (U^{T}Q_{\alpha}U - V^{T}Q_{\alpha}V)_{\mu\nu}(U^{T}Q_{\beta}U - V^{T}Q_{\beta}V)_{\mu\nu}}{(E_{\mu}-E_{\nu})^{K}}\\ &\times\left[ \tanh \left(\frac{E_{\mu}}{2k_BT}\right) - \tanh \left(\frac{E_{\nu}}{2k_BT}\right) \right]\\ &+\sum\limits_{\mu<\nu}\frac{ (U^{T}Q_{\alpha}V + V^{T}Q_{\alpha}U)_{\mu\nu}(U^{T}Q_{\beta}V + V^{T}Q_{\beta}U)_{\mu\nu}}{(E_{\mu}+E_{\nu})^{K}}\\ &\times\left[ \tanh \left(\frac{E_{\mu}}{2k_BT}\right) + \tanh \left(\frac{E_{\nu}}{2k_BT}\right) \right],\\[-12pt] \end{aligned} $

(6) for the finite-temperature counterpart [16, 22, 33, 34]. To avoid numerical divergence, a smooth factor of 1.0 is added [22] to the above formula when two quasi-particle energies are too close for the temperature dependent moment.
To calculate the pre-neutron fission fragment distributions of the neutron-induced fission for
$ ^{239} $ Pu, we use the time-dependent generator coordinate method (TDGCM) in the Gaussian overlap approximation (GOA). In the TDGCM+GOA, nuclear fission is modeled as a slow adiabatic process driven by only a few collective degrees of freedom [10]. The dynamics is described by a local, time-dependent Schr$ \rm\ddot{o} $ dinger-like equation in the space of collective coordinates q.$ \begin{equation} {\rm i}\hbar\frac{\partial g( {q},t)}{\partial t}=\hat{H}_{\mathrm{coll}}( {q})g( {q},t). \end{equation} $

(7) The Hamiltonian
$ \hat{H}_{\mathrm{coll}}( {q}) $ reads$ \begin{equation} \hat{H}_{\mathrm{coll}}( {q})=-\frac{\hbar^2}{2}\sum\limits_{ij}\frac{\partial}{\partial q_i}B_{ij}( {q})\frac{\partial}{\partial q_i}+V( {q}), \end{equation} $

(8) where
$ V( {q}) $ represents the collective potential, and the inertia tensor$ B_{ij}( {q})=\mathcal{M}^{-1}( {q}) $ is the inverse of the mass tensor$ \mathcal{M} $ . Both the potential and mass tensor are determined via microscopic self-consistent mean-field calculations using the Skyrme DFT in this study.$ g( {q},t) $ is the complex wave function of the collective variables$ {q} $ . In the present case, the variable$ {q} $ corresponds to the quadrupole$ \langle Q_{20}\rangle $ and octupole$ \langle Q_{30} \rangle $ mass multipole moments. For the initial state of the time evolution, the mean energy of the$ \hat{H}_{\mathrm{coll}} $ , i.e.,$\langle g( {q},t=0) |\hat{H}_{\mathrm{coll}} |g( {q},t=0) \rangle= E_{\mathrm{coll}}$ is usually adjusted to be 1 MeV above the highest fission barrier$ E_b $ .For the description of fission, the collective space is divided into an inner region with a single nuclear density distribution and an external region that contains the two fission fragments. The set of scission configurations defines the hyper-surface that separates the two regions. The flux of the probability current through this hyper-surface provides a measure of the probability of observing a given pair of fragments at time t. The integrated flux
$ F(\xi,t) $ for the surface element ξ on the scission hyper-surface is calculated as follows:$ \begin{equation} F(\xi,t)=\int^{t}_{t=0}{\rm d}t\int_{ {q}\epsilon\xi} {J}( {q},t)\cdot {\rm d} {S}, \end{equation} $

(9) as in Ref. [10], where
$ {J}( {q},t) $ represents the current$ \begin{equation} {J}( {q},t)=\frac{\hbar}{2i} {B(q)}[g^{*}( {q},t)\nabla g( {q},t)- g( {q},t)\nabla g^{*}( {q},t)]. \end{equation} $

(10) The yield of a fission fragment with mass number A can be calculated as
$ \begin{equation} Y(A)=C\sum\limits_{\xi \epsilon \mathcal{A}} \lim\limits_{t\rightarrow +\infty}F(\xi,t), \end{equation} $

(11) where
$ \mathcal{A} $ denotes a set of all surface elements ξ on the scission hypersurface with fragment mass A, and C is the normalization constant to ensure that the total yield is normalized to 200 as usual. -
In this study, the PES calculations are carried out with the DFT solver HFBTHO (v3.00) [32] at the finite-temperature framework with SkM* [35] parametrization of the Skyrme DFT, which is a popular choice for nuclear fission studies. The pairing correlation is incorporated via the Hartree-Fock-Bogoliubov (HFB) method . The surface-volume pairing force is used [36]. 31 major harmonic-oscillator shells are used as the basis. A pairing window with a 60 MeV cutoff is adopted. The paring strength for the neutron and the proton are –265.25 and –340.06 MeV, respectively, which are obtained via fitting to the three-point odd-even mass difference in
$ ^{240} $ Pu [37].In the case of the neutron-induced fission, the internal excitation energy
$ E_{\mathrm{int}} $ of the fissioning system is$ E_n $ +$ B_n $ , where$ E_n $ represents the kinetic energy of the incident neutron, and$ B_n $ represents the one-neutron separation energy of the compound nucleus. For$ ^{240} $ Pu,$ B_n $ is 6.53 MeV. The$ E_{\mathrm{int}} $ of a nucleus at temperature T is defined as the difference between the energy minimum at temperature T and that at$ T=0 $ . We choose to study the temperatures T = 0.58, 0.68, 0.77, and 1.01 MeV in the FT-DFT, which correspond to the neutron-induced fission reaction of$ ^{239} $ Pu with$ E_n $ ($ E_{\mathrm{int}} $ ) of 2.53$ \times10^{-8} $ (6.53), 2.72 (9.25), 5.5 (12.03), and 15 (21.53) MeV, respectively. The reason for this selection is the existence of the quality fragment mass distribution data for these incident neutron energies. -
The precise calculation of the multi-dimensional PES of the compound nucleus in the collective space is important for the study of the nuclear fission. We choose the quadruple moment
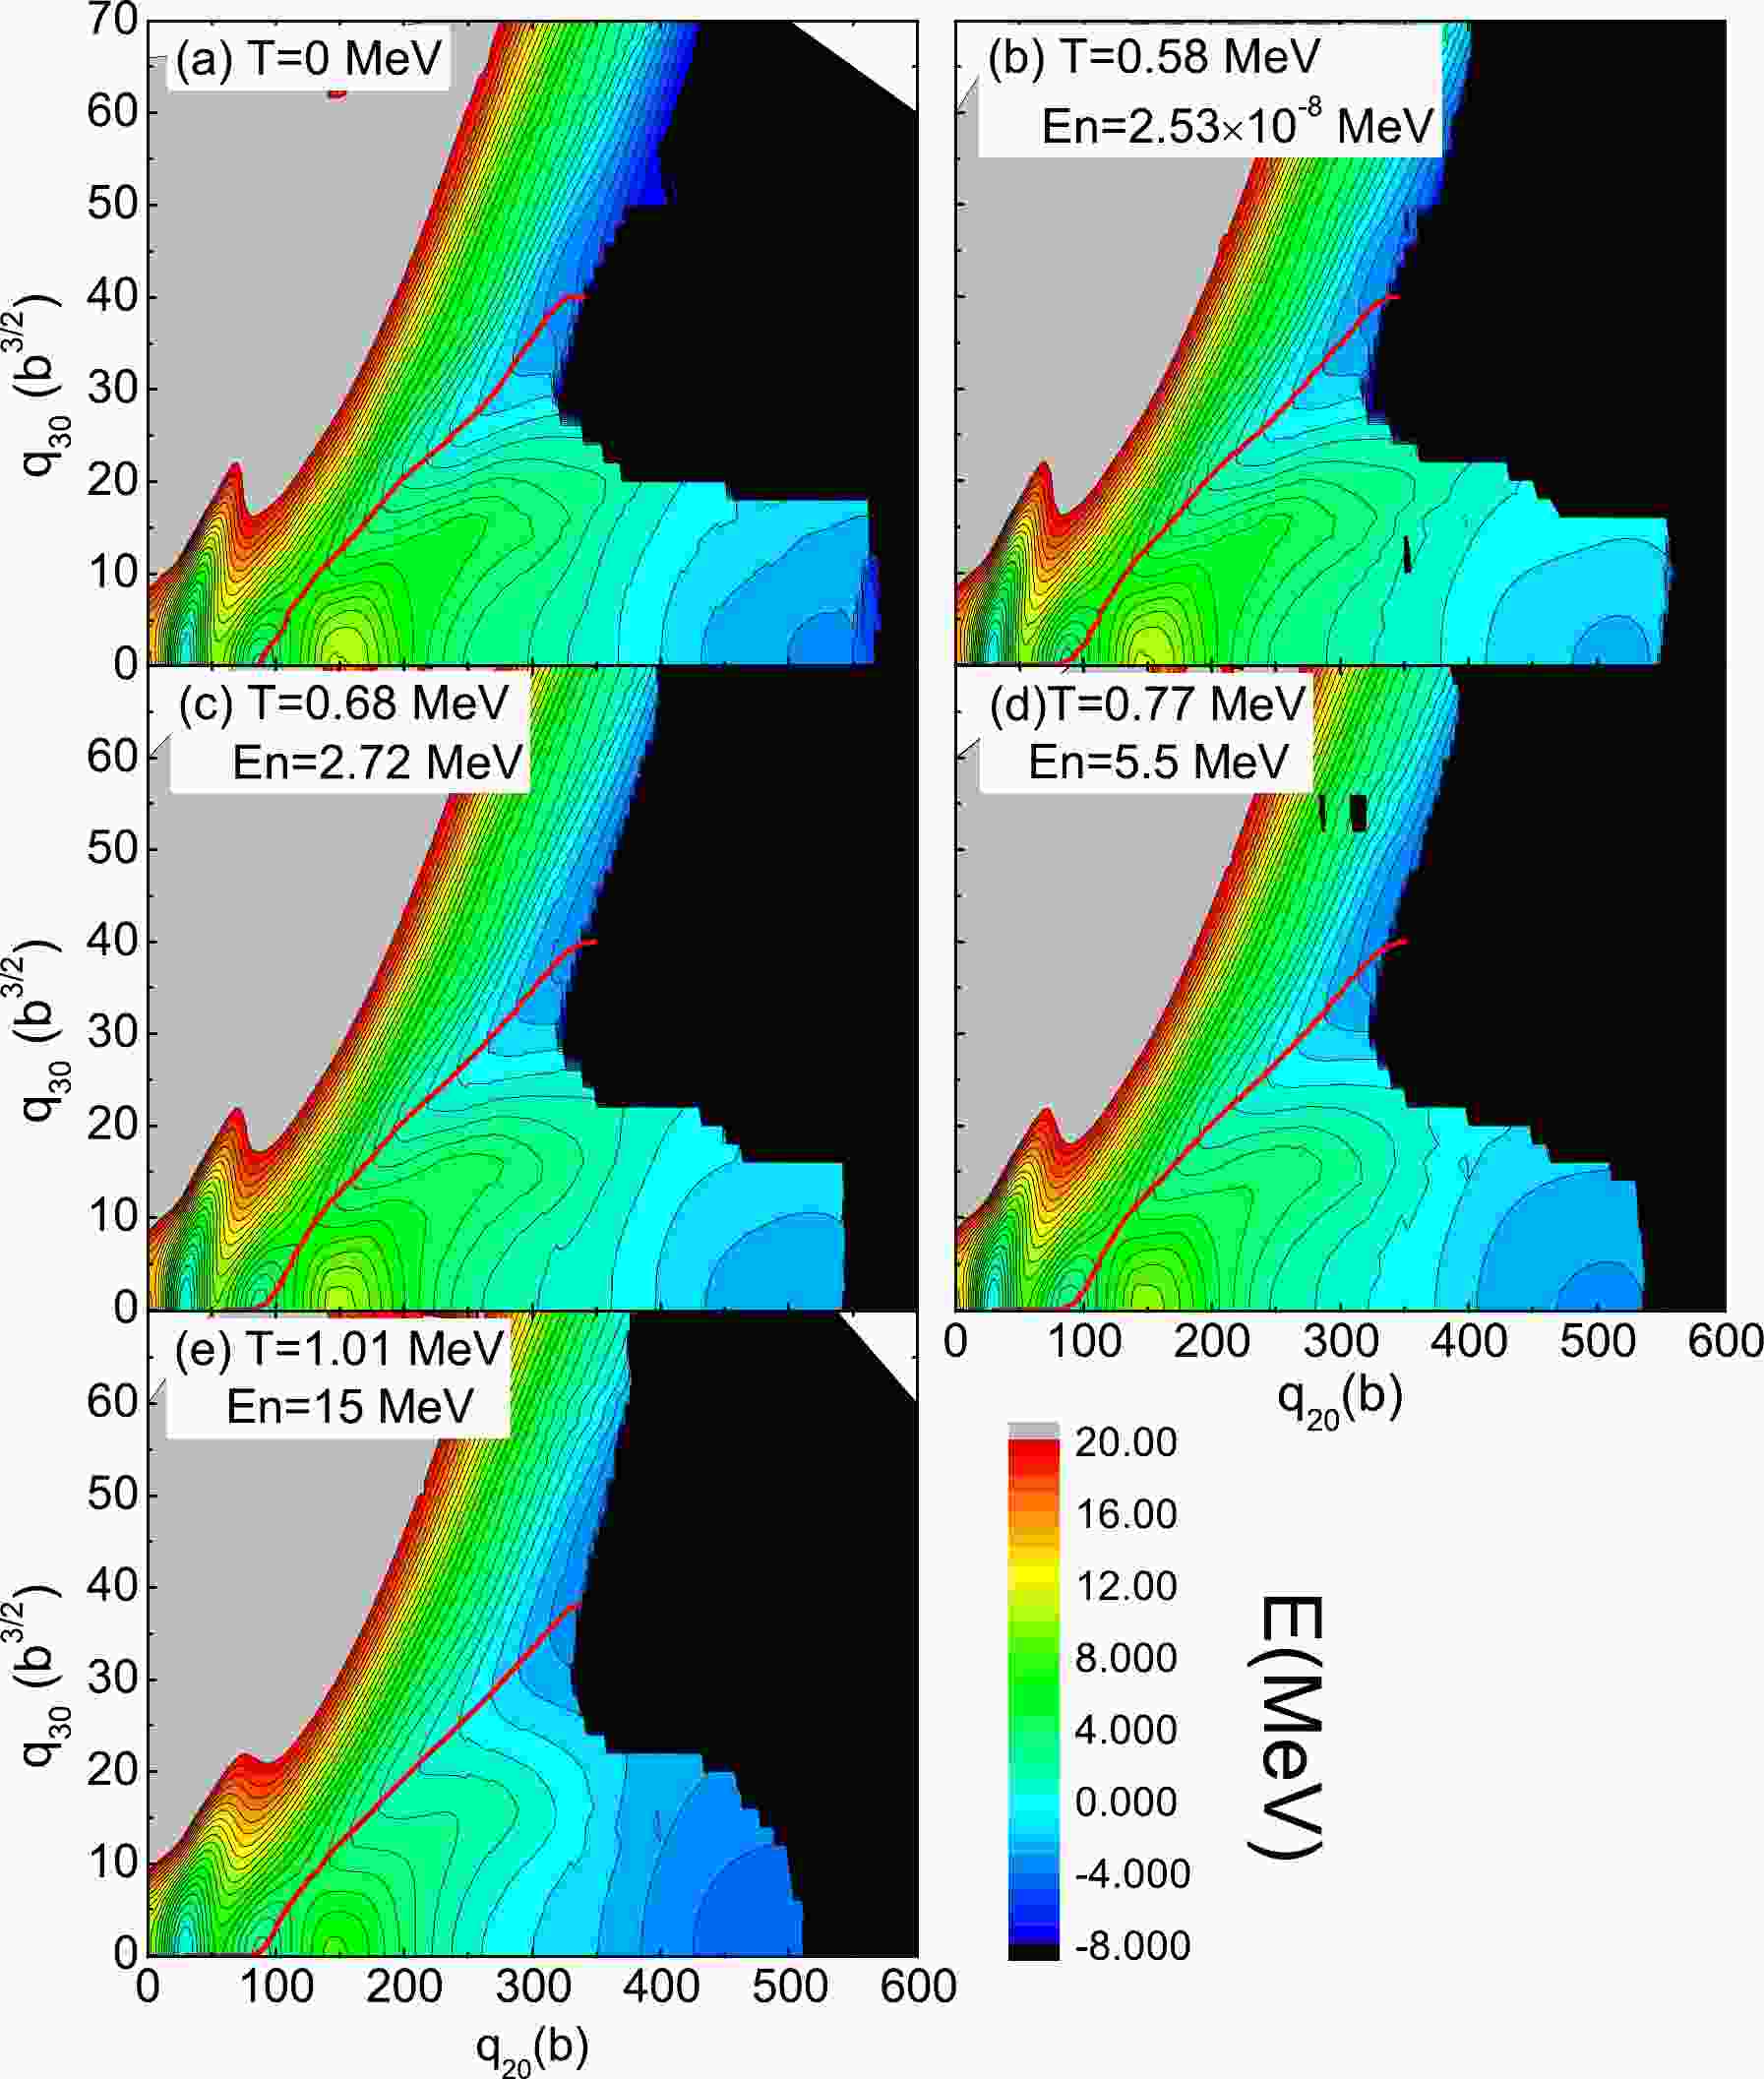
$ q_{20} $ and the octuple moment$ q_{30} $ as the collective variables, which are the most important collective degrees of freedom for the nuclear fission study. Axial symmetry is always assumed. The range of the collective variables for$ ^{240} $ Pu calculation is 0 b to 600 b for$ q_{20} $ and 0 b$ ^{3/2} $ to 70 b$ ^{3/2} $ for$ q_{30} $ . The mesh steps are$ \Delta q_{20} $ = 2 b and$ q_{30} $ = 2 b$ ^{3/2} $ , respectively. The two-dimensional PESs of the free energy is shown in Fig. 1 with temperatures T = 0.58, 0.68, 0.77, and 1.01 MeV, together with the case of$ T=0 $ for the sake of comparison.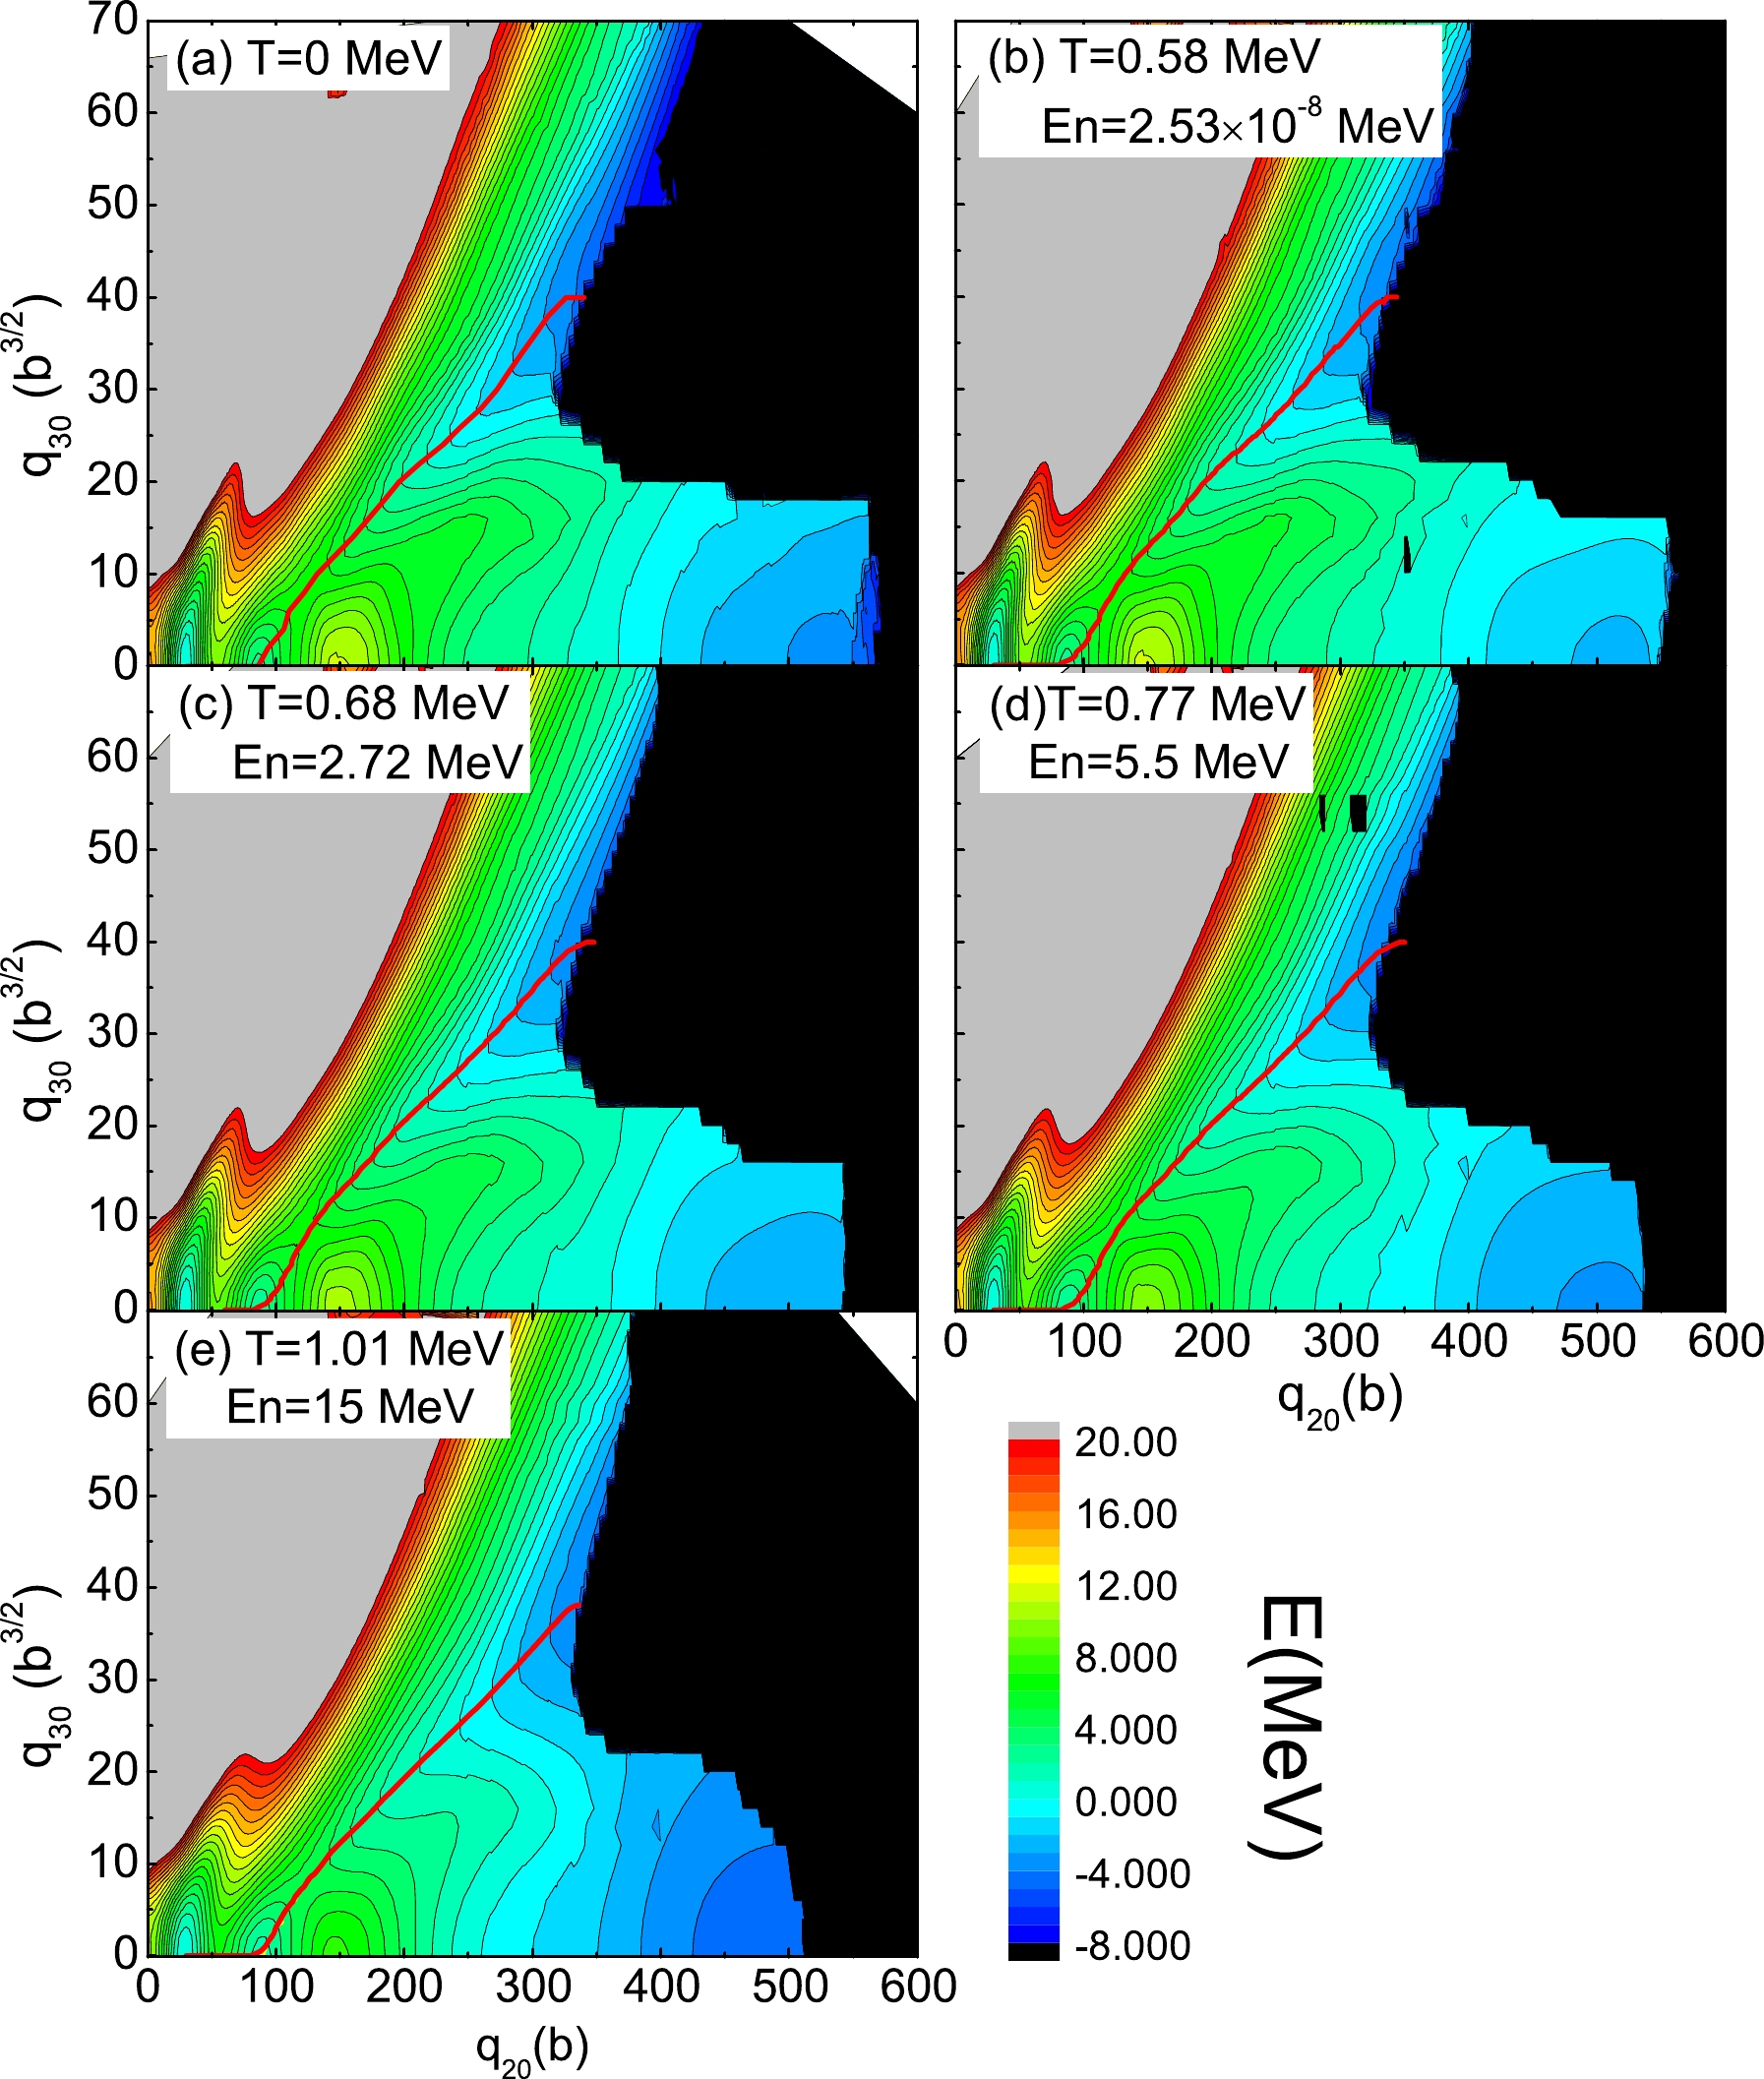
Figure 1. (color online) Free energy F of
$^{240}$ Pu in the ($q_{20}$ ,$q_{30}$ ) plane for a finite-temperature calculated with the SkM*-DFT with T = 0, 0.58, 0.68, 0.77, and 1.01 MeV. In each panel, energies are given relative to the ground state energy. The least-energy fission pathway is given as the solid red curve. The contours join points on the surface with the same energy, and the contour interval is 1.0 MeV.In general, there is no obvious difference in the topological properties of PESs at various temperatures. All calculations predict the same deformation point for the ground state (
$ q_{20} $ =30 b,$ q_{30} $ =0 b$ ^{3/2} $ ), for the isomeric state ($ q_{20} $ =86 b,$ q_{30} $ = 0 b$ ^{3/2} $ ), and for the inner barrier ($ q_{20} $ =54 b,$ q_{30} $ =0 b$ ^{3/2} $ ). For all these temperatures, double-humped fission barriers are predicted, an inner symmetric fission barrier is followed by an outer asymmetric one, and the least-energy fission pathways are all asymmetric fission (red lines in Fig. 1). The symmetric and asymmetric fission valleys are all separated by a ridge from ($ q_{20} $ ,$ q_{30} $ ) = (150 b, 0 b$ ^{3/2} $ ) to (350 b, 20 b$ ^{3/2} $ ).The free energy of compound nucleus
$ ^{240} $ Pu of the symmetric fission pathway (a) and the least-energy fission pathway (b) as functions of quadrupole moment$ q_{20} $ for the different temperatures are shown in Fig. 2. At low temperatures ($ T \leqslant 0.68 $ MeV), the fission barrier heights and isomeric-state energy do not differ significantly from the zero-temperature ones. The barrier heights and the energies of the isomeric state decrease explicitly when the temperature is higher than T = 0.68 MeV, but the same equilibrium shape of the nucleus observed at$ T=0 $ is kept at these higher temperatures. In Fig. 2(a), in the symmetric fission channel, it is seen that a smaller quadruple moment is needed for the occurrence of the scission for high temperatures. However, for the least-energy fission pathway shown in Fig. 2(b), the quadruple moments required for the scission do not differ significantly in the temperature range of this study.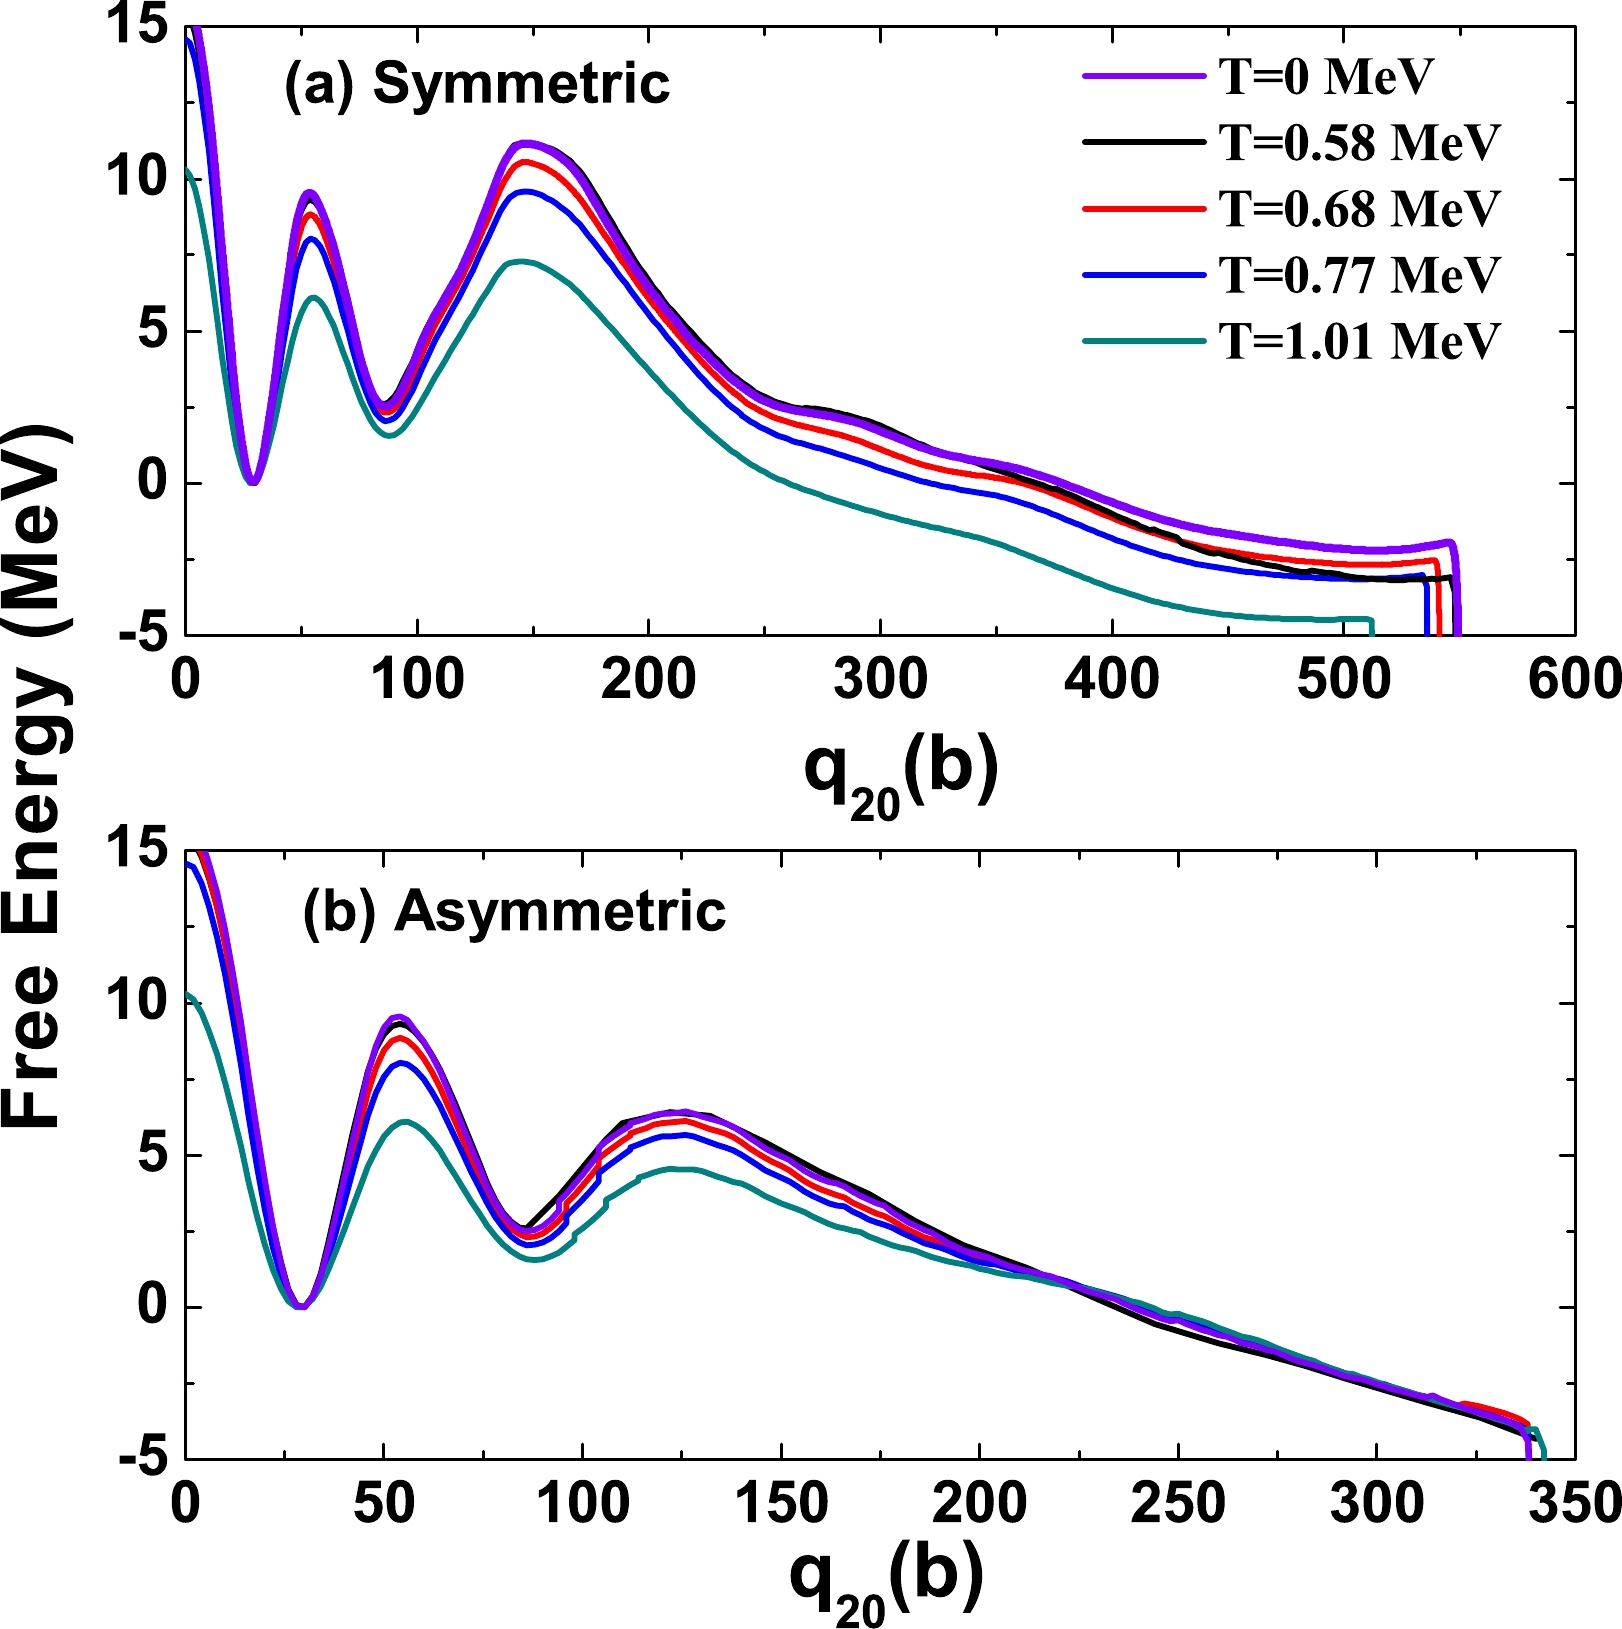
Figure 2. (color online) The energies along the symmetric and least-energy fission pathways in
$^{240}$ Pu, with different temperatures, are shown in panels (a) and (b), respectively. All these energies are relative to their ground-state values.The temperature dependence of the fission barrier can be described with the damping factor
$ \gamma_D $ . Derived from Fig. 2, for$ T \; \geq $ 0.68 MeV, the height of the inner fission barrier is damped exponentially as$E_B \propto {\rm e}^{-\gamma_{D}E}$ with$ \gamma_{D}=0.031 $ MeV$ ^{-1} $ . The value of$ \gamma_D $ has a wide range. In the study of compound superheavy nuclei reported in Ref. [37] ,$ \gamma_D $ was 0.033 MeV$ ^{-1} $ for$ ^{292} $ 114, and it was 0.093 MeV$ ^{-1} $ for$ ^{278} $ 112 from the calculation within the framework of FT-HFB. In a theoretical study of the formation of superheavy nuclei in the cold fusion reaction,$ \gamma_D $ was found to be 0.05$ \sim $ 0.12 MeV$ ^{-1} $ [38]. -
To investigate the variation of single particle energies (SPEs) with respect to the temperature, the neutron and proton canonical single-particle energies (SPE) at the inner and outer fission barrier are examined, as shown in Fig. 3. The results at T =
$ 0,\; 0.58, \; 0.77 $ , and$ 1.01 $ MeV are shown. In general, at lower SPEs, the gaps are larger, and the levels become dense at higher SPEs. The deformations of the inner barrier are the same for all these temperatures. At low temperatures, the SPEs behave similarly to the zero-temperature SPEs. When the temperature increases, particularly for T =$ 1.01 $ MeV, the gaps between SPEs become small, indicating the weakening of the shell effect. For the outer barrier, the deformations are different in the zero-temperature and finite-temperature DFT. Thus, small discrepancies occur at low temperatures, and the level density increases with the temperature.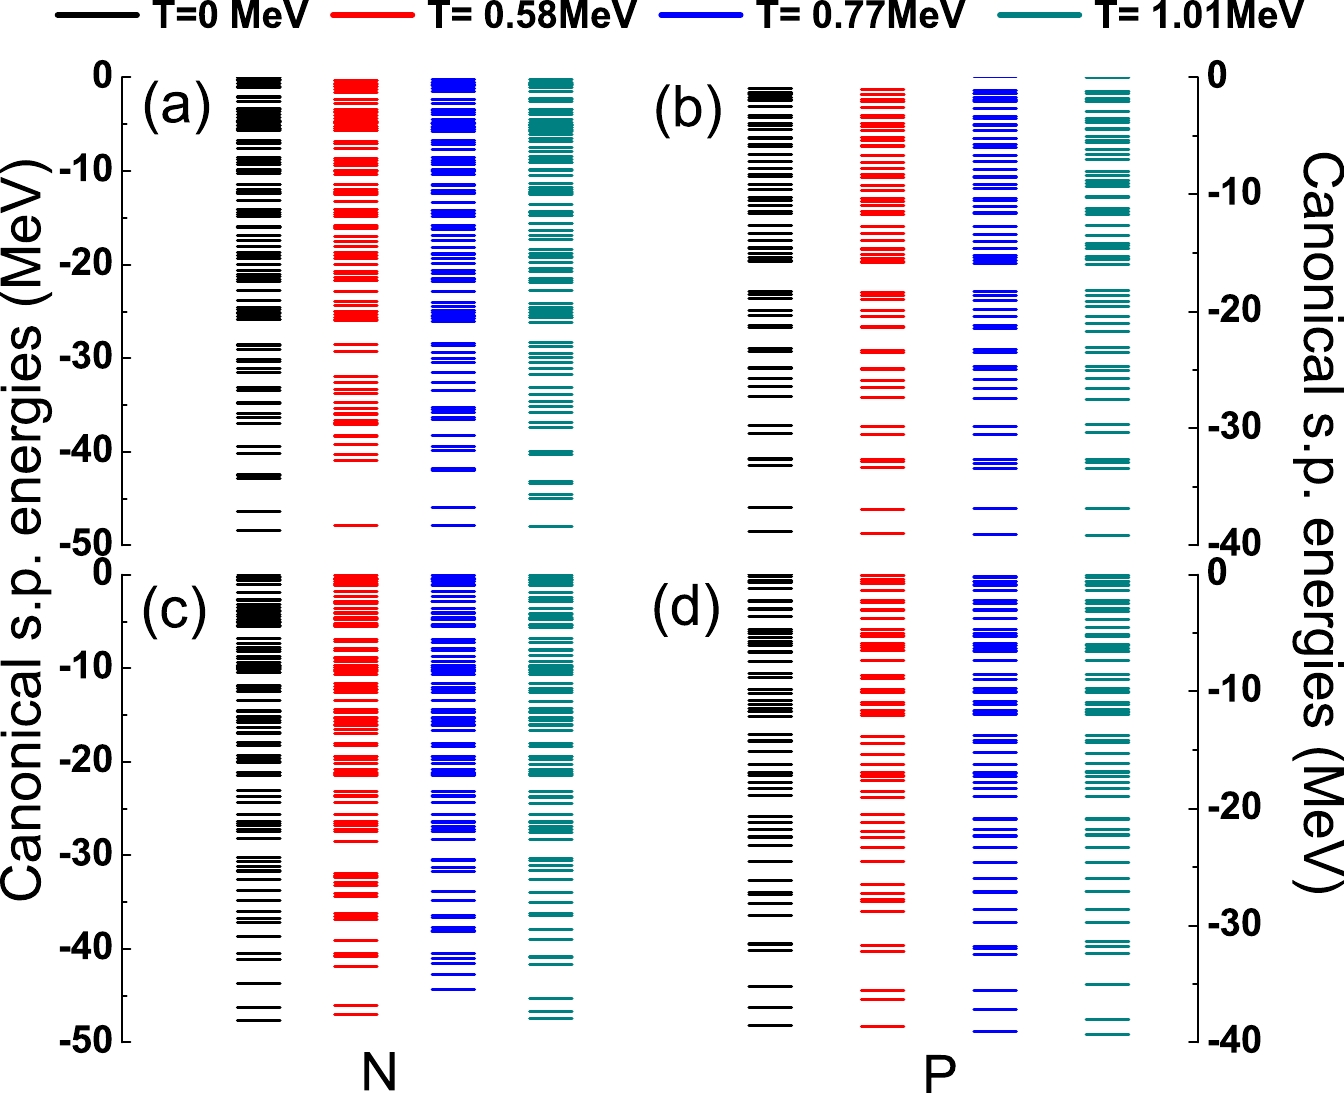
Figure 3. (color online) Canonical single particle energies calculated via DFT. The left panels are for the neutron SPEs, and the right panels are for the proton SPEs. The upper panels show the results for the inner barrier, and the bottom panels show the results for the outer barrier. Different coloured lines indicate the different temperatures. The deformations of the inner barrier are the same (
$q_{20}$ =54 b,$q_{30}$ =0 b$^{3/2}$ ) for all these temperatures, but the deformations of the outer barrier are different in the zero-temperature ($q_{20}$ =122 b,$q_{30}$ =8 b$^{3/2}$ ) and FT-DFT ($q_{20}$ =126 b,$q_{30}$ =8 b$^{3/2}$ ). -
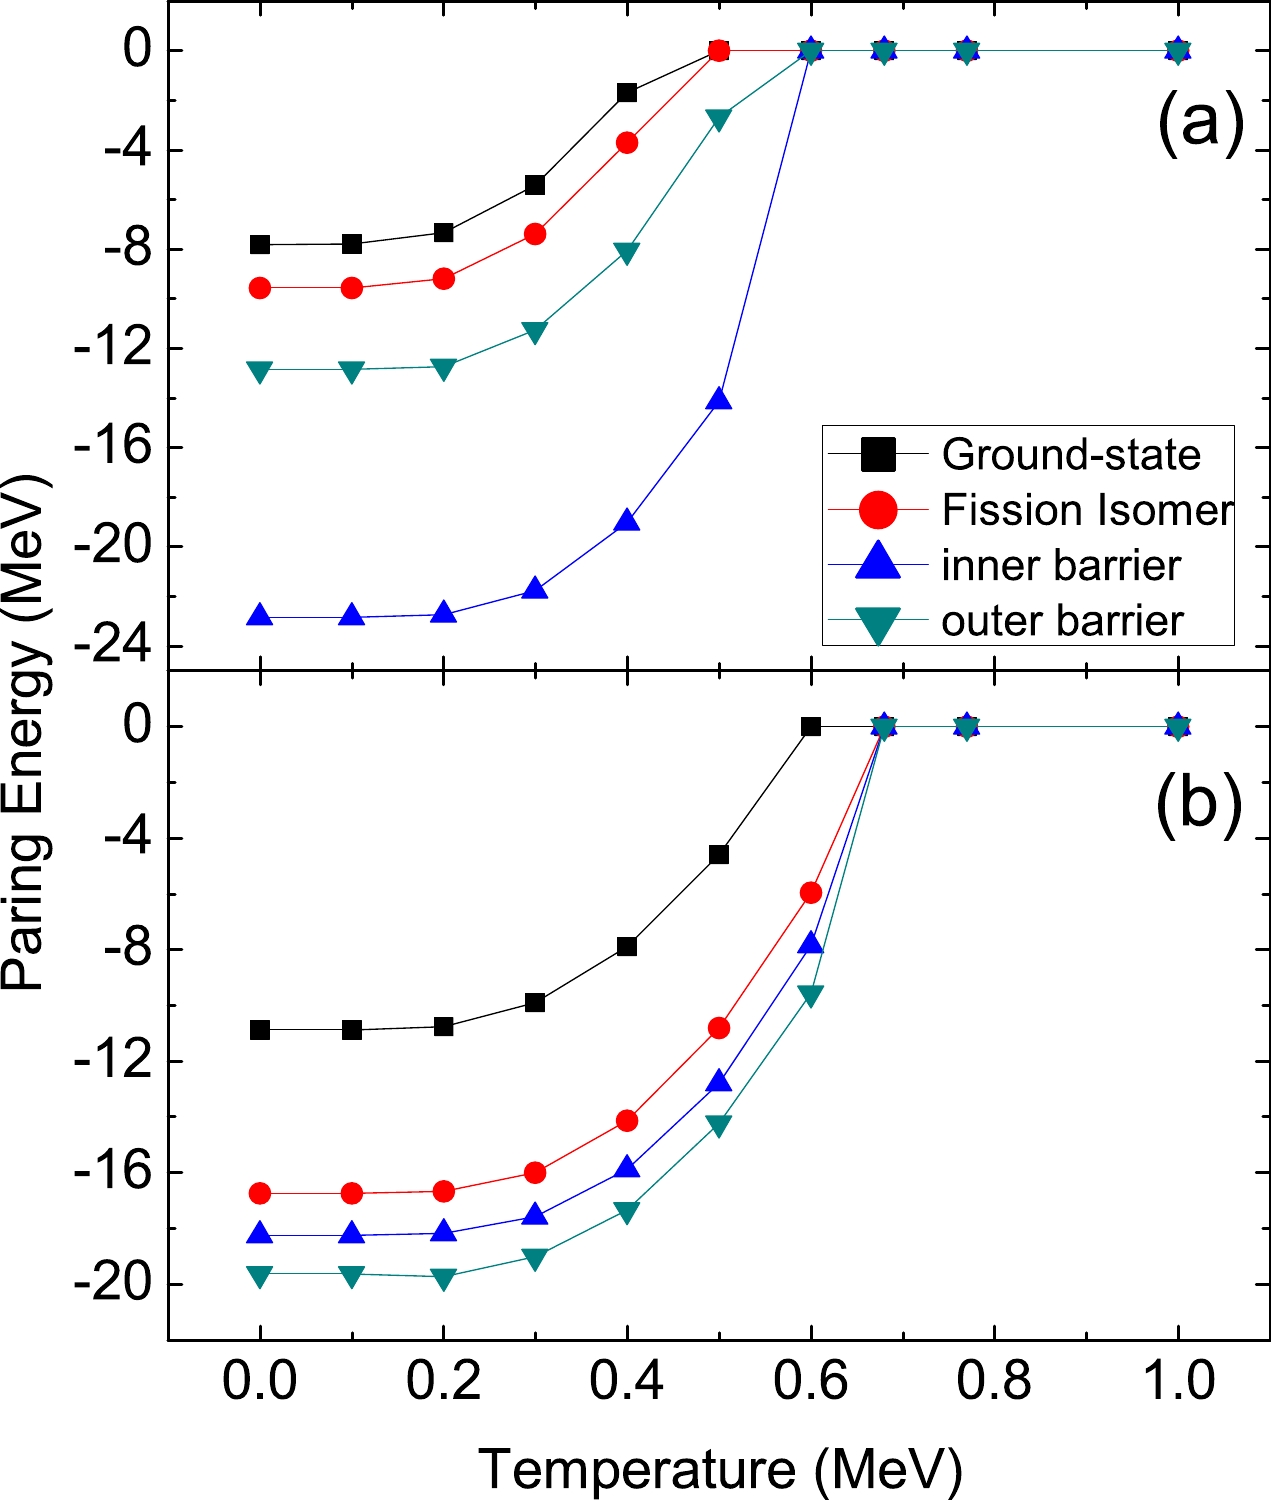
In Fig. 4, we plot the paring energies of the neutron and the proton as a function of the temperature for the ground state, isomeric state, inner barrier, and outer barrier of
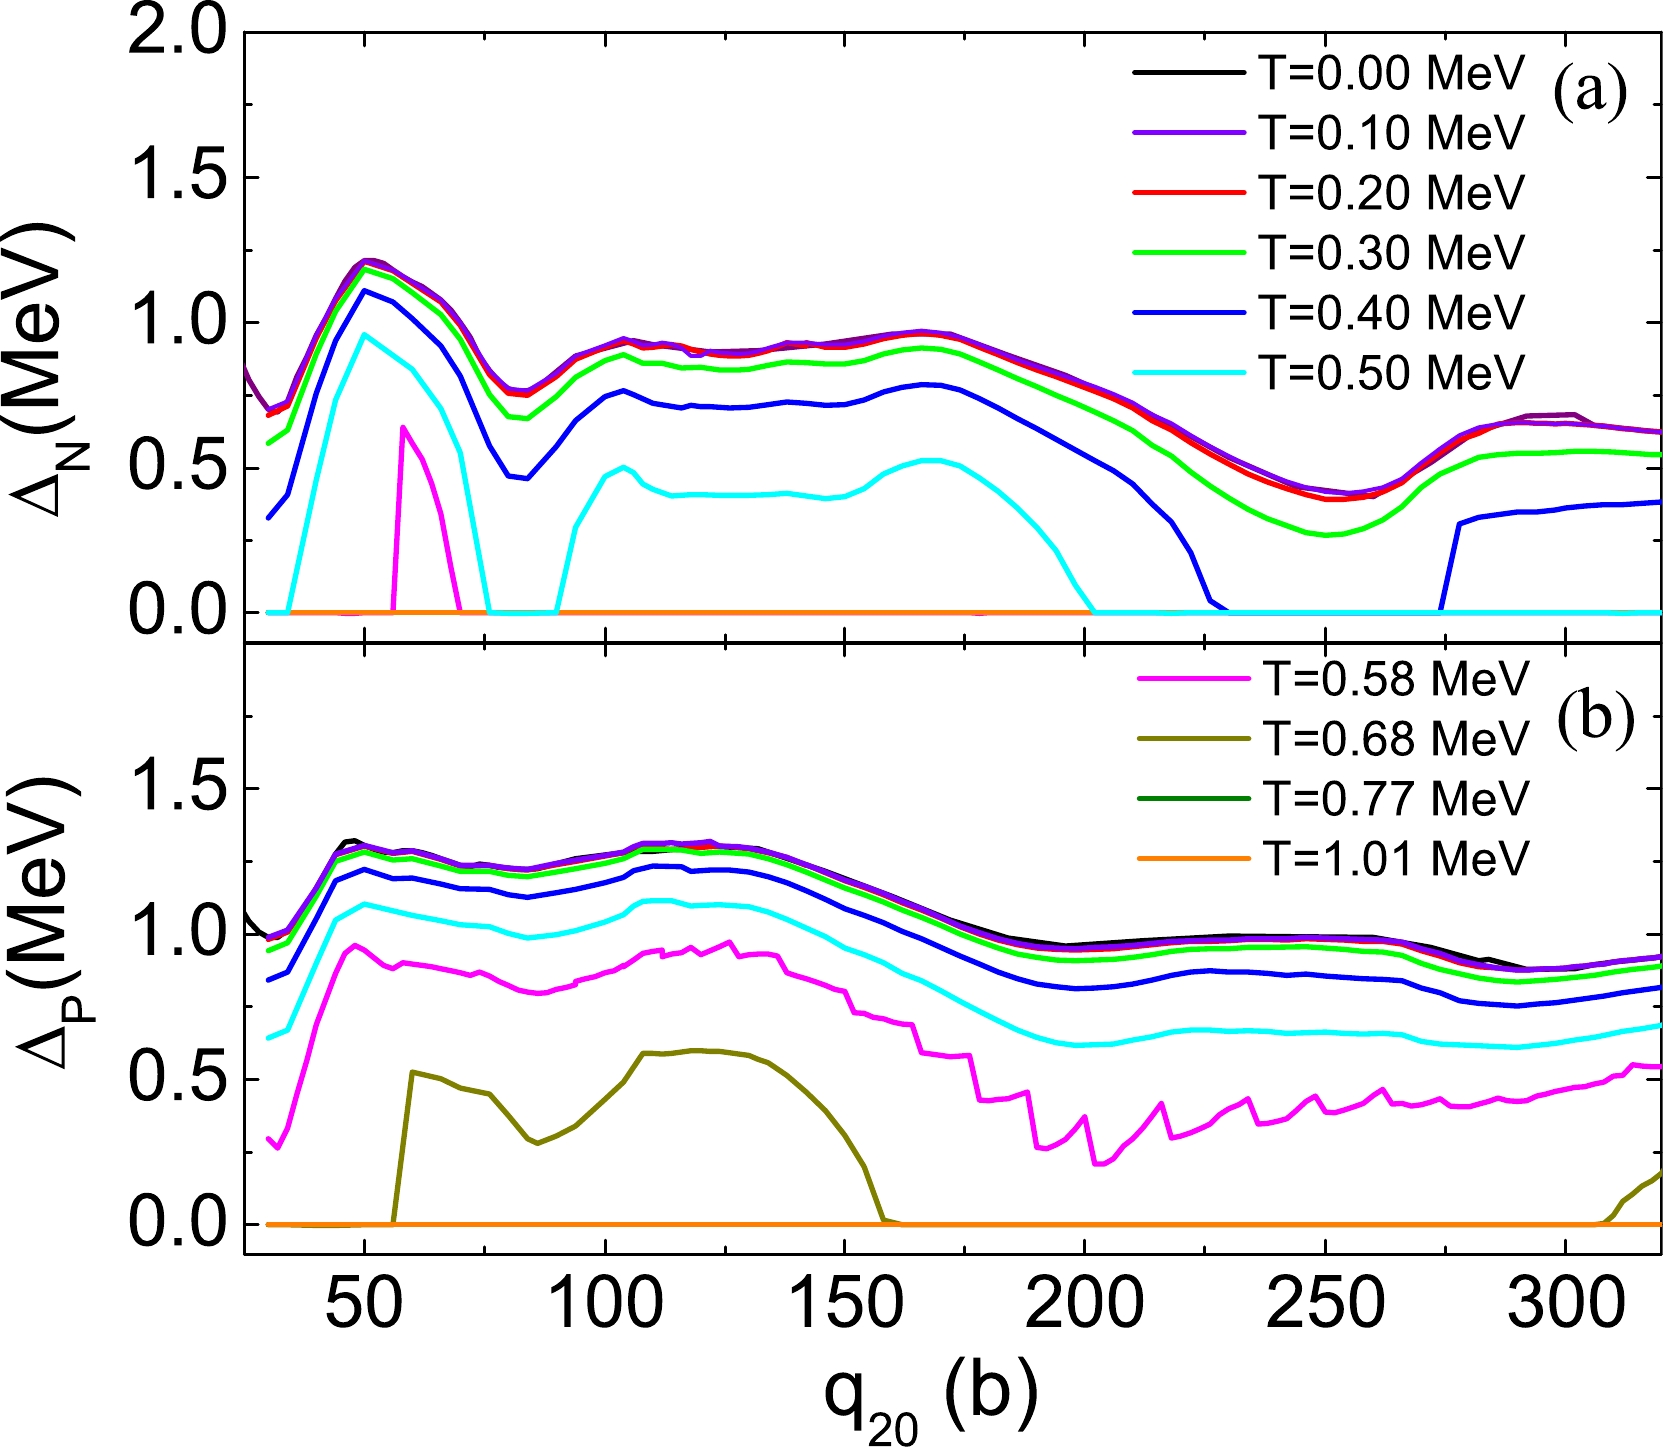
$ ^{240} $ Pu. At low temperatures, the variations of the pairing energies are small. However, the paring energies exhibit a rapid decrease with an increase in the temperature when$ T>0.3 $ MeV. The pairing energy vanishes completely beyond T = 0.6 MeV for the neutron and 0.7 MeV for the proton. The neutron and the proton paring gaps along the least-energy fission path as a function of quadruple moments are plotted in Fig. 5 for different temperatures. When$ T<0.3 $ MeV, the neutron and proton pairing gaps are close to the zero-temperature ones. When the temperature increases (>0.3 MeV), the pairing gaps decrease rapidly. The decrease in the neutron pairing gap is faster than that in the proton pairing gap. At temperatures of >0.58 MeV, the neutron pairing gaps vanish for most quadruple moments, and for$ T> $ 0.68 MeV, the vanishing of the proton gaps occurs for most deformations. Thus, for the current study of$ ^{240} $ Pu, there are no pairing correlations for the cases of$ T= $ 0.77 MeV ($ E_n $ =5.5 MeV) and 1.01 MeV ($ E_n $ =15 MeV). -
For the description of the fission dynamics, the determination of the scission frontier is very important. The scission frontier is the border separating the pre-fission and after-fission regions. When the scission occurs, a discontinuity occurs in the PES. In DFT, one can choose a reasonable small critical value
$ q^c_N $ , which is the expectation value of the Gaussian neck operator$\langle \hat{Q}_N \rangle=\langle {\rm e}^{-(\frac{z-z_N}{a_N})^2} \rangle$ [39], to determine the scission line.$ z_N $ denotes the neck position, which is the position with the lowest density between the two fragments. Often,$ a_N= $ 1 fm is chosen. In this study, we choose$ q^c_N=4 $ , as suggested for$ ^{240} $ Pu in Ref. [10]. The scission lines in the PES of the ($ q_{20} $ ,$ q_{30} $ ) collective space based on DFT with different temperatures are shown in Fig. 6.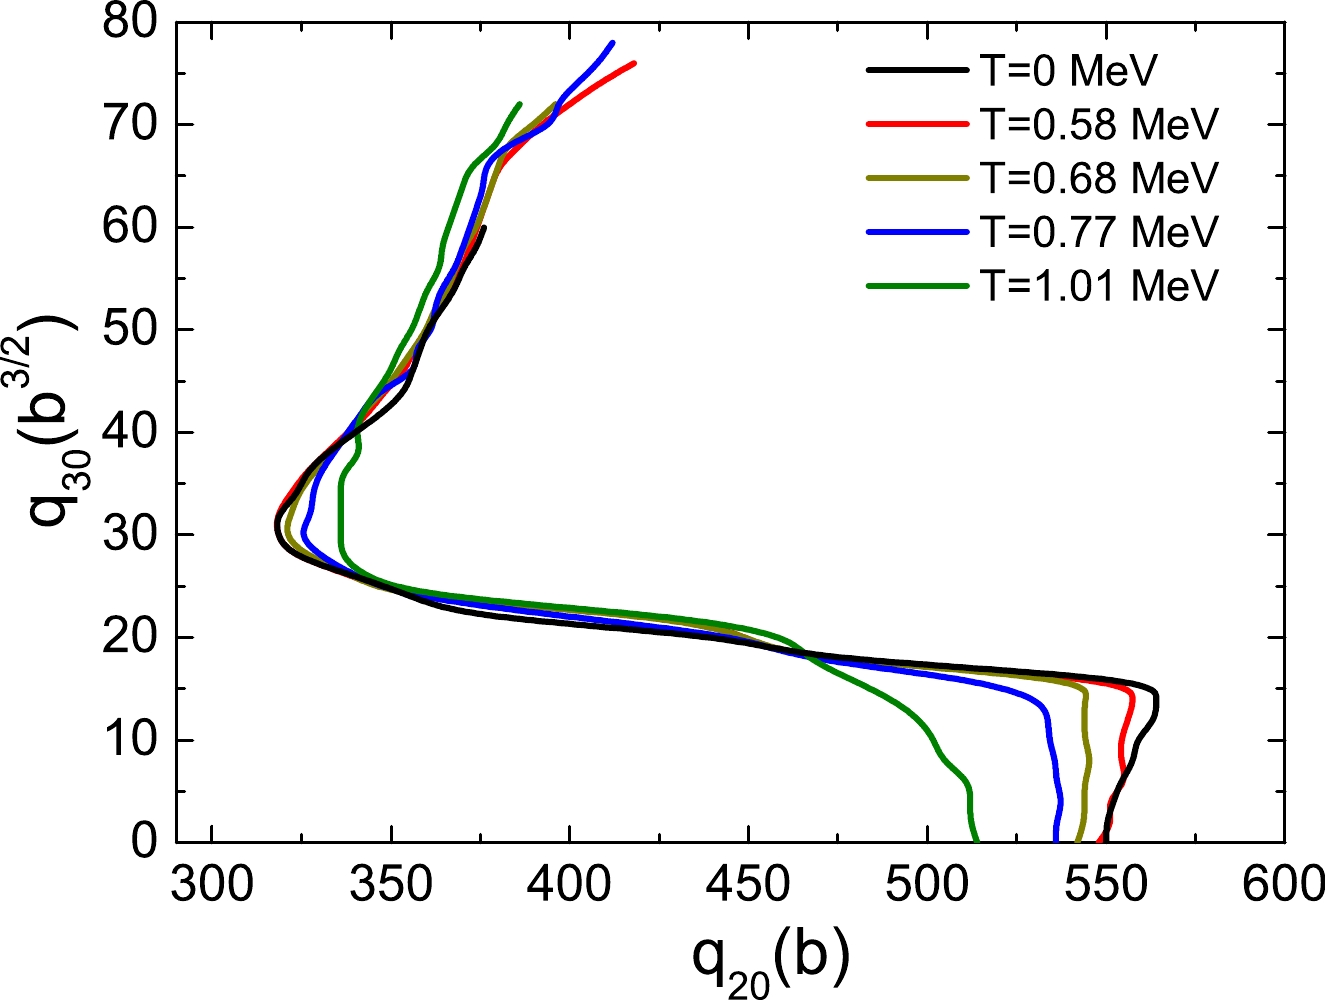
Figure 6. (color online) Scission lines of
$^{240}$ Pu with different temperatures determined by the critical value of the average particle number around the neck$q^c_n=\langle \hat Q_N\rangle=4$ .In general, the scission contours at different temperatures exhibit similar patterns. The curve of the scission line starts from a large quadrupole moment (
$ q_{20}>500 $ b) for the symmetric fission channel. Then, the curve goes up to the asymmetry direction, and at approximately$ q_{30}\approx 16 $ b$ ^{3/2} $ it bends to the small quadrupole moment region. The shortest elongation is at$ q_{20}\approx 320 $ b when the asymmetry grows to the octupole moment$ q_{30}\approx 30 $ b$ ^{3/2} $ , where the heavy fragment is close to$ ^{132} $ Sn. In the end, it turns to the upper-right direction until the asymmetry becomes very large. For different temperatures, in or around the region of the symmetric fission, the temperature increase leads to a smaller quadrupole moment of the scission point. In the region around the shortest elongation with$ q_{30}\approx 30 $ , the quadrupole moment at the scission line tends to be larger for higher temperatures. In the region with the largest asymmetry, the quadrupole moment of the scission line decreases with an increase in the temperature.The density profiles at several scission points for different temperatures are shown in Fig. 7. The density profiles at the symmetric fission channel, at the scission point with the shortest elongation, and at the point of the end of the least-energy fission path are shown in different rows of the panels in the figure. In general, these densities with the temperature variation are very similar for the symmetric and asymmetric fission channels. However, small discrepancies can be observed in the figure. For example, at the symmetric fission channel, the nuclear shape of the higher temperature has smaller elongation, and at the point with the shortest elongation, the nuclear shape has a slightly larger elongation for the case of a high temperature.
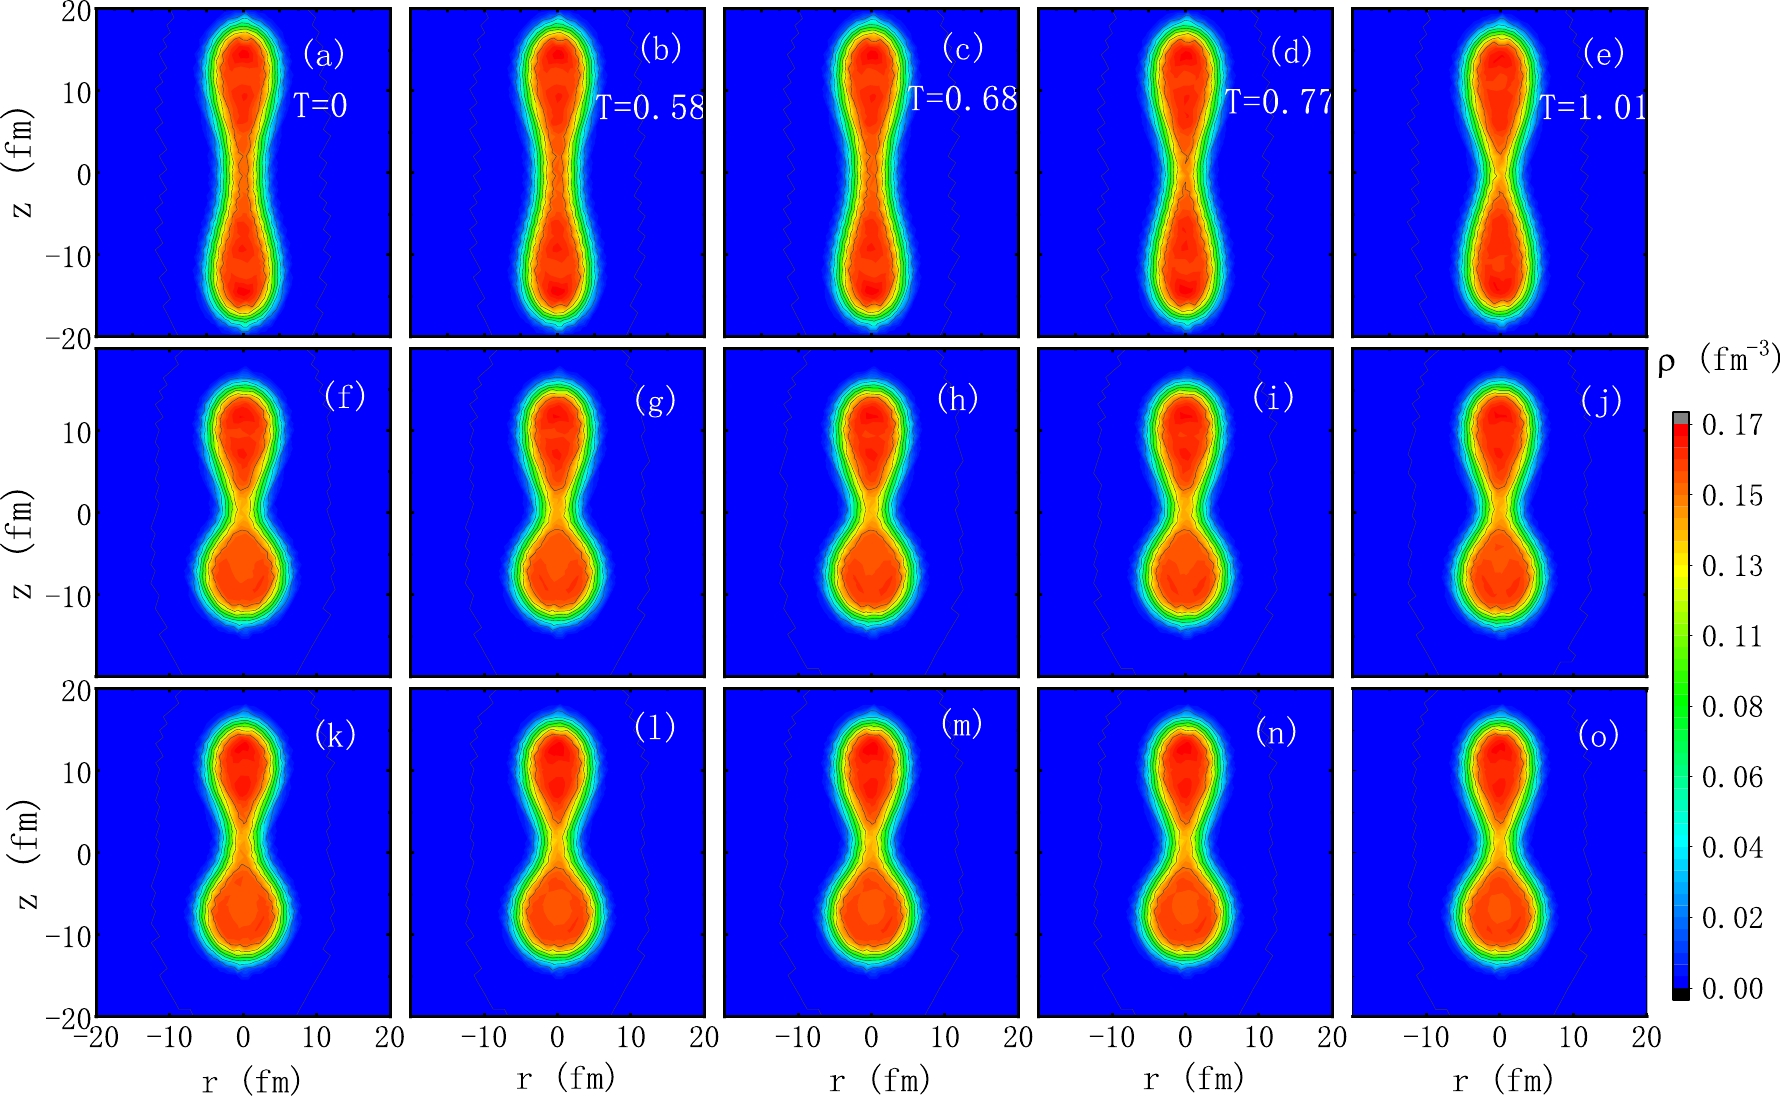
Figure 7. (color online) Density profiles of
$^{240}$ Pu. In the same column of the panels, the results of the DFT with the same temperature are given. The columns of the panels from left to right correspond to the cases of T= 0, 0.58, 0.77, and 1.01 MeV, respectively. The first row of the panels, i.e., panels (a)–(e), present the density profiles for the symmetric channel. The second row of panels present the density profiles with the smallest quadrupole moments on the scission lines, which have octupole moments of approximately 30 b$^{3/2}$ . The third row of the panels present the density profiles of the crossing points of the least-energy fission path and the scission line, which has an octupole moment of roughly 40 b$^{3/2}$ . -
The total kinetic energy (TKE) is an important quantity related to the mutual Coulomb interaction energy between the pair of fragments at the scission point, which can be calculated as
$ { E_{ \rm{TKE}}}={\frac{e^2Z_HZ_L}{d_ {\rm{ch}}},} $

(12) where e represents the proton charge;
$ Z_{H} $ and$ Z_{L} $ denote the charge numbers of the heavy and light fragments, respectively; and$ d_ \rm{ch} $ represents the relative distance between the centers of charge of the two fragments at the scission point. The TKEs of the nascent fission fragments as a function of the mass number of the heavy fragment ($ A_\mathrm{H} $ ) calculated via FT-DFT with different temperatures are shown in Fig. 8. Experimental data of the neutron-induced fission$ ^{239} $ Pu for the thermal neutron and the incident neutron with energies of 5.5 and 15 MeV [40–44] are shown for comparison. In the plot, it is seen that the variation of the experimental TKE against the incident neutron energy is negligible. In the calculated results, the change in TKE with temperature is also small. In the$ A_\mathrm{H} $ range of 120 to 136, the discrepancies among the calculated TKEs with different temperatures can be seen. For the case of the higher incident neutron energy, the calculated TKE tends to be higher when$ A_\mathrm{H} $ is approximately 120 and lower for$ A_\mathrm{H} $ in the range of$ 126\sim136 $ . This can be understood through the discrepancies of the scission lines from different calculations in Fig. 6, which are around the symmetric fission channel (with the particle number of the fission fragment$ A=120 $ ) and around the shortest elongation point in the scission line (with the particle number of the heavy fission fragment$ A\approx132 $ ), respectively.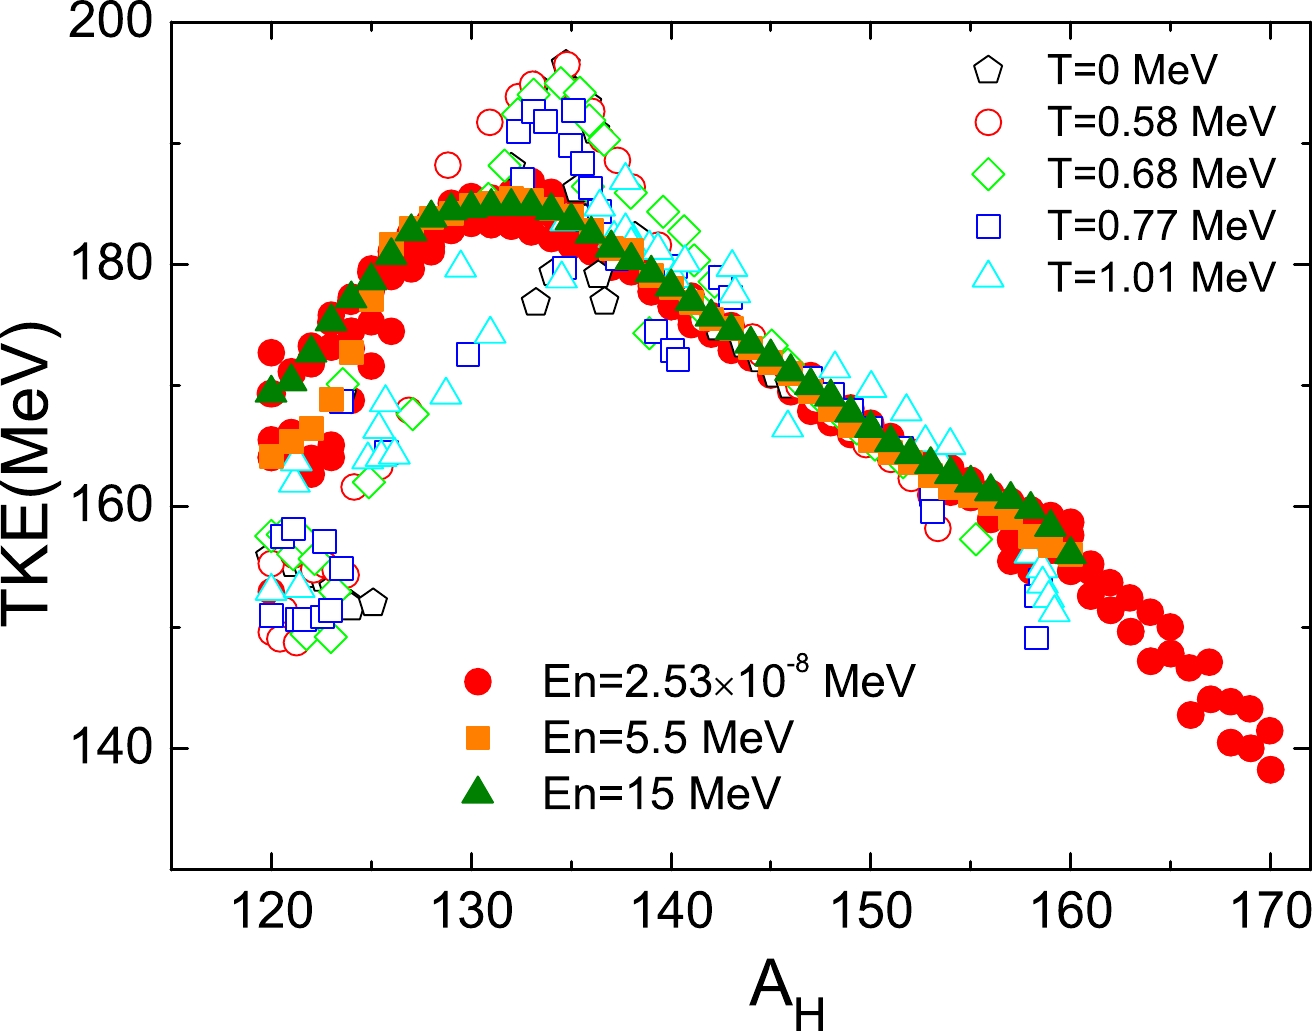
Figure 8. (color online) Total kinetic energy of nascent fission fragments as a function of the heavy fragment mass A
$_\mathrm{H}$ for$^{240}$ Pu, calculated for different temperatures. Open symbols represent the calculated results, and solid symbols indicate experimental data [40–44] for the thermal neutron ($E_{n}$ =2.53$\times 10^{-8}$ MeV), and$E_{n}$ = 5.5 and 15 MeV, corresponding to$T=$ 0.58, 0.77, and 1.01 MeV of the FT-DFT, respectively.As shown in Fig. 8, in the range of
$ A_\mathrm{H}\; = $ 130$ \sim $ 140, the TKE from the calculations exceed the experimental data. Such behavior is consistent with the studies in Refs. [18, 27], which showed that the calculated TKE generally exceeds the experimental data. With consideration of the dynamic effect of the dissipation, this discrepancy can be reduced, as demonstrated in a recent study [45]. -
According to the FT-DFT calculations presented in the previous subsections, we can calculate the fission fragment distribution with the TDGCM+GOA method. Figure 9 shows the calculation results for the mass distribution for the neutron-induced fission
$ ^{239} $ Pu (n, f) of the thermal neutron and the incident neutron with$ E_n $ = 2.72, 5.5, and 15 MeV. The TDGCM calculations using the results from FT-DFT with the temperature corresponding to the incident neutron energies are given. The initial state energy$ E_{\mathrm{coll}} $ of the collective wavepacket is chosen to be 1 MeV above the highest fission barrier. In the same plot, we also give the results of a different method based on the zero-temperature PES with different initial state energies of the collective wave packet in TDGCM. The initial energy is fixed according to the energy of the incident neutron. For example, in the case of the thermal neutron, which has a very low incident energy,$ E_{\mathrm{coll}} $ is chosen to be slightly above the highest fission barrier (saddle point), as 0.05 MeV. We label this simulation as$ \langle E \rangle_G\; = $ 0 MeV, corresponding to the case of the thermal neutron. For other incident neutron energies, the initial energy$ E_{\mathrm{coll}} $ is chosen to be$ E_n $ +$ E_b $ ($ E_b $ is the highest fission barrier), and we use the label$ \langle E \rangle_G\; $ with the same value of$ E_n $ for simplicity. In this method, the PES and mass tensor used by TDGCM are kept identical to those from the calculation of zero-temperature PES for different energies of the incident neutron. This method was used in Refs. [48, 49] for the calculation of fission products of the compound nuclei with different excitation energies.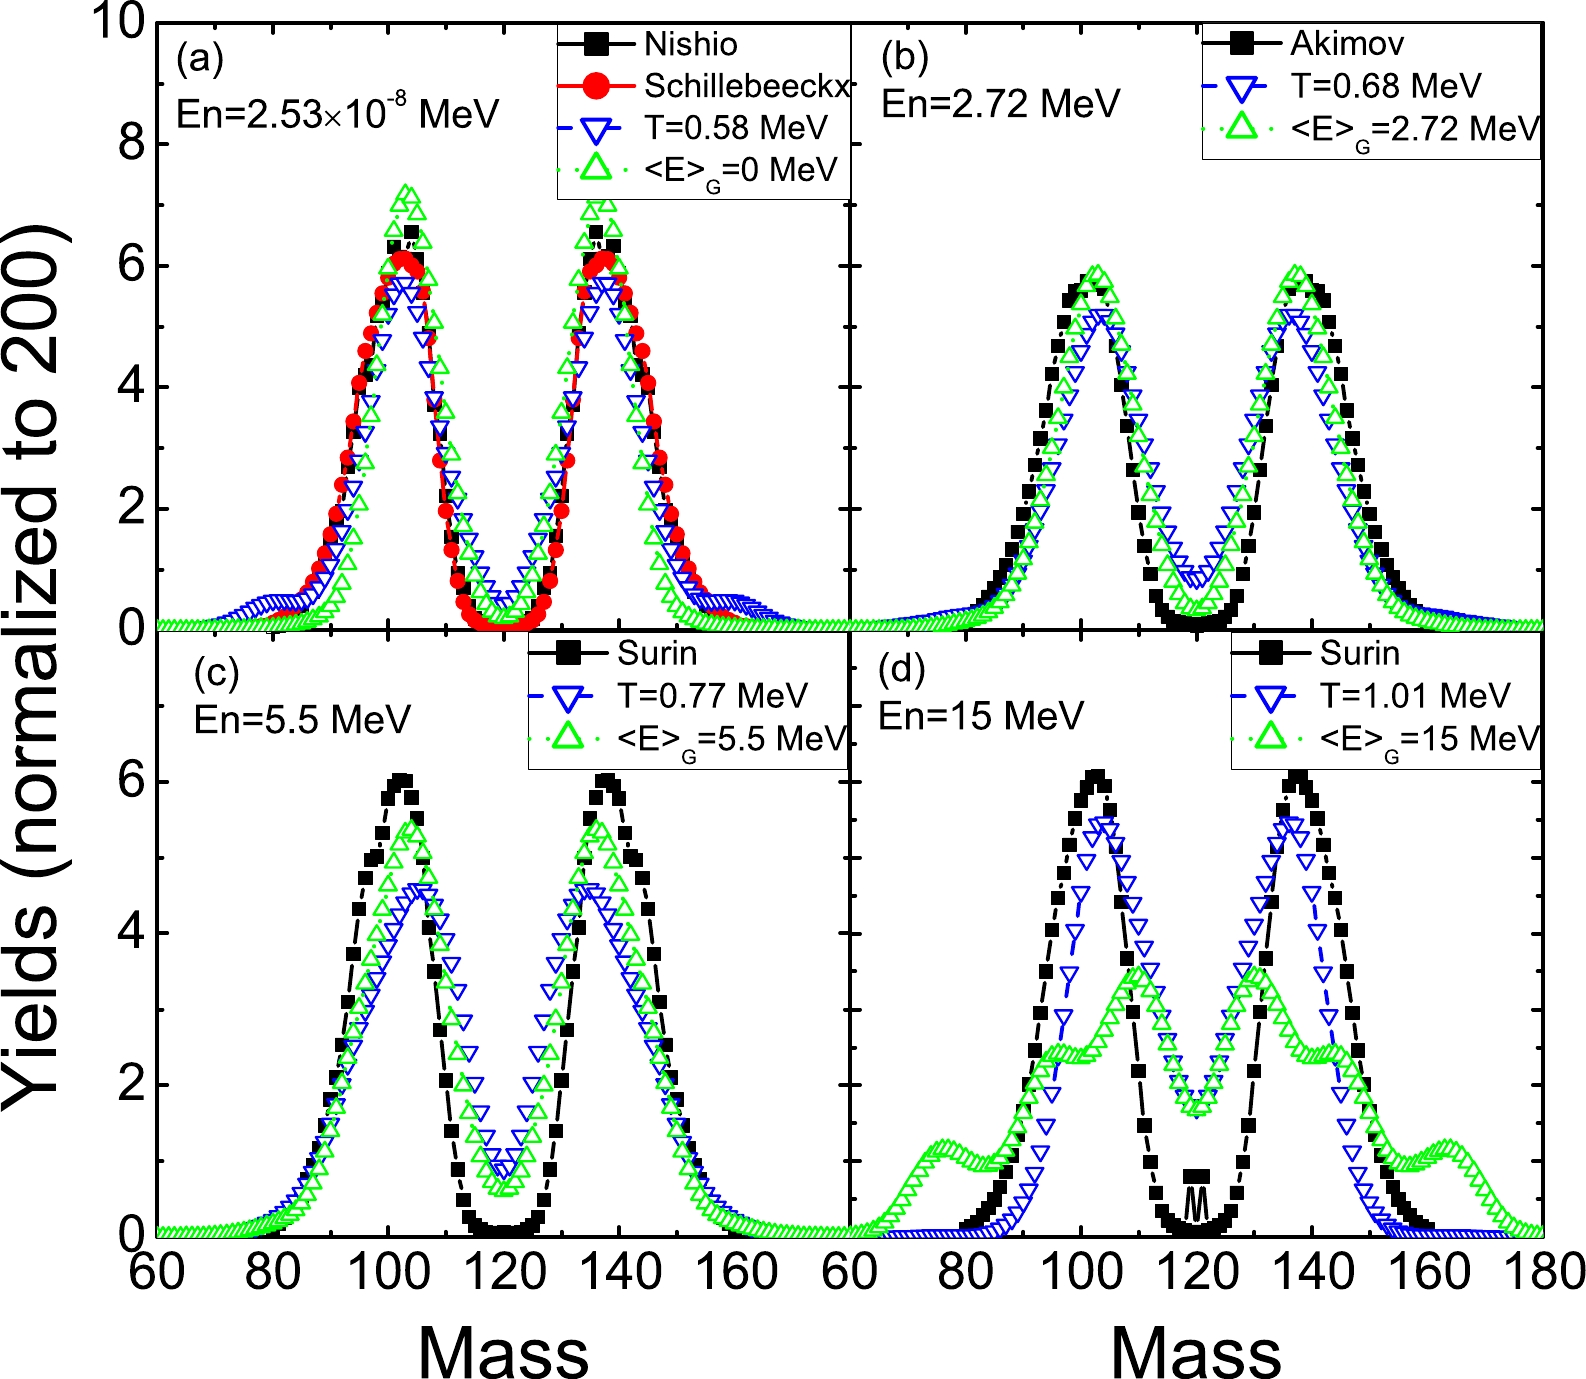
Figure 9. (color online) The mass distributions of the pre-neutron fission fragments from the neutron-induced fission of
$^{239}$ Pu with the thermal neutron and incident neutron energies of 2.72, 5.5, and 15 MeV are shown in panels (a)–(d), respectively. The calculation results of the TDGCM based on the FT-DFT are labeled by the corresponding temperature T. The TDGCM results based on the zero-temperature DFT obtained by tuning the initial energy of the collective wave packets are labeled by the corresponding collective energy$\langle E \rangle_G$ . The experimental data are also presented, for the thermal neutron from Refs. [42, 46],$E_n=2.72$ MeV from Ref. [47], and$E_n=5.5$ and 15 MeV from Ref. [44].From Fig. 9, these two methods give similar results for the thermal neutron at
$ E_n $ = 2.72 and 5.5 MeV. In the case of the thermal neutron, the peak positions of the mass distribution for the light and heavy fragments from the data are 103 and 137 in Ref. [42] and 104 and 136 in Ref. [46], respectively, while the peak of the calculated yields from the two methods is 103 and 137, respectively, which is consistent with Ref. [42]. For$ E_n $ = 2.72 MeV, the peak for light and heavy fragments from the experimental data is 101 and 139, respectively. The corresponding peaks of the calculated fission yields based on the FT-DFT are 104 and 136, and those of fission yields based on the zero-temperature DFT are 103 and 137. For$ E_n $ = 5.5 MeV, the experimental peaks are 102 and 138. The calculation based on FT-DFT gives the peak positions at 105 and 135, and the peaks based on zero-temperature DFT are 104 and 136. For these three different incident neutron energies, the height of the peaks from the calculation based on zero-temperature DFT exceeds that of the peaks based on FT-DFT in general, and the discrepancies of these calculation results relative to the experimental data are small.However, explicit discrepancies can be seen for the incident neutron energy of 15 MeV. A large deviation of the peak position compared with the data is observed for the calculation based on the zero-temperature DFT, i.e., 110 and 130 for the light and heavy fragments, respectively, compared with the peak positions of 103 and 137 from the data. Additionally, there are two smaller peaks on the light fragment distribution and heavy fragments, which is not observed from the data. The results based on FT-DFT are more reasonable. It has the peak positions as 104 and 136 for the light and heavy fragment distributions, respectively. The reason for the discrepancies of these two theoretical calculation may be that the shell structure has been changed significantly with the large excitation energy of the fissioning system; thus, one cannot use the the same PES employed for the lower excitation energies for the calculation of TDGCM. The results indicate that FT-DFT can provide a reasonable description of the excited states of compound fissioning nuclei. Furthermore, one can notice that from the theoretical calculations of the TDGCM, the yields from the symmetric fission channel increase with the incident neutron energy. However, from the experimental data, it appears that the yields around the symmetric fission channel do not change significantly from that for the incident and thermal neutrons with an energy of 15 MeV. The theoretical results can be understood as follows: the shell effect, which leads to the asymmetric fission channel, becomes smaller with an increase in the excitation energy. For example, from Fig. 2, the reduction of the symmetric fission barrier is larger than that of the asymmetric fission barrier with an increase in the temperature in FT-DFT.
-
In this study, FT-DFT with SkM* parametrization in the HFB approximation was adopted to calculate the PES of
$ ^{240} $ Pu in the collective space of the quadruple and octuple moments. Temperatures of$ T= $ 0.58 , 0.68 , 0.77 , and 1.01 MeV were used, together with the$ T= $ 0 MeV case, to simulate the static studies of the fissioning compound nuclei with different excitation energies. The topologies of these PESs were similar for these temperatures. The same deformations of the ground state, isomeric state, and inner fission barrier were obtained. From the least-energy fission pathways of these PES, the asymmetric fission channel dominates for all these cases. The fission barriers decrease with an increase in the temperature for both symmetric and asymmetric fission paths. The barrier of the symmetric fission decreases more rapidly with the increase in the temperature than that of the asymmetric fission.From the investigation of SPEs, it was seen that, with an increase in the temperature, the gaps between SPEs become smaller; thus, the shell effect is weakened. We also studied the variation of the pairing correlations in the PES with respect to the temperature. At temperatures lower than 0.3 MeV, the pairing gaps remain close to the zero-temperature ones, and with an increase in the temperature, the pairing correlations decrease rapidly. In the current studies, for the case of
$ T= $ 0.58 MeV, there is weak or even no pairing correlation in the neutrons, and the proton systems still have pairing correlations. For$ T= $ 0.68 MeV, the pairing correlation disappears for the neutrons and becomes weak or vanishes for the protons in the PES. For$ T= $ 0.77 MeV and 1.01 MeV, there are no proton and neutron pairing correlations. For different temperatures, the scission lines have similar patterns, i.e., large elongation ($ q_{20}>500 $ b) for symmetric fission, then jumps to the shortest elongation$ q_{20}\approx 320 $ b as$ q_{30}\approx 30 $ b$ ^{3/2} $ where the heavy fragment close to$ ^{132} $ Sn, and finally turns to upper-right direction till very large asymmetry. As the temperature increases, the pre-fission region shrinks around the symmetric fission channel, enlarges around the shortest elongation point on the scission line, and shrinks around the large asymmetric region. The variations of the TKEs with respect to the temperature are small in the cases of this study. The TKE results from the FT-DFT are close to the experimental data. Exceptions are the calculated TKE of the fragments around the symmetric fission channel, which are smaller than the data, and around the fragments with particle numbers of 132$ \sim $ 136, which are larger than the experimental data.To study the fission yield of the neutron-induced fission
$ ^{239} $ Pu (n, f) with different neutron energies, the TDGCM calculations were performed in two different ways, i.e., using the PES from the FT-DFT calculation with the specific temperature corresponding to the excitation energy of the compound nuclei and using the PES from the zero-temperature DFT calculation but tuning the initial energy of the collective wave packet in the TDGCM to the excitation energy of$ ^{240} $ Pu. For the low energy cases, i.e., thermal neutron and incident neutron with energies of 2.72 and 5.5 MeV, the two different methods gave similar results, and the peak positions and widths were close to the data. However, for the highest neutron energy considered in this study, i.e., 15 MeV, a large deviation relative to the data was observed for the TDGCM with the inputs from the zero-temperature DFT. The peak of the yield distributions moved closer to the fission channel with less asymmetry, and several other small peaks appeared. The yield data of$ E_n= $ 15 MeV were reproduced well by the TDGCM with$ T= $ 1.01 MeV of the FT-DFT. This could indicate that the shell structure at high neutron energies differs from that at low incident neutron energies explicitly, so that using the PES from zero-temperature DFT may lead to an unreasonable description of the fission dynamics. From the experimental data, the increase in the fission yields around the symmetric fission channel is negligible in the cases of this study. However, from the theoretical calculations, the yields in the region of the symmetric fission channel increase with the temperature explicitly. This may be why the weakening of the shell effects with the increase in the incident neutron energy from the FT-DFT is faster than that in the experimental data.
Microscopic study of neutron-induced fission process of 239Pu via zero- and finite-temperature density functional theory
- Received Date: 2022-11-23
- Available Online: 2023-05-15
Abstract: To study the neutron-induced fission of


 Abstract
 HTML
HTML Reference
 Related
 PDF
PDF






 DownLoad: