-
The idea of small, autonomous Extensive Air Showers (EAS) experiments was first explicitly presented by Linsley in 1885 [1], in the context of synchronization of large detector arrays covering tens and hundreds of square kilometers to record showers of the highest energies, whose fluxes are so small that only large instruments can produce meaningful results on them in a reasonable time. This has been practically realized to some extent in triggering systems of the largest EAS instruments, such as the Pierre Auger Observatory or Telescope Array. The complex linkage of local triggers facilitated the practical measurements of the UHECR fluxes of one particle per square kilometer per century. Building more similar facilities for increasingly higher energy cosmic ray measurements is practically unjustified today. For measurements above the Greisen-Zatsepin-Kuzmin (GZK) cut-off, such as in satellite or radio measurements, novel techniques are required, which are being worked on by dozens or hundreds of scientists from several countries. However, recently, there has been an increased interest in small-scale EAS experiments designed to satisfy young people's scientific curiosity and develop their interest in science. Small, local (school) EAS arrays can play an important role in education. They are one of the very few tangible, "hands on" types of systems for teaching nuclear physics, modern high-energy physics, and physics of elementary particles to high school students, to whom such knowledge is generally solely provided indirectly, thus creating an image as something very distant, mysterious, and unattainable for the average human, as a kind of secret knowledge or modern magic. This leads to the perception of science, and physics in particular, as something potentially dangerous, which should be susceptible to opposition, whenever the opportunity appears. Resistance and protests against nuclear power plants are an obvious manifestation of this reality.
In several countries, attempts are being made to introduce such projects in schools to stimulate interest in cosmic ray physics. In some countries, this endeavor has already been achieved on a smaller or larger scale, for example, the High School Project on Astrophysics Research with Cosmics (HiSPARC) [2] in the Netherlands, as well as WALTA [3], NALTA, ALTA [4], SALTA, CZELTA [5], SKALTA, CHICOS [6], CROP, CosMO [7], or Maze [8-10]. In several centers, work is in progress on the construction stage of prototypes or the research and development stage. From a technical persepective, such small arrays are not a serious challenge. A few typical scintillation detectors connected to a simple triggering, monitoring, and recording device would address this problem. However, because the idea of such projects is to popularize such arrays, and preferably to combine them into one large system, the cost of appropriate equipment for one school plays a significant role. In addition, the problem is complicated by the fact that teachers must be prepared to actively use the detectors and the entire network as part of their curricula and during after-hour activities. For this to work in practice, it is necessary to create a robust set of educational materials for both students and teachers. Students must be aware that they are carrying out observations of real physical phenomena. In addition, they should be aware that what they are observing are signals of cosmic rays reaching the Earth from distant cosmic spaces.
To achieve such awareness, they must have the tools required to interpret the signals recorded by their apparatus. The mere simultaneous appearance of some signals in several detectors is not fascinating to most, although it may be interesting to some. It starts to get really interesting when something tangible finally starts to emerge from such a phenomenon, or rather from a set of such phenomena, and from a registration that lasts continuously for days, weeks, or even months or years, which is actually the underlying knowledge of the surrounding reality. To go from direct measurement to its interpretation, appropriate tools are required, and such tools should be provided to students and teachers, together with clear and comprehensible documentation and user instructions.
Small instruments are inherently designed to record small showers. Certainly, it is possible to set the triggering thresholds high, and then once in a while after a long time period, we will observe a large EAS. Because, in our opinion, a very important component of the price of such a small shower array are scintillators, in the optimal version, they are possibly not going to be very large. There are also other considerations suggesting that the detectors should be "mobile" and able to work in different geometries, i.e., relatively small in size. In the case of small detectors, a trigger threshold of one minimal ionizing particle is necessary if we want to maintain the observed shower rate as high as possible. With such thresholds, the registrations will practically contain cases where the detectors register exactly one particle in coincidence. Clearly, we cannot omit the fact that a shower of primary energy 10
$ ^{17} $ eV will hit the center of our array and there will be a dozen (hundreds) particles in the detectors; however, these cases will be so rare that they will disappear with no effect on the statistics. The second factor indirectly related to the price of the scintillator is, of course, the number of detectors in one local apparatus. The minimum number is 2, as it was in the famous experiment conducted by Auger and Maze in 1938 [11, 12], and as it is now in the stations of the HiSPARC project [2]. However, for stable operation and full control over background and random coincidences, having 3 detectors seems to be more reliable. Moreover, to discuss the size of the shower, we should have more detectors to enable us study the frequency of double, triple, and higher coincidence events. By optimizing performance and price, we infer that stations with 4 detectors seem to be the best.Such small showers obviously pose fundamental problems of interpretation. It is definitely impossible to localize the shower axes. In addition, with such a small number of detectors (3 or 4), localization, even at higher particle densities on detectors (which could be the case of larger showers), would be questionable regardless. For 3 – 4 detectors set up in small distances (approximately 10 m), it is also unrealistic to determine the directions of arrival of the showers. First, it would require precise measurements of time differences in the order of several nanoseconds, which would be possible in principle; however, even this approach would provide nothing tangible, considering the disk thickness of the small shower, which determines the fluctuations in the moment of appearance of the signal. In the absence of direction and axis position, event-by-event analysis does not provide any meaningful result. We can feasibly measure the observation frequency of various coincidences initially; then, if we equip the apparatus with amplitude measurement, we can determine the distribution of these amplitudes. The measurement times will allow us to study how the frequency of registration changes with time, which can be a basis for various studies conducted by groups of students, such as those on variability as a function of atmospheric parameters, day/night variability, and dependence of various "everyday life" quantities on the observed cosmic ray flux. To the best of our knowledge, the dependence of the Covid-19 infection rates on the cosmic ray flux is yet to be investigated.
From a fundamental physics perspective, it might be very interesting to combine several (the more, the better) instruments into one network and determine the existence of correlations in real time. The observation of large shower pairs at distant locations could indicate the existence of the Gerasimova-Zatsepin effect [13, 14] in the cosmic flux at the highest energies of heavy nuclei. The cosmic ray mass composition in this area remains a mystery waiting to be solved. The observation of other correlations could suggest the existence of more exotic objects, such as the Cosmic Ray Ensembles sought by the CREDO Collaboration.
In conclusion, building small, local, school-based EAS arrays, and networking them on a significantly larger, global scale has many positive aspects.
The analysis of data from small arrays requires specific methods. Methodological limitations do not allow to the adoption of conventional cosmic ray experiment methods for processing data. The interpretation of EAS registrations, in any case, is based on computer simulations describing the development of the shower and also on modeling the response of the array detectors to then compare the registrations with the predictions. The predictions incorporate parameters such as the mass of the original particle, its energy, and its arrival direction, along with the position of the shower axis (the intersection of the particle trajectory with the observation plane). The importance of these parameters is obvious. Apart from them, models and parameters of cosmic ray particle-air interaction also enter in an implicit way. These processes are not fully understood. Their descriptions are based on theoretically validated extrapolation of data of accelerator experiments.
The modeling of strong interactions has a long history. All models in the market today were developed a long time ago, and are constantly being refined and improved with the release of new data. These models need to be implemented into the geometrical structure of the transport through the Earth's atmosphere. Complementing them with a better known formalism of electromagnetic cascades and descriptions of other relatively important processes leads to the processes simulating the development of EAS. Today, one of the most widely adopted programs for this purpose is the CORSIKA program [15, 16], which was developed over 30 years ago in Karlsruhe for the KASCADE experiment [17, 18]. Since then, this program has been significantly extended and developed and is now also used for simulations at the highest observed energies (even up to 10
$ ^{21} $ eV).However, local arrays need to be simulated with energies at the other end of the cosmic-ray energy spectrum. This spectrum is very steep, and has a power-law character with an exponent (differential) of -2.7, which means that there are approximately 1000 times fewer particles with energies that are ten times larger. The low-energy end of the spectrum is truncated around energies of a few GeV/n, which is primarily owing to solar modulation. Certainly, atomic nuclei with kinetic energies of 1 GeV are not capable of causing what we might call an EAS or even a shower at all. The products of the interactions initiated by such particles would have no feasible chance of reaching the earth's surface.
The natural question, of course, is whether anything can reach the observation level (sea level) from a flux of cosmic ray particles with energies of 10 GeV/n or 100 GeV/n, at the top of the atmosphere. The only way to find an answer is to run appropriate simulations, which can be performed using CORSIKA. There is no limitation to determining the feasibility of observing a charged particle remaining from a proton initiated cascade, starting with the energy of 10 GeV. The possibility of observing anything is significantly negligible; however, we should recall that the flux of such particles is substantially large.
At energies of primary particles approximately 1 TeV and higher, we can expect that the particles from the showers initiated with them will arrive at the surface of the ground. The geometry of the shower development indicates that these particles will be scattered across large distances from the direction of the primary particle (from the axis of the shower). This is confirmed by simulations. These distances are on the order of hundreds of meters. In addition, a crucial complexity of the simulation challenges of showers at the lower end of the spectrum appears here. The densities of particles rarely exceed several per square meters. Such densities would require correspondingly larger primary energies, and as aforementioned, the energy spectrum is very steep.
-
The CORSIKA program provides users with a number of options. They consider both the structure of the simulation algorithm itself, including models of high- and low-energy interactions, which should be attached to the basic simulation scheme, as well as those connected with the parameters of the simulated showers, which are of interest to the user (Cherenkov radiation, radio emission, and atmospheric neutrinos). There are so many options, such that listing them with the minimum necessary description takes almost 200 pages in the latest version of the CORSIKA manual [16]. The already linked program requires run parameters to be set using the control cards. In principle, for typical simulations, the default set embedded in the program itself is selected. However, to adopt the CORSIKA program for a more differenct or slightly different purpose, the parameter values are required to be set carefully. For this work, we mainly want to use the program to simulate small and very small showers. In this case, it is essential to precisely determine the size of the fluctuations we are dealing with at the lowest energies.
-
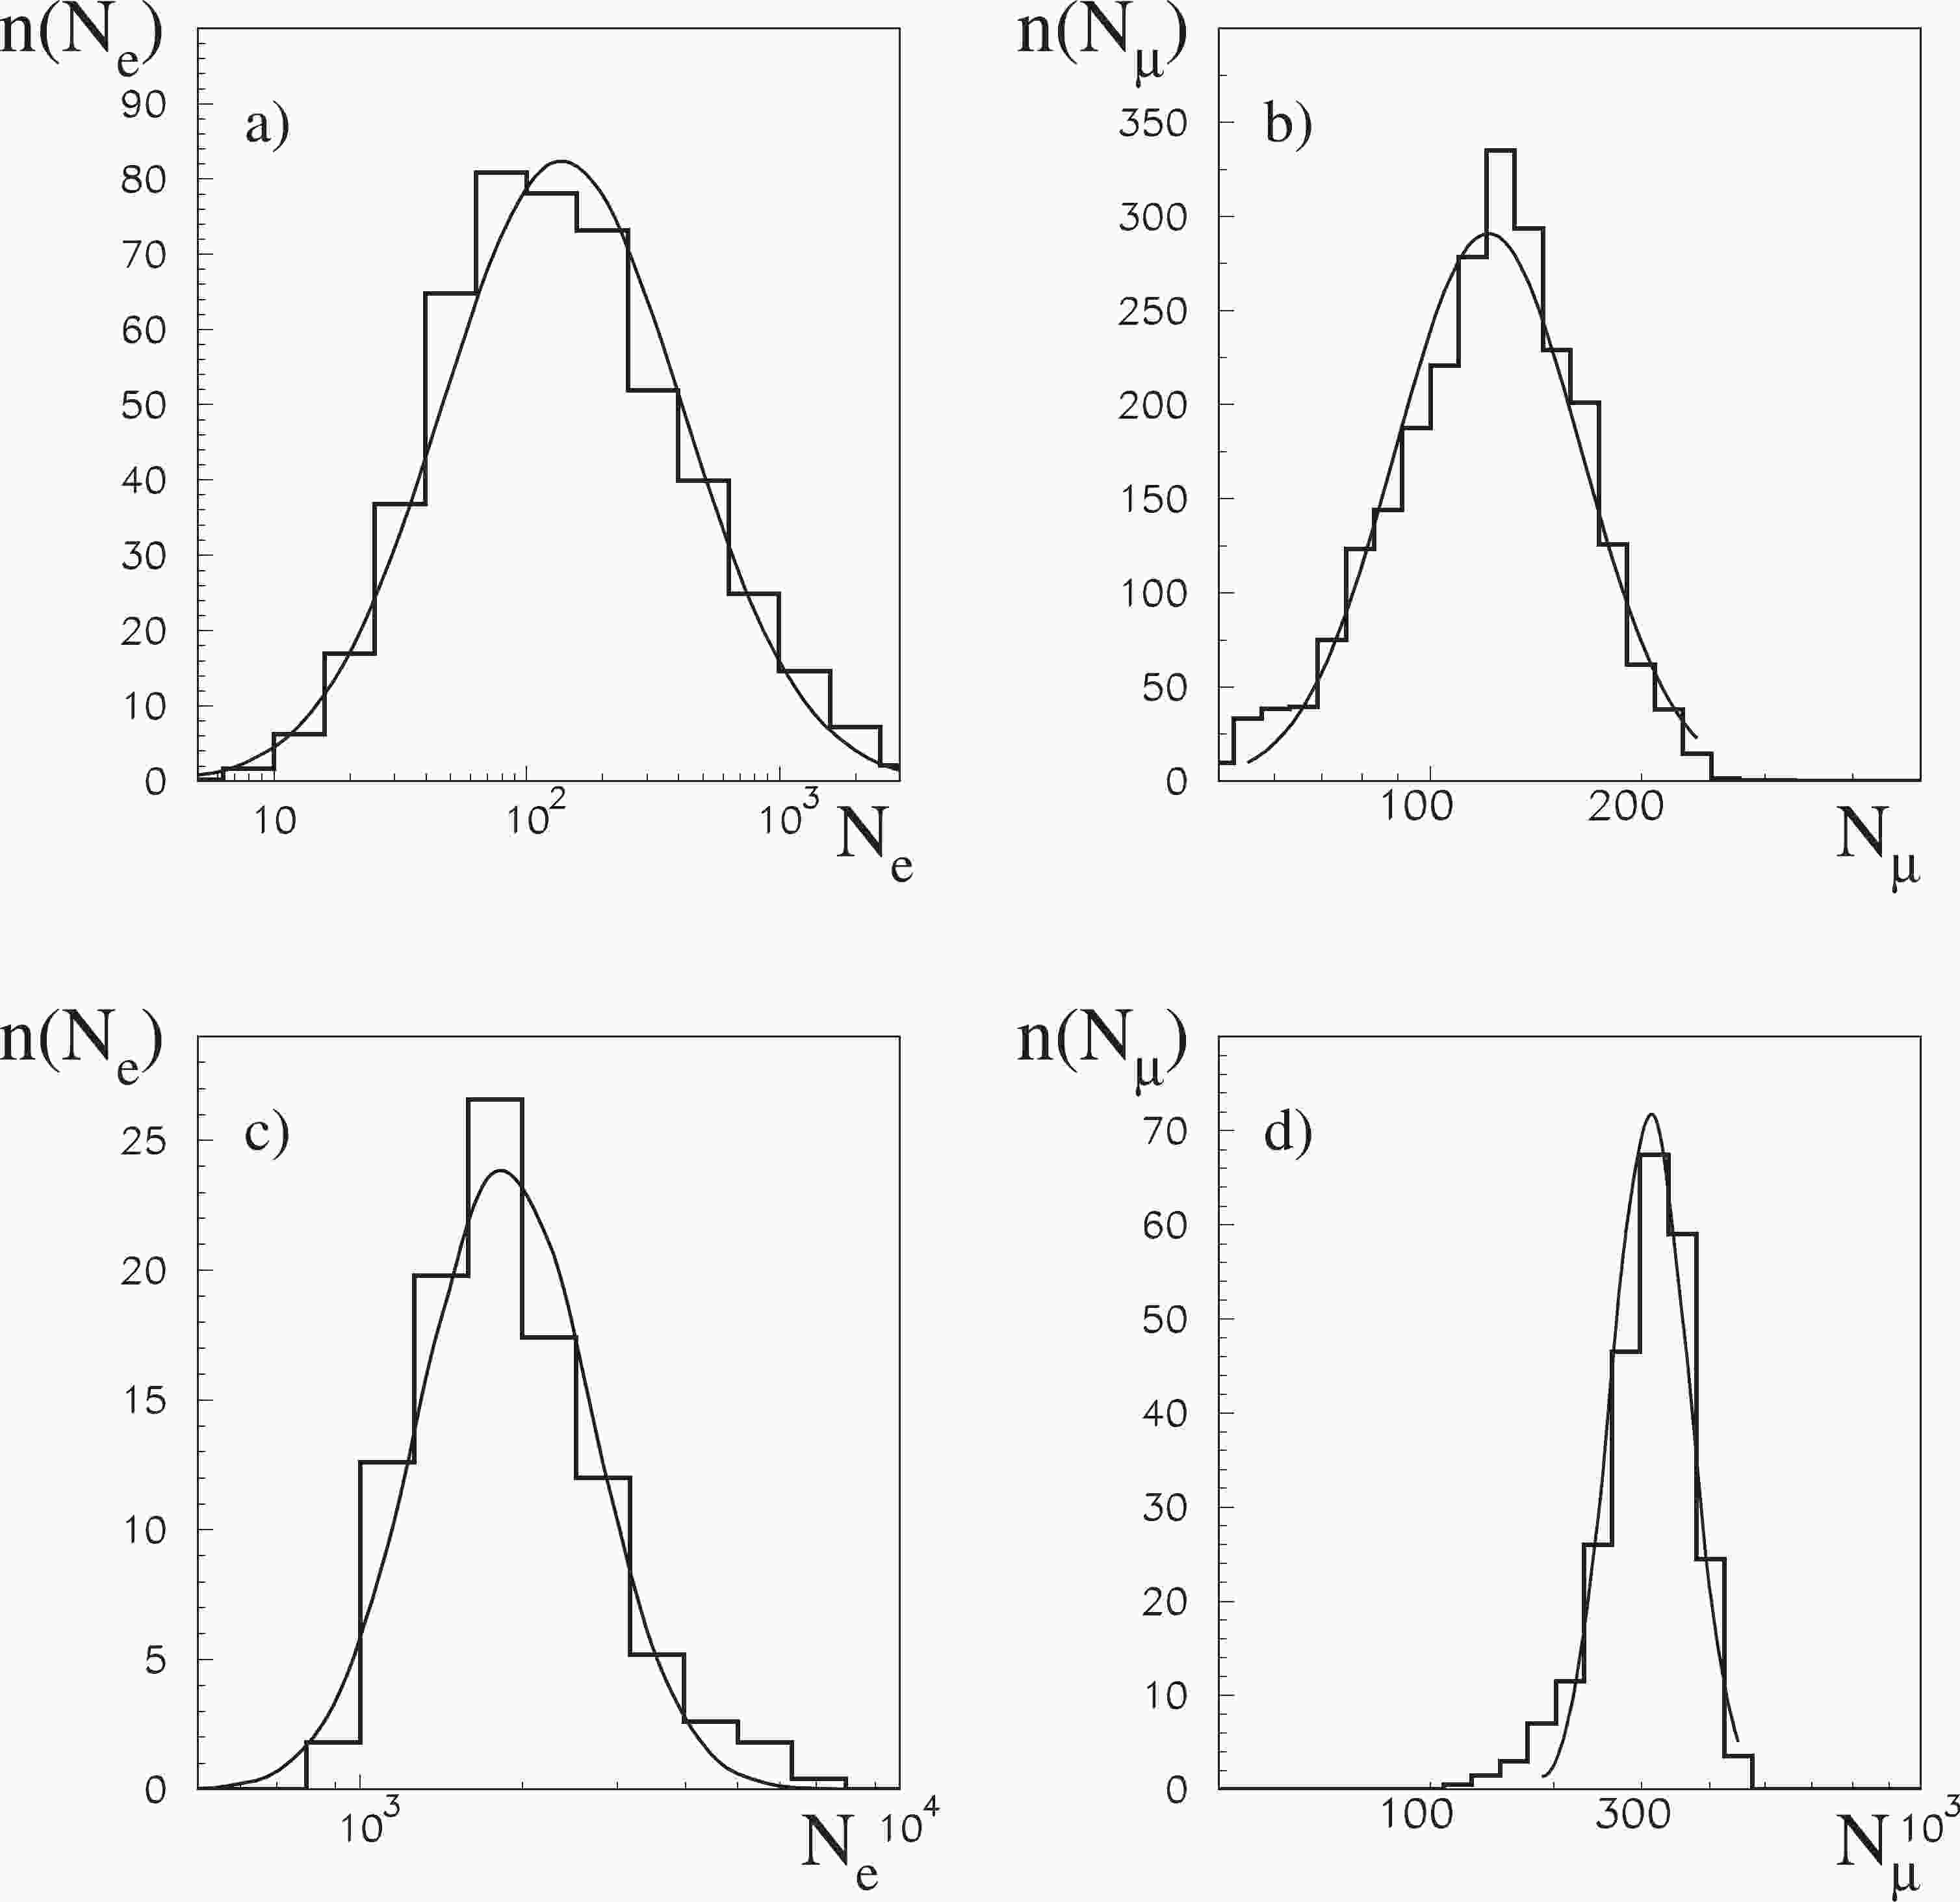
The first and undoubtedly most important parameter of a shower is its size, which is understood here as the number of particles at the observation level, as it is typical for surface shower arrays. In experiments analyzing the light (Cherenkov or fluorescent light) produced when a shower passes through the atmosphere, the shower size is defined as the number of charged particles in the shower maximum. CORSIKA allows us to precisely count the number of tracked electrons (and positrons), as well as positive and negative muons, that eventually reach the observation level. Certainly, all thinning options in the program have to be switched off. Repeating simulations continuously for the same particle with the same energy and the same angle of arrival, we will obtain a different result each time. Fluctuations in the size of the shower are an intrinsic property of the simulations, and they result from the probabilistic nature of multi-particle production processes. Figure 1 presents examples of electron and muon shower size spreads for cases of showers initiated by protons with energies of 10
$ ^{13} $ eV and 10$ ^{15} $ eV. The lines correspond to the Gaussian distribution (actually Log-normal) fitted to the iluustrated histograms. As can be observed, in all cases, the Log-normal distribution optimally describes the scattering of the sizes.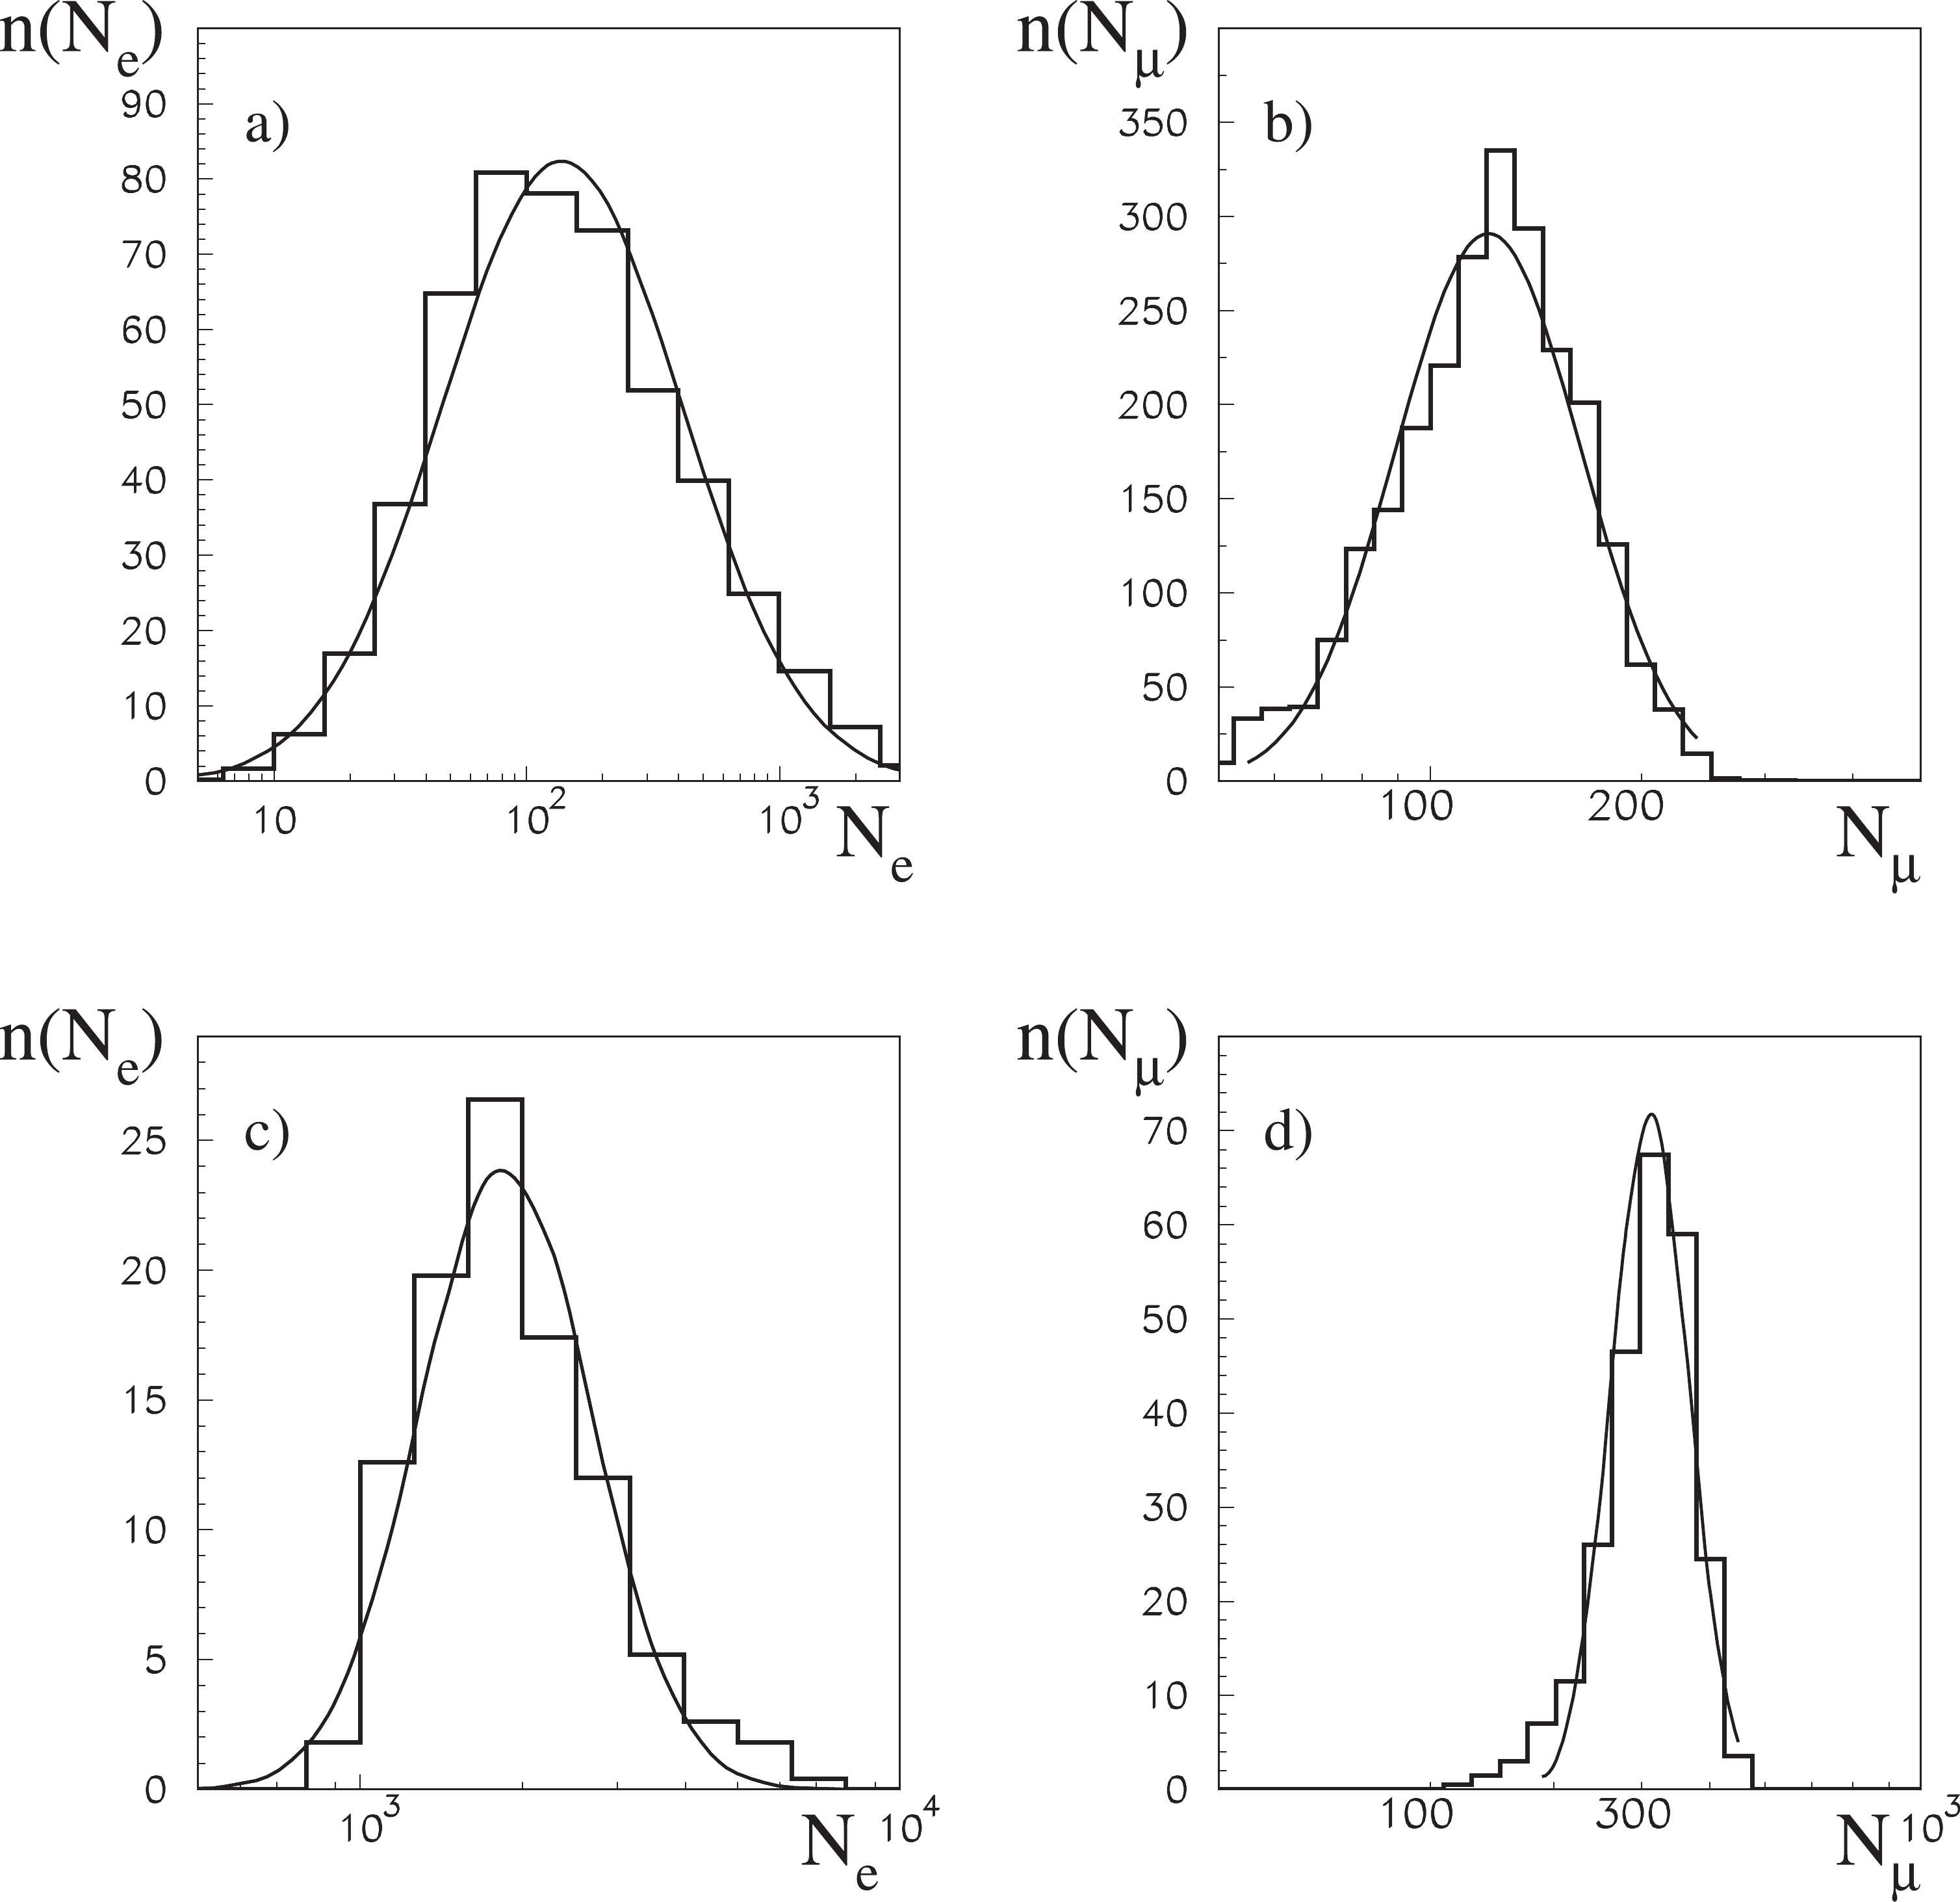
Figure 1. Examples showing spread of electron (a, c) and muon (b, d) numbers in CORSIKA vertical showers initiated by protons of 10
$ ^{13} $ eV (a, b) and 10$ ^{15} $ eV (c, d) energies. The lines represent respective fits of the Gaussian (Log-normal) distribution.For showers smaller than those illustrated in Fig. 1, when the sizes are approximately a few particles, the Log-normal distribution is obviously no longer the best. At small number of particles, we should expect an important correlation between them triggered by their common origin from subcascades, which developed accidentally just above the level of observation. In addition, in such cases, the Poisson-type statistical fluctuations are superimposed on fluctuations in their number caused by the probabilistic nature of the phenomenon itself.
The discrete nature of the size variable means that we expect a number of shower cases with zero charged particles. The analysis of the simulation outputs indicates that there are more of such cases than would originate from the Poisson nature of the process. The fraction of “empty” showers increases rapidly with a decrease in the energy of the primary particles. This relationship is important if you want to integrate the observed fluxes of particles appropriately. Obviously, this truncates the flux of primary cosmic ray particles on the low energy side. Fig. 2 shows this cut for vertical showers. It is represented as black dots for the results of simulations with the CORSIKA program for primary protons. As can be observed, the truncation for all charged particle size starts to work below the energy of 10
$ ^{11} $ eV, and at the energy of 10$ ^{10} $ eV only approximately 1 shower in 100 contains at least one charged particle (Fig. 2c). The same figure also presents results obtained in the case when the primary particle is an iron nucleus. As expected, the truncation in this case starts an order of magnitude earlier (below 10$ ^{12} $ eV) and is significantly more abrupt. We will discuss effects connected to the mass of the primary particle below.
Figure 2. Fraction of “non-empty” showers: a) - with no electron contents, b) no muon, and c) no charged particles at all. Circle symbols linked by the solid line represent results of proton induced showers, squares and the dashed line for iron induced showers, and open squares are obtained from proton shower results with the superposition model assumption applied to the iron case of
$ A = 56 $ independent subshowers.A comparison of the truncation for the electron (Fig. 2a)) and muon (Fig. 2b)) sizes indicates that for very low energies, muons are the particles that manage to reach the ground, and they determine the counts in the individual detectors. In the following, we will analyze this effect quantitatively.
As already mentioned, the size of the shower initiated by a primary particle of a given energy is the most important (for integration of surface particle flux) parameter, which the CORSIKA program provides. We can define the size of simulated showers separately as electron and muon sizes, as the number of electrons or muons at the observation level. Both of these quantities are important for our purposes, and both are further analyzed in parallel.
Figure 3 presents the average values obtained from simulations for primary protons (filled symbols), where the proper energy scale is represented on the bottom axis and the values on the left axis, and for the iron nuclei empty symbols, on the top and right scales. First, it is important to note that, practically, in the entire energy range presented from 10
$ ^{11} $ eV to 10$ ^{15} $ eV, the dependence definitely satisfies the power-law with different indices for muon and electron sizes.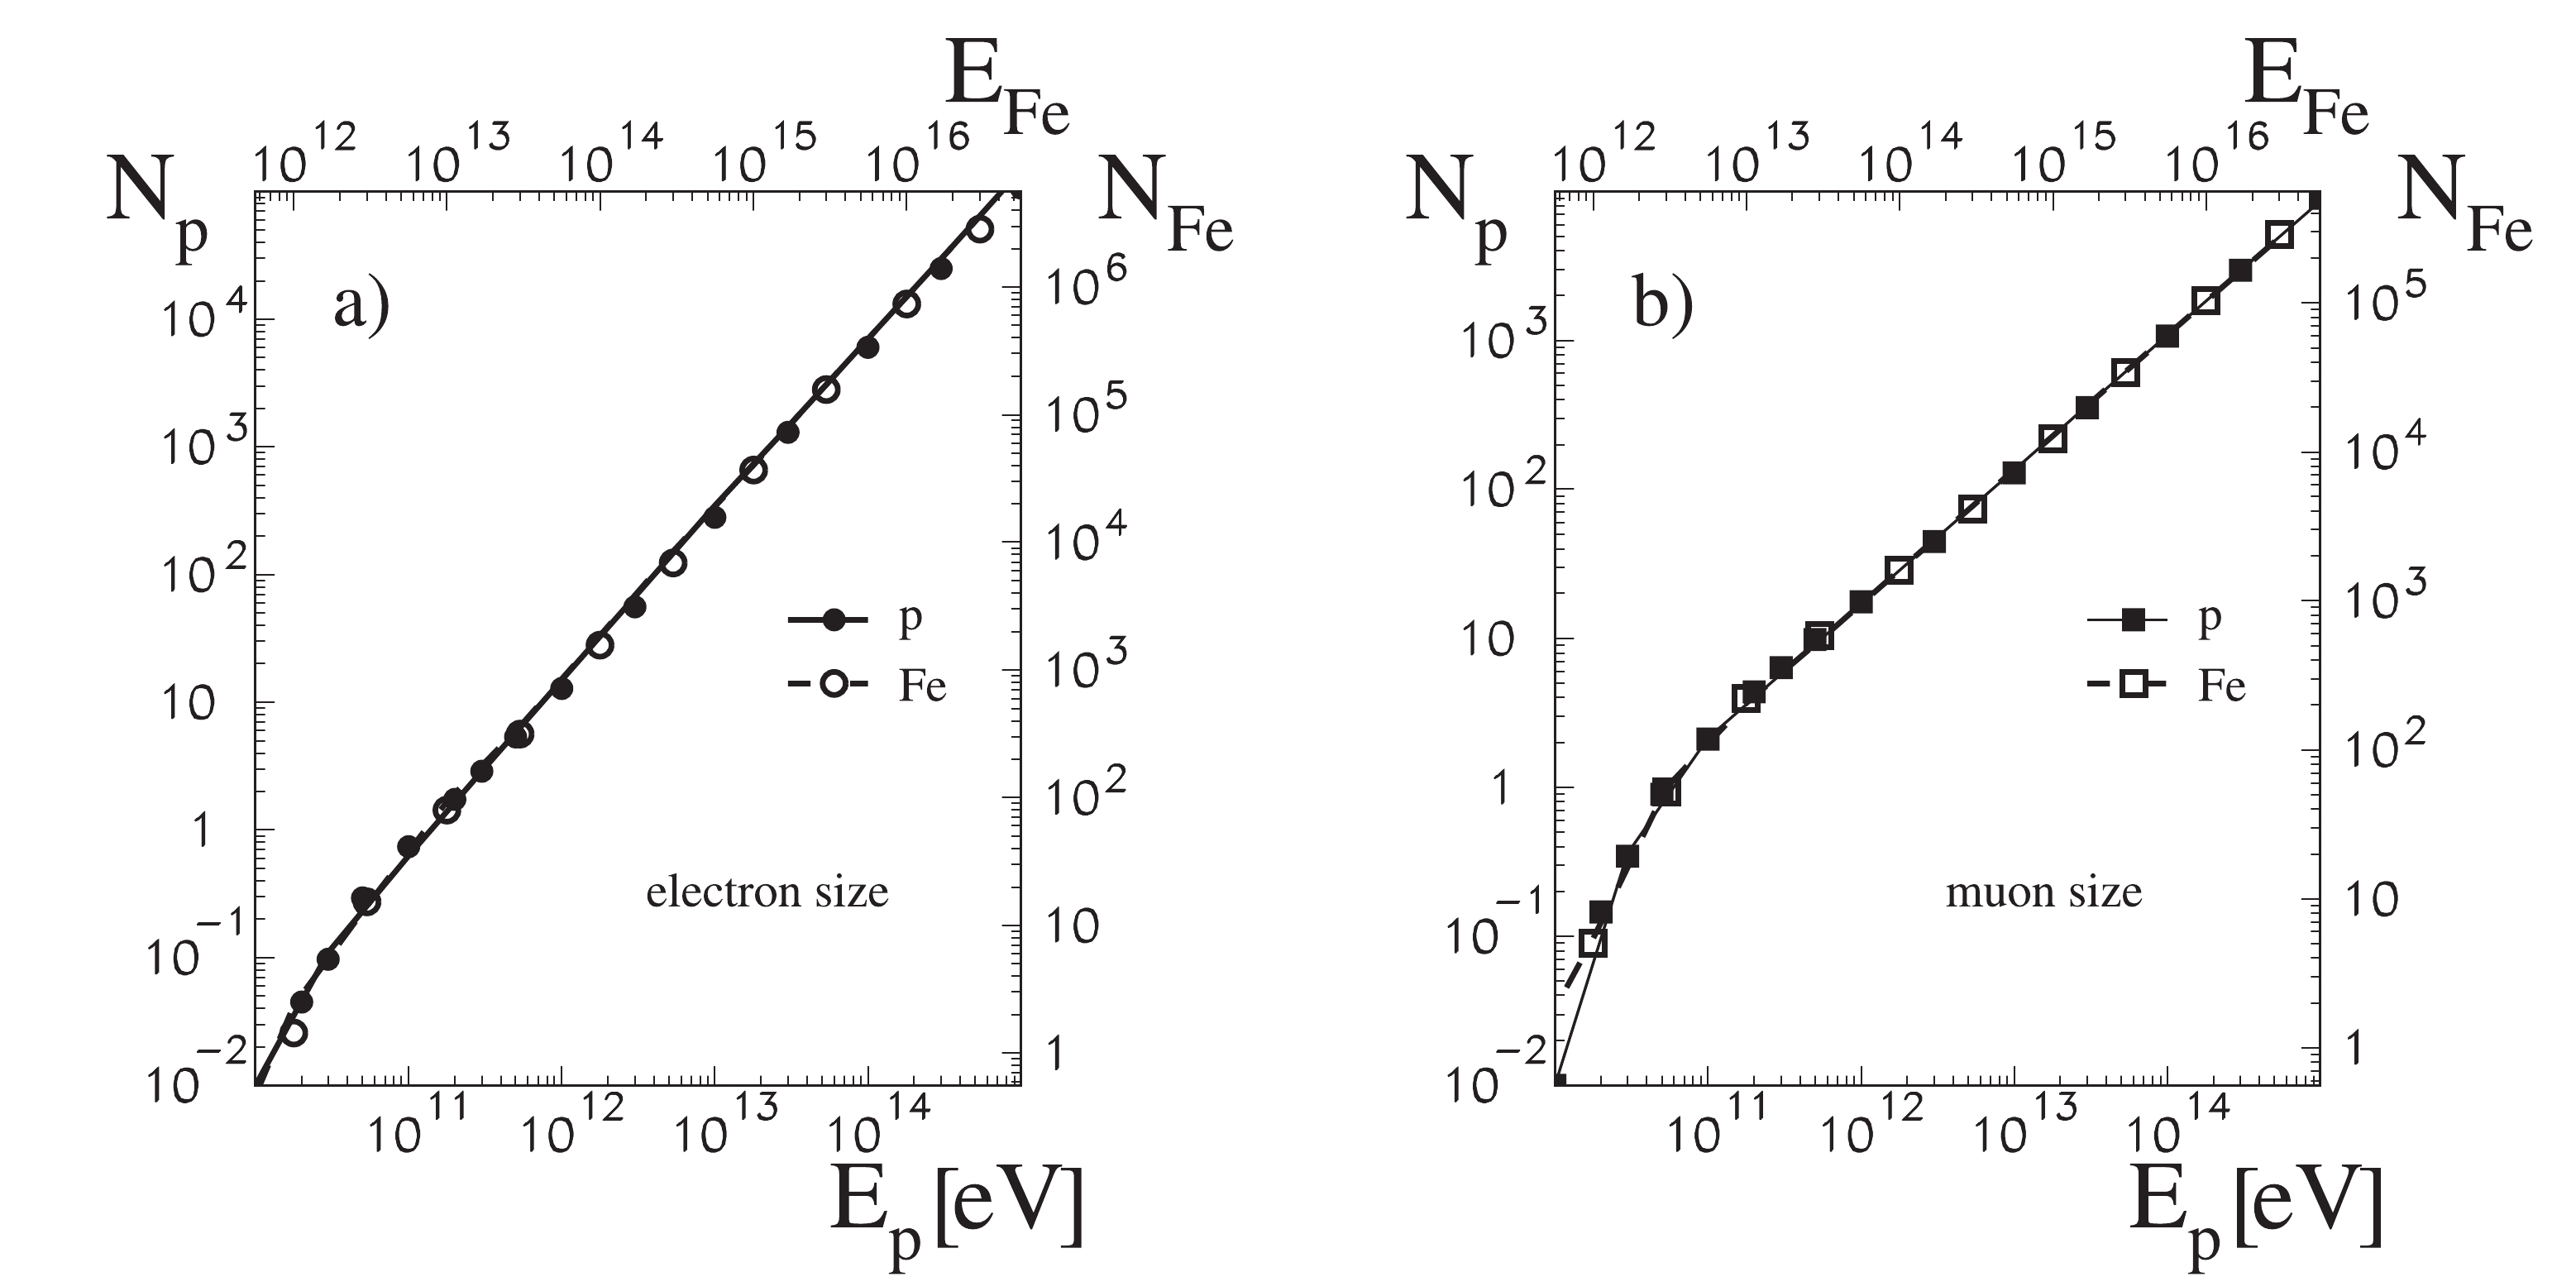
Figure 3. Average electron (a) and muon (b) numbers in CORSIKA showers initiated by protons (solid circles - scales on the left and bottom) and by iron nuclei shifted, respectively, according to the superposition model (empty circles - scales on the right and on the top). Lines depict results obtained by our “fast small shower generator:" solid for protons and dashed for iron initiated showers.
-
First, the simplest assumption concerning the relationship between quantities describing showers initiated by protons and by the complex atomic nuclei is the assumption of simple superposition. According to this concept, a nucleus is considered a set of single nucleons, which behave like protons in their interaction with the nuclei of atoms of the Earth's atmosphere. Consequently, a shower initiated by, for example, an iron nucleus is the same as 56 proton showers. This assumption is relatively natural and correct to a large extent, as can be observed in Fig. 3, where the average sizes of proton showers are compared with the sizes of iron showers divided by 56 and shifted on the energy scale to the same energy per nucleon.
The superposition model was also adopted to compare the number of showers with no particle at the observation level in the proton and iron events illustrated in Fig. 2. The possibility that none of the
$ 56 $ showers, which are parts of a shower initiated by an iron nucleus, will have any particle at the observation level, i.e., electrons Fig. 2a), muons Fig. 2b), or none of them Fig. 2c), corresponds to a$ 56 $ -fold observation of an "empty" proton shower with the same energy per nucleon. The result of such an assumption is presented in Fig. 2 by empty squares connected with a dotted line.Both of these observations (of the CORSIKA results) indicate that the superposition assumption is correct; however, this is not entirely and exactly true. Another important characteristic of EAS, which is indispensable for carrying out correct calculations of particle fluxes in small showers, is the size of fluctuations of shower sizes at small energies of particles that are initiating them. Examples of such fluctuations are presented in Fig. 1. As we have already demonstrated, in the first moments, the average values of these distributions agree with the superposition assumption; however, in the case of the second moments, this phenomenon is not as significant.
Figure 4 presents the dispersion of the logarithm of the electron (a) and muon (b) size distributions as a function of the energies of the protons and iron nuclei initiating the showers. The energy scales, abscissa, at the top and bottom are for the iron and proton showers, respectively, and the ordinates are depicted on the left for proton and on the right for iron showers (see Fig. 3). Energy scales for iron showers correspond to the same energy per nucleon as respective scales for proton induced showers. The ordinate for iron showers (right) is scaled down by
$ \sqrt {56} $ . In the simple superposition figure, the dispersion of$ 56 $ independent proton showers would correspond to the expected dispersion for iron induced showers.
Figure 4. Dispersion of the logarithm of electron (a) and muon (b) numbers in CORSIKA showers initiated by protons (solid circles - scales on the left and bottom) and by iron nuclei shifted, respectively, according to the superposition model of the shower development (empty circles - scales on the right and on the top). Lines represent results obtained by our "fast small shower generator:" solid for protons and dashed for iron initiated showers.
As can be observed, the points from simulation calculations with the CORSIKA program for proton initiated showers do not overlap with the correspondingly shifted values for iron showers. We ignore the moment of discrepancies for very small showers with sizes below approximately 10 particles (for irons below
$ \sim 5 \times 10^{13} $ , for protons below$ \sim 10^{12} $ ). Outside this area, the fluctuations for iron induced showers are definitely wider, by approximately 50% for electron size, and slightly smaller by about 30% for muon size from expectation corresponding to proton showers at corresponding energies. We will explain this discrepancy below. The lines in Fig. 4 represent our proposed solution, the results of the “fast small shower generator.” -
It has been known for many years that the transverse distributions of particles in extensive air showers are well described by a simple formula proposed by Greisen [19]. Its validity was confirmed by the theoretical considerations and numerical calculations with respect to electromagnetic cascades by Kamata and Nishimura [20]; hence, its commonly accepted name: Nishimura-Kamata -Greisen (NKG) function
$ \rho_{e/\mu}(r) = {N_{e/\mu} \over 2 \pi r_0^2}\: {\Gamma(4.5-s) \over \Gamma(s)\:\Gamma(4.5-2s)}\left({r\over r_0}\right)^{s-2} \left({1+{r\over r_0}}\right)^{s-4.5}\; \; \; , $

(1) where
$ N_{e/\mu} $ is the electron/muon shower size,$ r_0 $ is a radial scale parameter, which is called the Molière unit in the case of the electromagnetic cascade theory, and is equal to approximately 2 radiation length units above the observation level. In addition,$ s $ represents the age parameter.Figure 5 presents transverse distributions of electrons and muons in small vertical showers initiated by protons and iron nuclei with relatively high energies (10
$ ^{13} $ and 10$ ^{15} $ eV). As can be observed, the NKG function satisfactorily describes these distributions. It is evident that muons propagate to larger distances from the shower axis. The 'age parameter'$ s $ characterizing the slope of the distributions, as well as the characteristic scale parameter$ r_0 $ , is larger for muons than for electrons. The description of the lateral spread with the NKG function becomes problematic for very small showers. If the number of particles is small, one cannot refer to their distribution in a single event. Only the mean distribution can make some sense; however, even when applied to a single shower, it makes little sense because of the significant distortion via event-by-event fluctuations. Figure 6 illustrates this situation. It shows the averaged transverse distributions of electrons and muons in showers initiated by protons with energies$ 10^{10} $ eV and$ 10^{11} $ eV.
Figure 5. Radial distribution of electrons (circles) and muons (squares) for CORSIKA showers of different energies:
$ 10^{13} $ a) and b) and$ 10^{15} $ c) for showers initiated by iron nuclei a) and protons b) and c). The lines represent fits of the NKG function.
Figure 6. Radial distribution of electrons (circles) and muons (squares) for CORSIKA showers of extremely small energies:
$ 10^{10} $ a) and$ 10^{11} $ b) for showers initiated by protons, and$ 10^{12} $ for those by iron nuclei c). The lines represent "fits" of the NKG function.For showers containing an average of approximately 1 particle, which corresponds to a (mean) central density of 10
$ ^{-6} $ per m$ ^2 $ (100 GeV proton – Fig. 6b)), the NKG function does not yet perform poorly in describing the mean distributions of electrons and muons; however, at densities of 10$ ^{-8} $ per m$ ^2 $ , which is the case as observed in Fig. 3 for 10 GeV protons and iron nuclei with a total energy of 1 TeV, the distributions can be considered to be almost uniform, and shower particles can appear almost everywhere, up to a distance of several hundred meters from the shower axis.For the purposes of this study, the lack of a statistically verified mean distribution of particles in very small showers is not particularly important, because the integrals of these distributions we eventually aim for will be normalized by the total number of particles in such showers, which will be approximately 0.01, as shown in Fig. 3.
-
The above described characteristics of EAS simulated with the CORSIKA program have been parameterized. Based on this procedure, we have obtained the following:
$ - $ probability that the shower does not contain any particle$ Z $ ,$ - $ average number of particles in the shower$ \langle N\rangle $ ,$ - $ logarithmic dispersion of the actual size,$ - $ age parameter$ s $ ,$ - $ radial distribution scale parameter$ r_0 $ for shower electrons and muons, separately. These quantities were obtained for different primary energies of cosmic ray particles, for a few (zenith) angles of the arrival of the particle, and for primary protons and iron nuclei
-
First, we verified a simple superposition model that allows us to discard the mass of the primary particle as an independent variable from our descriptions. As we have already demonstrated, this model works well for
$ Z $ and$ \langle N \rangle $ variables. We have observed a significant discrepancy by comparing the dispersion (logarithmic) of the total number of particles for protons and iron nuclei. The observed value is greater than expected. The expectations obtained via scaling by the square root of the mass number$ \sqrt{56} $ spread of the iron shower's size indicates the existence of a correlation between the "sub-shower components," provided some kind of superposition is assumed.The simplest introduction of correlations among
$ A $ independent nucleon (proton) sub-showers with the same energy per nucleon as the complex nucleus they are supposed to mimic is to assume that some of them have identical actual sizes. This decreases the number of independent compounds, thus increasing dispersion, the spread of additive shower parameters.It is well known that the main source of shower fluctuations is the height of the first interaction, which is related to the cross section of the interaction; hence, it is practical and theoretically justified to assume that the number of identical sub-shower components is proportional to the number of wounded nucleons in the interaction of the cosmic ray nucleus with the atomic nucleus of the atmosphere. Certainly, we are only referring to the wounded nucleon of the beam nucleus
$ A $ .In the case of iron and the atmospheric nucleus of nitrogen, the average number of wounded nucleons at the energies of interest in iron is approximately 12. Because we intend to use our superposition model also for other nuclei, we have approximately parameterized the number of wounded nucleons as a function of mass number, as presented in Fig. 7.
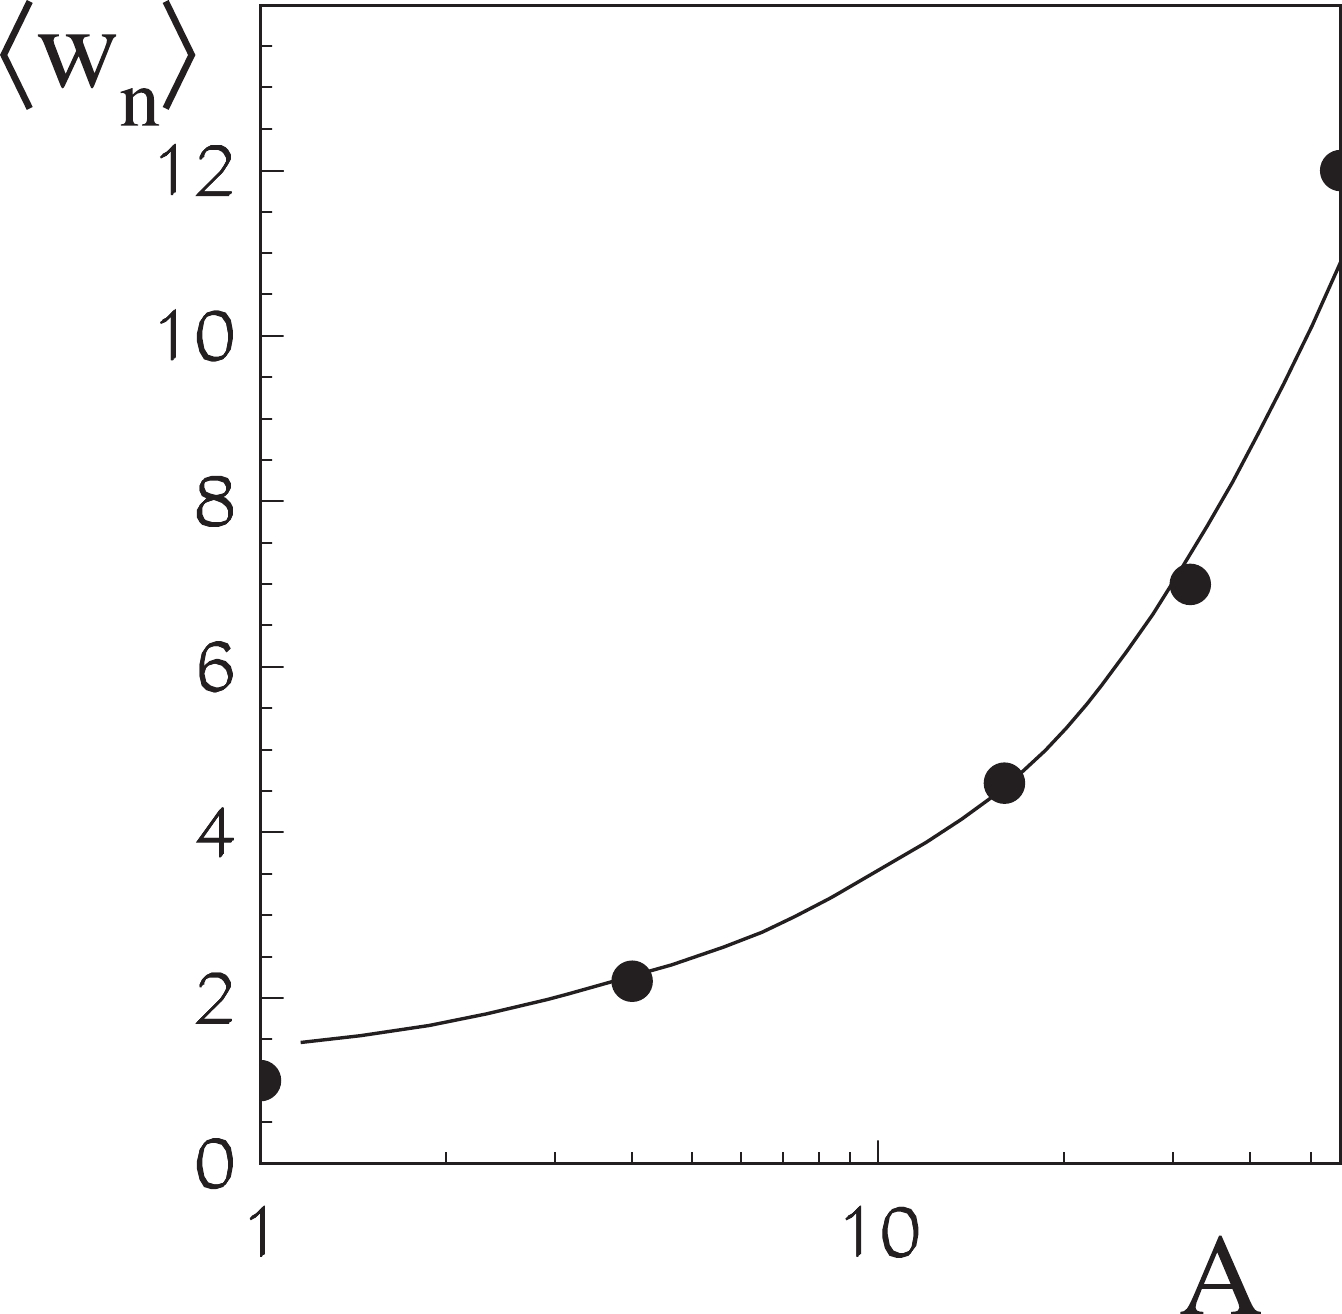
Figure 7. Number of wounded nucleons of cosmic ray nucleus interacting with the atomic nucleus of the atmosphere. The line depicts a parabolic (in logarithmic scale) approximation used as the first attempt in our small shower generator.
The calculations performed indicate that the function presented in Fig. 7 does not provide a sufficient increase in the dispersion of the distribution (logarithmic) of the number of electrons and muons in iron showers. Because the assumption that the number of identical sub-showers depends on the number of wounded nucleons seems to be well-founded, in the next step, we assumed that it is not exactly equal but proportional to the number of wounded nucleons leaving the proportionality factor as a free parameter to be adjusted to the CORSIKA results. The actual integer number of identical sub-showers in each nucleus induced shower fluctuates according to a binomial distribution.
The results of the modified superposition model are shown in Fig. 4 for electrons and muons. As can be observed, in the region where the shower sizes are sufficiently large, we have obtained a sufficient agreement with CORSIKA simulations. As already mentioned, for very small showers, the integer number of particles in single showers and the combination of the physical spread with the effect from the Poisson distribution play a dominant role.
-
The modified superposition method provides an opportunity to determine the average size (electrons and muons) of the shower initiated by any nucleus from H (protons) to Fe (iron), which dominate the cosmic ray flux of energies in the range of our interest from 10
$ ^{10} $ eV to 10$ ^{16} $ eV. The dispersion determined allows us to consider the random spread of the shower size at a fixed energy of the primary particle. Some examples are illustrated in Fig. 8.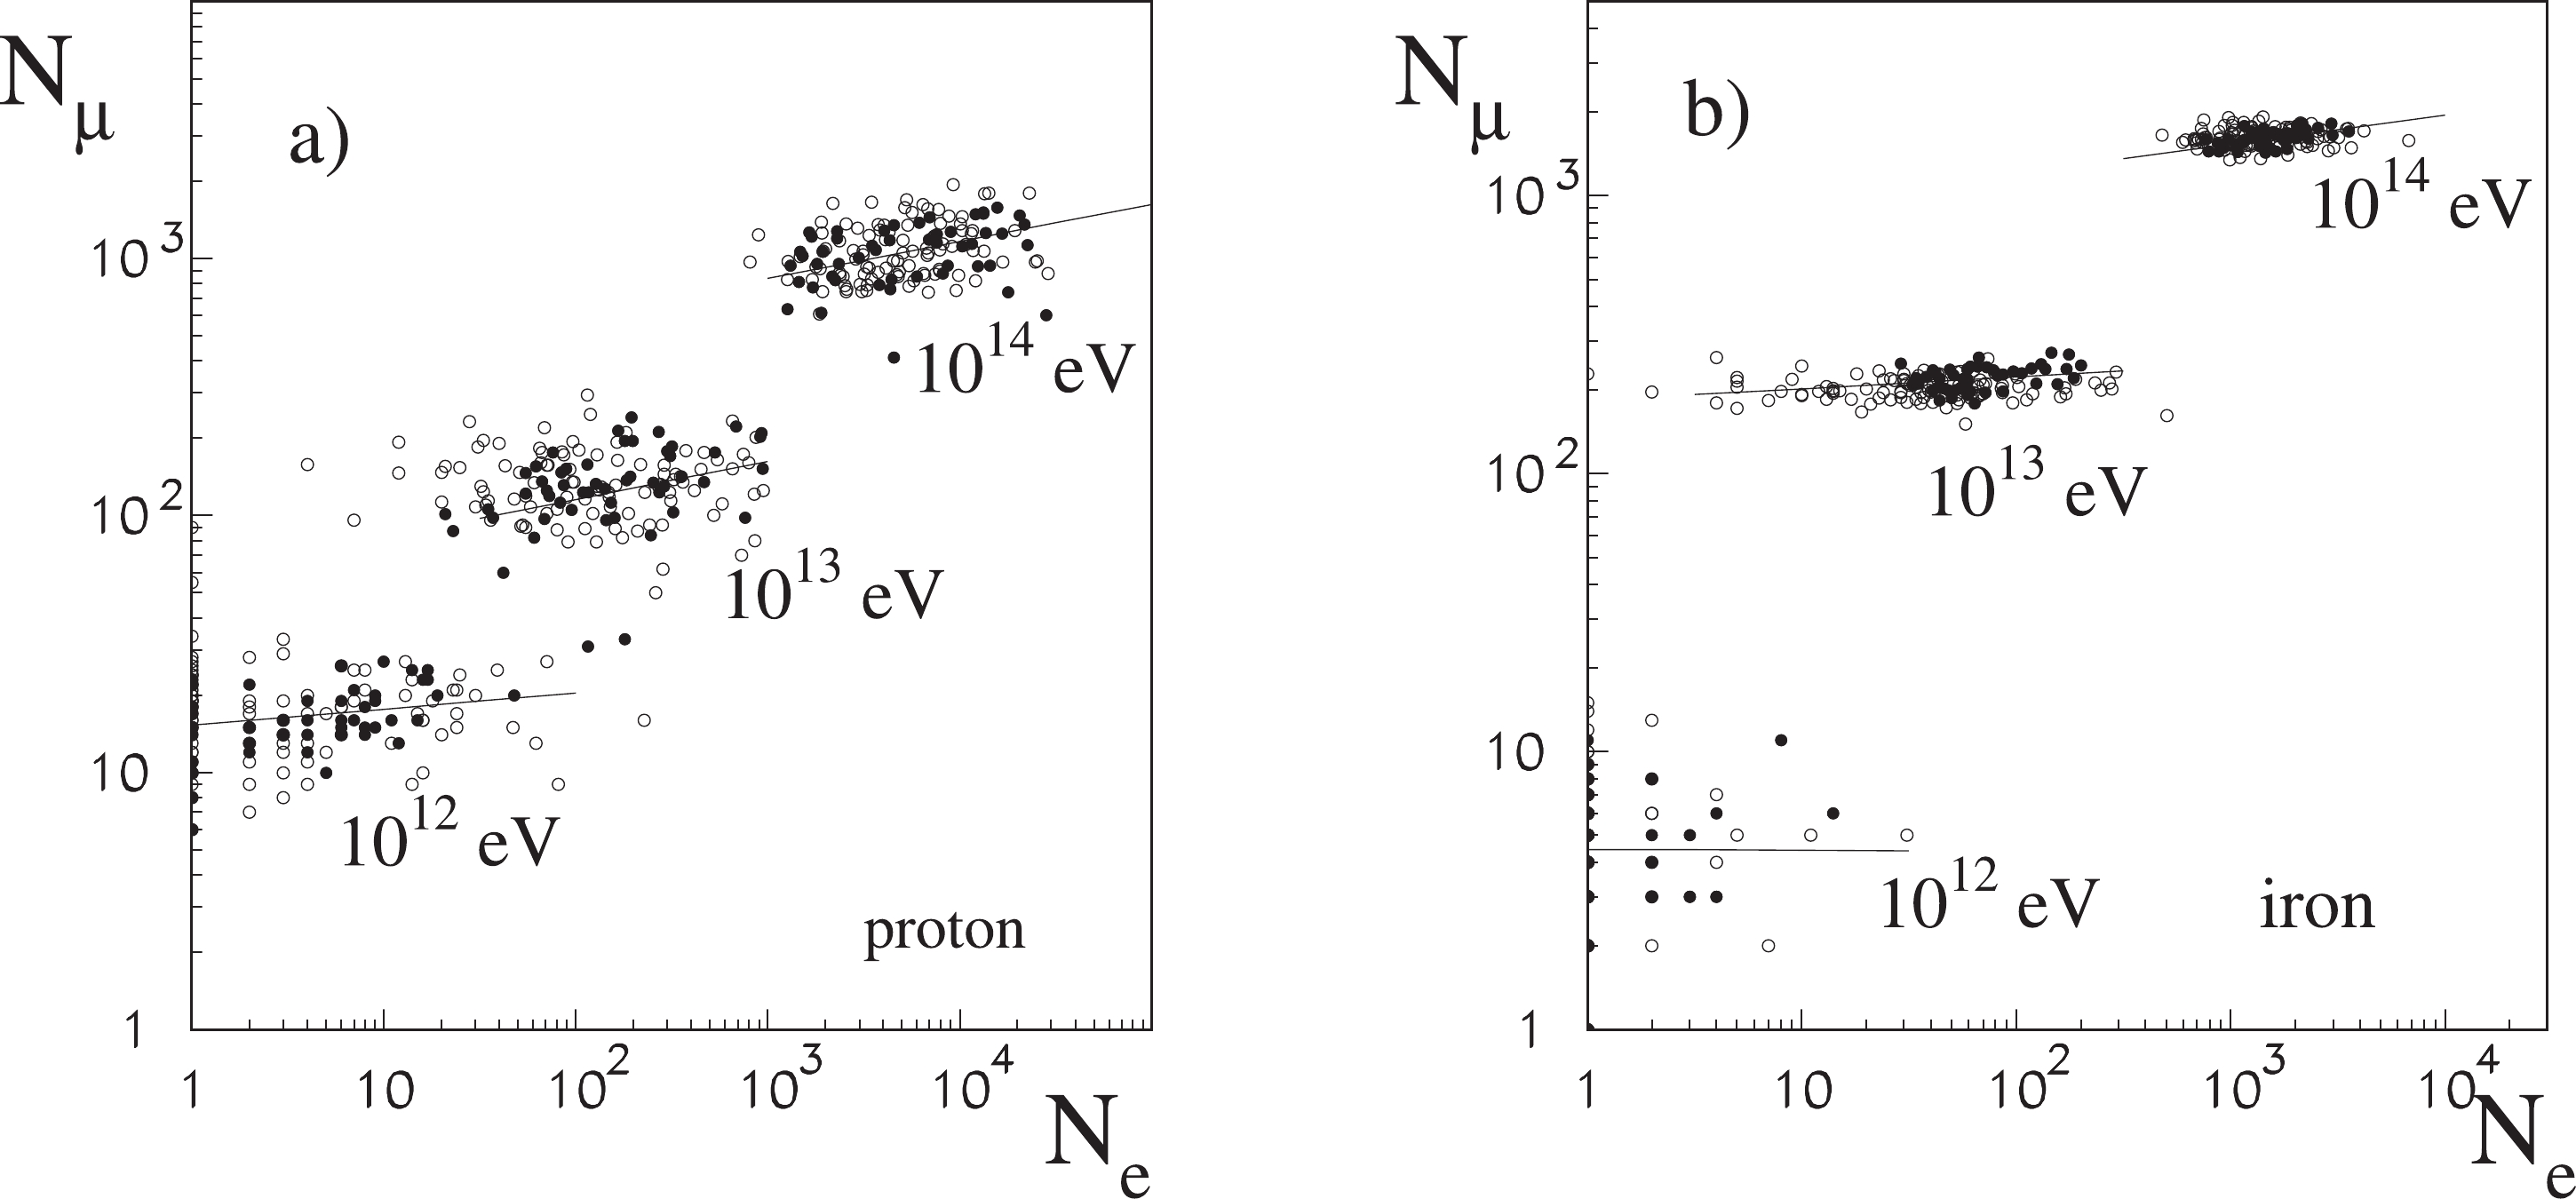
Figure 8. Correlation between muon and electron sizes for vertical proton a) and iron b) showers of 10
$ ^{12} $ eV, 10$ ^{13} $ eV, and 10$ ^{14} $ eV in CORSIKA showers (filled points) and our generator results (empty points). The lines represent linear correlations (in log$ \times $ log scales) determined for CORSIKA showers.There is a weak positive correlation between moun and electron sizes of CORSIKA showers, which is represented in Fig. 8 by solid lines and introduced in our small shower generator.
The dependence of the average number and dispersion of electrons and muons on the energy of the primary proton, shown in the figures above, was obtained for vertical showers. Simulations for inclined showers allowed to parametrize all these dependencies as functions of the arriving particle zenith angle.
For the particular size, the radial distribution of shower particles (for electrons and muons separately, with different scale paramerer
$ r_0 $ ) in the form of Eq. (1) can be determined using the age parameter$ s $ adjusted to small shower CORSIKA results, considering the geometry of inclined showers.These findings are already sufficient to formulate a simple algorithm generating small EAS that will resemble the EAS generated by the CORSIKA program. Examples of showers generated in this manner are presented in Fig. 9.
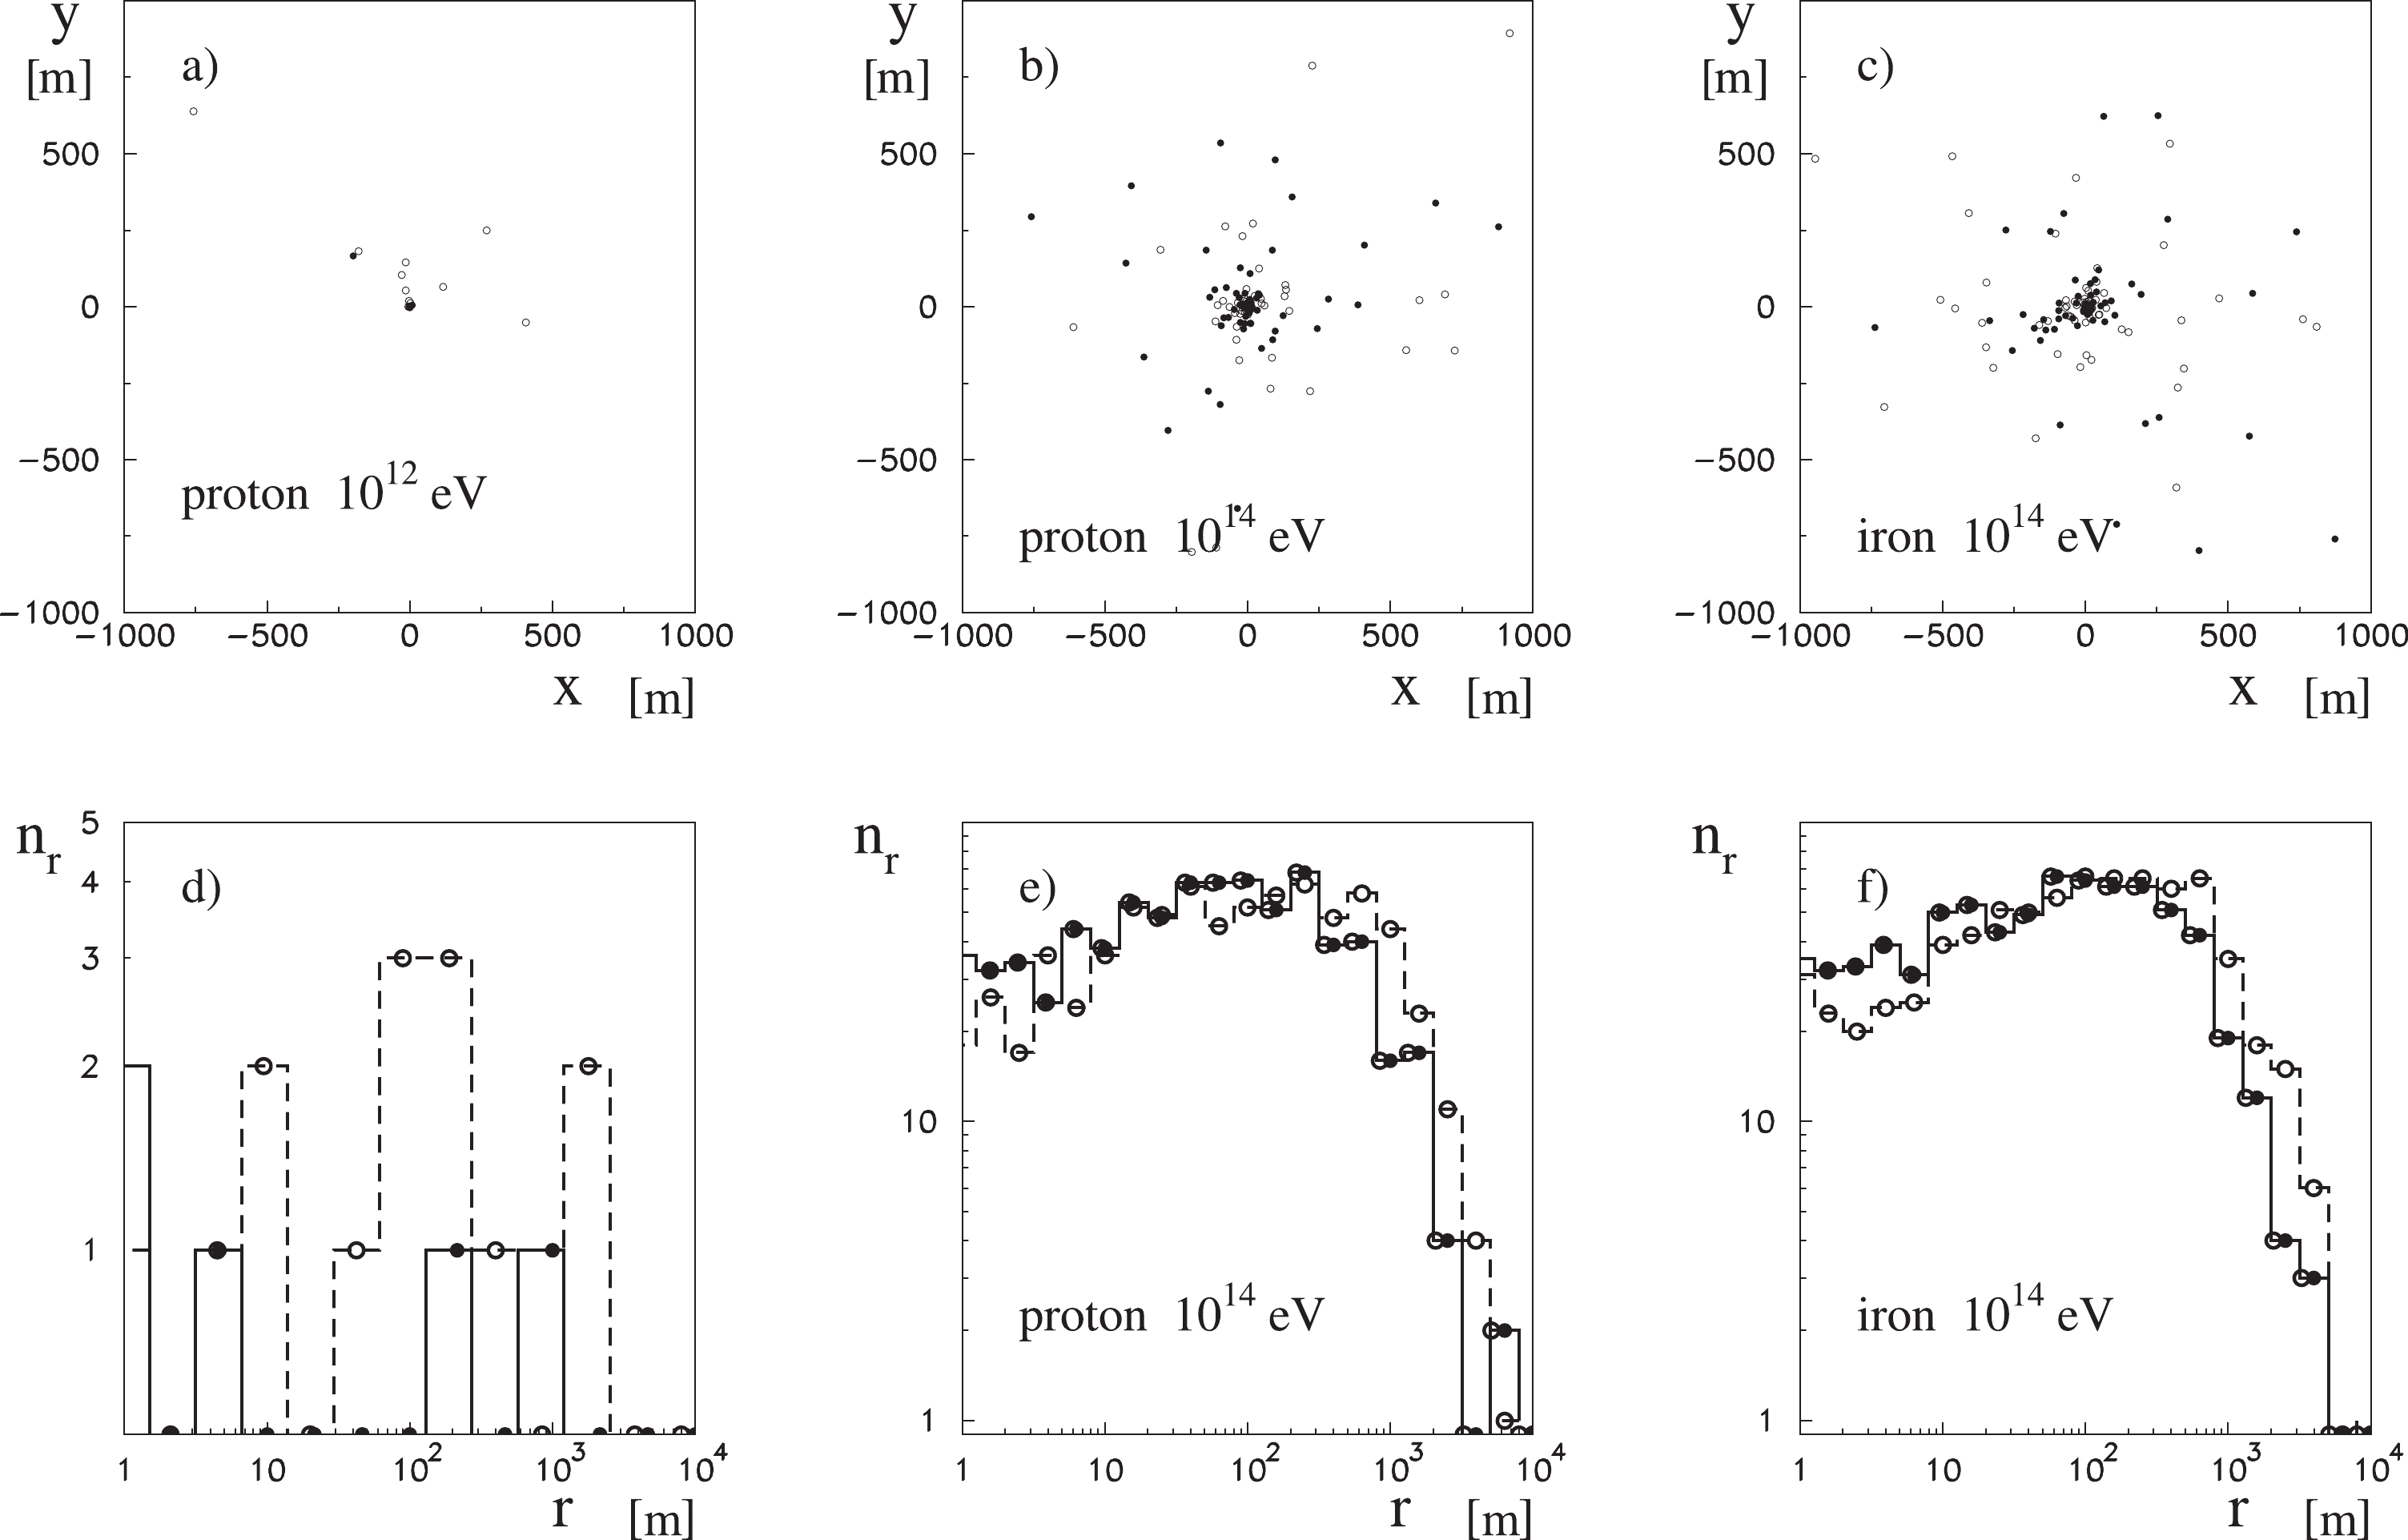
Figure 9. Examples of showers generated by our small shower generator. The
$ (x\times y) $ distribution of electrons (filled circles) and mouns (empty circles) for proton shower of energies 10$ ^{12} $ eV (a) and 10$ ^{14} $ eV b) and iron shower with energy of 10$ ^{14} $ eV c) (for b) and c), only 100 particles are plotted). Bottom histograms d), e), and f) show radial distributions of particles in these showers, respectively.Eventually, the procedure is developed to generate the particular density of shower particles (electrons and muons) in the shower initiated by any cosmic ray primary particle of any energy, pointing to any point on the observation plane at any shower inclination. This allows to compare the results of our small shower generator, not only with the CORSIKA showers that it is based on but also with experimental results.
-
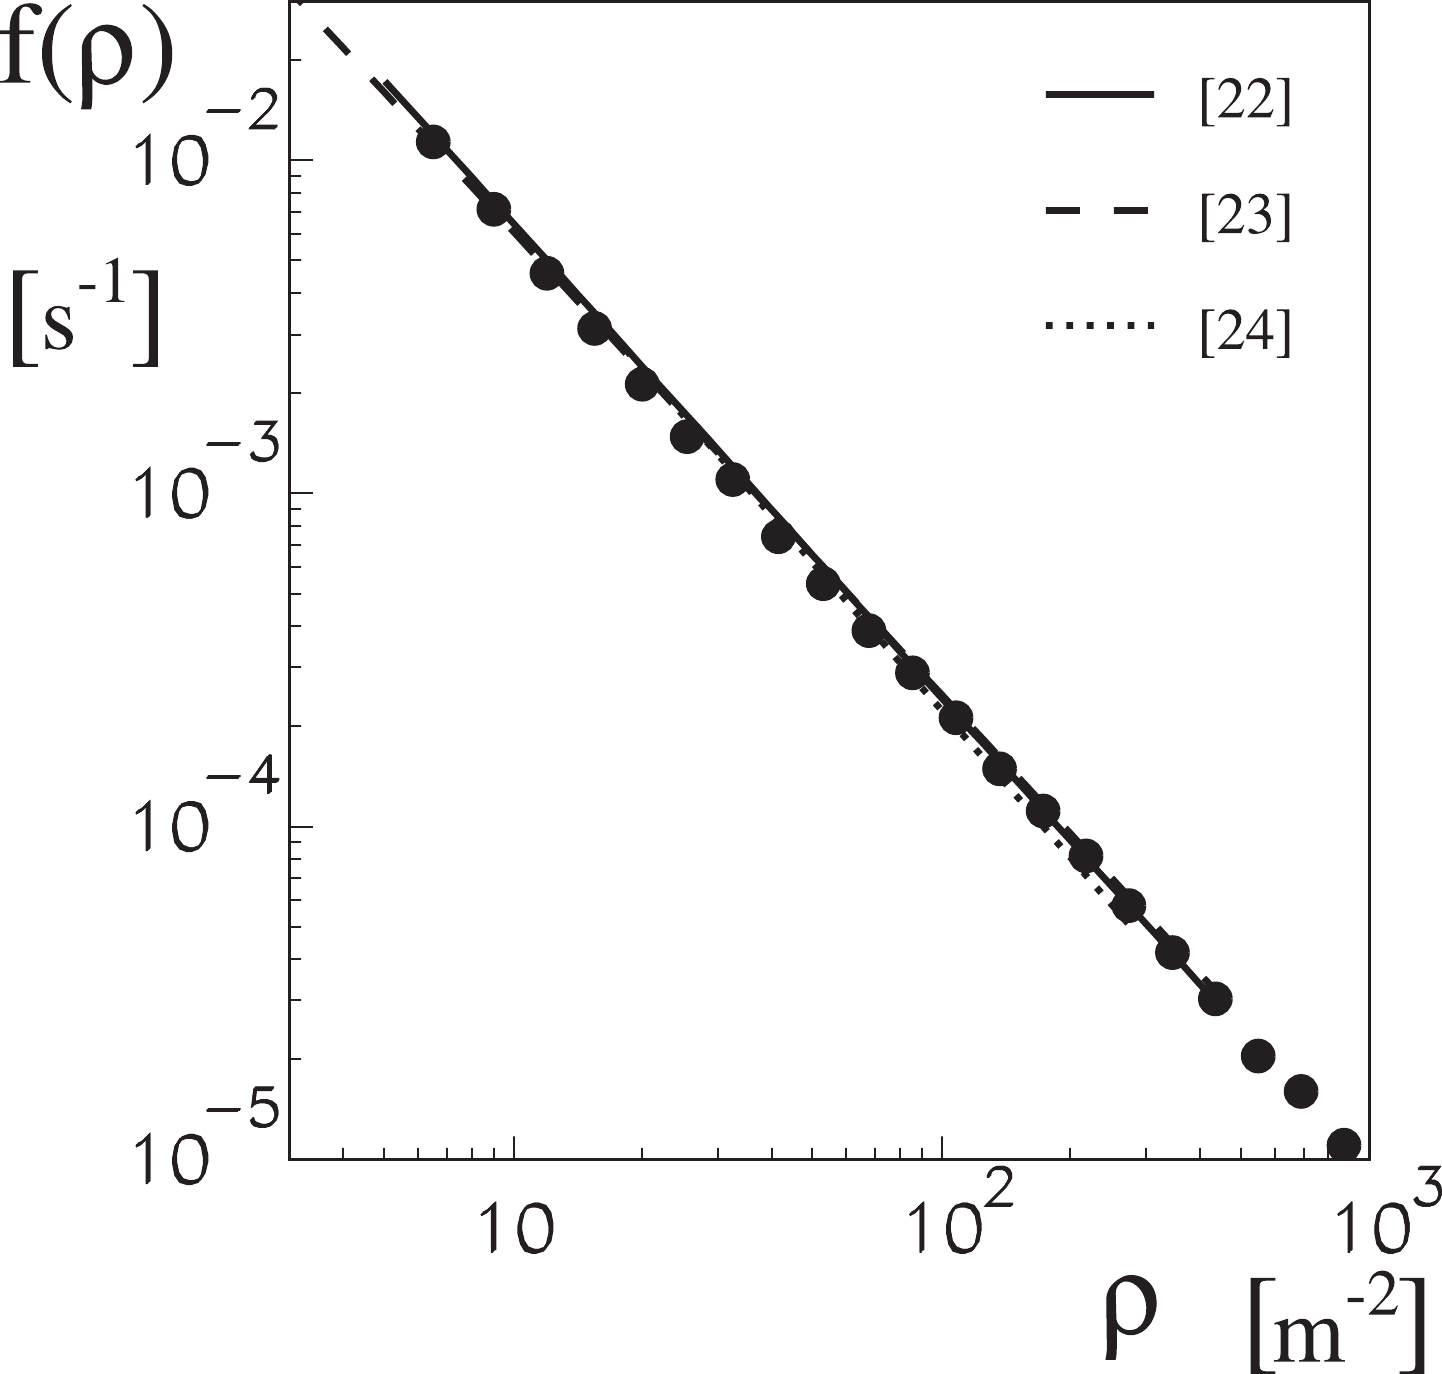
The shower particles density spectrum was measured since at least the middle of the last century. The form of the spectrum determined agreed with a simple power law formula, for example the one measured by Cocconi, Loverdo, and Tongiorgi in 1946 for densities from approximately 10 to 1000 particles per meter squared [21, 22]
$ N(x) = 700 \times x^{-1.47} , $

(2) where
$ x $ represents the particle density (m$ ^{-2} $ ) and$ N $ is the rate of events of densities higher than$ x $ (hour$ ^{-1} $ ). Another example is the result obtained by Broadbent et al. in 1950:$ \left( 620 \times x^{-1.425}\right) $ for slightly lower densities [23], and the one by Norman in 1956:$ \left(540 \times x^{-1.39}\right) $ (for$ x<500 $ per m$ ^{2} $ ) [24], or Greisen in 1960, who presents a similar expression for the density spectrum in the range$ 1 < x <10^4 $ per m$ ^{2} $ with the index of$ (-1.3) $ [25].With our fast small shower generator, which not only reproduces the average shower characteristics determined for a fixed energy of the primary particle (including its mass and angle of arrival) but also considers respective dispersions, the multidimensional Monte Carlo integration can be carried out to obtain the shower particle density observed with a single small detector. The general formula is quite trivial:
$ \begin{aligned}[b] f(\varrho_{e/\mu}) =& \sum_A \: \int \limits_{10^9}^{10^{16}} {\rm d}E \:\: \Phi_A(E)\: \int\limits_0^{90}{\rm d}\phi\: \int {\rm d}{N_{e/\mu}}\:\\&\times p\left( N_{e/\mu},\langle N_{e/\mu}\rangle\right) (E,A,\phi) \\ &\times \:\int\limits_{\rm -2km}^{\rm 2km}{\rm d}x \:{\rm d}y\: 2\pi\:\sin(\phi)\:\cos(\phi)\:\varrho(r) , \end{aligned} $

(3) where
$ A $ represents the mass number of the primary cosmic ray nucleus,$ \Phi_A(E) $ is the cosmic ray energy spectrum of the component of mass$ A $ ,$ \langle N_{e/\mu}\rangle (E,A,\phi) $ indicates the average electron/muon size of the EAS initiated by the particle of mass$ A $ , energy$ E $ originates from the direction specified by the zenith angle$ \phi $ , and$ p\left( N_{e/\mu},\langle N_{e/\mu}\rangle \right) $ is the probability density distribution that the actual electron/muon shower size is$ N_{e/\mu} $ when the expected value is$ \langle N_{e/\mu}\rangle $ .The charged particle density is
$\varrho = \Big[ \rho_e \left( r(x, y, \phi)\right)+ $ $ \rho_\mu \left(r(x, y, \phi) \right) \Big]$ , where$ \rho_{e/\mu} $ represents the electron/ muon density described by the NKG-type formula in Eq. (1) with adjusted parameters$ r_0 $ and$ s $ , which again depend on primary particle energy, mass, and angle. The radius$ r $ is the distance to the shower axis, whereas$ x $ and$ y $ specify the position of the shower core in the observation plane.The upper limit of the primary particle energy spectrum depends on the values of densities we attempt to study. This study is concerned with small densities and small showers; hence, if we limit ourselves to densities not exceeding a few hundred per m
$ ^2 $ , the 10$ ^{16} $ -eV limit is quite sufficient, as will be verified in this paper. The$ 2 $ km limit on the$ r $ integration is again considered with a surplus that is safe for the problem we are discussing.Summing over the mass spectrum of cosmic ray particles, for practical reasons, as it is conventionally practiced, was changed to summing over a few groups of particles with similar masses: protons (
$ A = 1 $ ), Helium ($ A = 4 $ ), CNO ($ A = 14 $ ), Medium ($ A = 28 $ ), and Iron group ($ A = 56 $ ). Uncertainties associated with such a simplification are negligible, considering the statistical scattering and smearing of EAS parameters by the process of particle transport in the atmosphere. In the energy region of interest, a large amount of data exist on mass composition obtained from direct satellite, balloon, and extensive air shower experiments at high altitudes and sea levels. However, the question of the distribution of cosmic ray nuclei masses remains unresolved. There are essentially two models competing in the literature, both with solid theoretical justification, and both describing several of the observed shower parameters. The first one, called heavy dominant (HD), may be related to a supernova acceleration and rigidity dependent propagation model, such that the proton component is assumed to bend at an energy of approximately 10$ ^{14} $ eV. The second, a proton dominant model (PD), assumes a proton dominant chemical composition over the entire knee energy region of our interest. The fractions of mass groups in two models at the total energy of 10$ ^{14} $ eV are: protons - 26 (34), Helium - 14 (17), CNO - 19 (19), Medium - 18 (16), Iron - 23 (14), where the first numbers are for the HD model, while those in brackets are for the PD model, respectively [26]. The absolute flux of each composition agrees with that obtained by measurements in the energy region at approximately 10$ ^{13} $ – 10$ ^{14} $ eV [27].Certainly, if the total observed flux of primary cosmic radiation solely comprises iron nuclei, the flux of muons, as well as electrons, would be significantly larger than that of a purely proton composition; however, the differences in particle intensities at sea level for mixed mass spectrum compositions, PD and HD, are small, the calculated total muon flux at the sea level is 97 m
$ ^{-2} $ s$ ^{-1} $ , and the electron flux is 29 m$ ^{-2} $ s$ ^{-1} $ for both models. The total flux of primary cosmic rays for both compositions was the same [28].The integration results in Eq. (3) are depicted in Fig. 10, in comparison with measured results presented above [22-24]. As can be observed, the agreement exhibited is very good.
Studies on the particle density spectra allow, to some extent, conclusions to be drawn on the energy spectrum of cosmic ray particles at the top of the atmosphere. In addition, averaging over the position of the shower axis (
$ x $ ,$ y $ ) does not definitely cancel the complex proportionality (averaged) observed on a single detector particle density with the mean energy of primary particle corresponding to this density. Obviously, the simple proportionality between the density$ \rho $ and the energy$ E $ is smeared out owing to the propagation of the shower in the atmosphere; however, the study on the slope of the density spectrum allows general conclusions to be drawn on the primary energy spectrum. In accordance with this idea, in 1957, Zawadzki proposed, for the first time, the observation of an abrupt change in the density spectrum [29], eventually confirmed later in several EAS experiments and conventionally known today as the "knee." -
By integrating the spectra illustrated in Fig. 11 , we can obtain the fractions of corresponding observations and, for example, the rate of registering single muons.

Figure 11. Primary particle energy spectra leading to the observation on a 1 m
$ ^2 $ detector of 1, 2, 3, 4, and 5 particles: electrons (solid lines) and muons (dashed lines).If we measure the number of particles observed on a 1 m2 detector, each observed value corresponds to a different distribution of the primary particle energy. The results of the calculation are presented in Fig. 11, where the energy spectra of the primary particles leading to observations of 1, 2, 3, 4, and 5 electrons (solid lines) and muons (dashed lines) are illustrated. These results lead to some important conclusions:
$ - $ for single muon or electron registrations, the lower energy limit of the primary particle energy is below 10$ ^{11} $ eV$ - $ the rate of registration of single muons is several times higher than that of single electrons.$ - $ simultaneous registrations of several electrons (on a 1 m2 detector) effectively start from the primary particle energy of 10$ ^{12} $ eV for double registrations, up to 10$ ^{14} $ eV for the simultaneous registrations of 5 particles.$ - $ cases of simultaneous registrations of more than one muon are significantly rarer than those of more than one electron, and the primary energy required is substantially higher.By integrating the spectra shown in Fig. 11 , we can obtain the fractions of corresponding observations and, accordingly, the rate of registering single muons.
-
As already mentioned in Sec. I, the main application of the small shower generator is to assist in the interpretation of data from small shower arrays, either for educational purposes or for its applications in integrated networks of such local stations.
For example, let us assume that such stations would consist of four identical detectors located not far from each other (at a distance of 5 meters). We assume that the detector is ideal and generates no noise, which allows the interpretation of events when only one of the detectors has registered anything, usually one particle. The practical importance of cases where one detector registers several particles according to the results shown in Fig. 11 is negligible. Although these events are very rare, such cases can be analysed via the simulations of the small shower generator.
Let us further assume that every registration of a particle by any detector will trigger an event and that the binary state (hit/no hit) of each detector will be stored.
The small shower generator will help in answering the question on the energy of the primary particle required, or more precisely, the question on the energy distribution that should be associated with a given type of coincidence. Examples of such results are presented in Fig. 12.
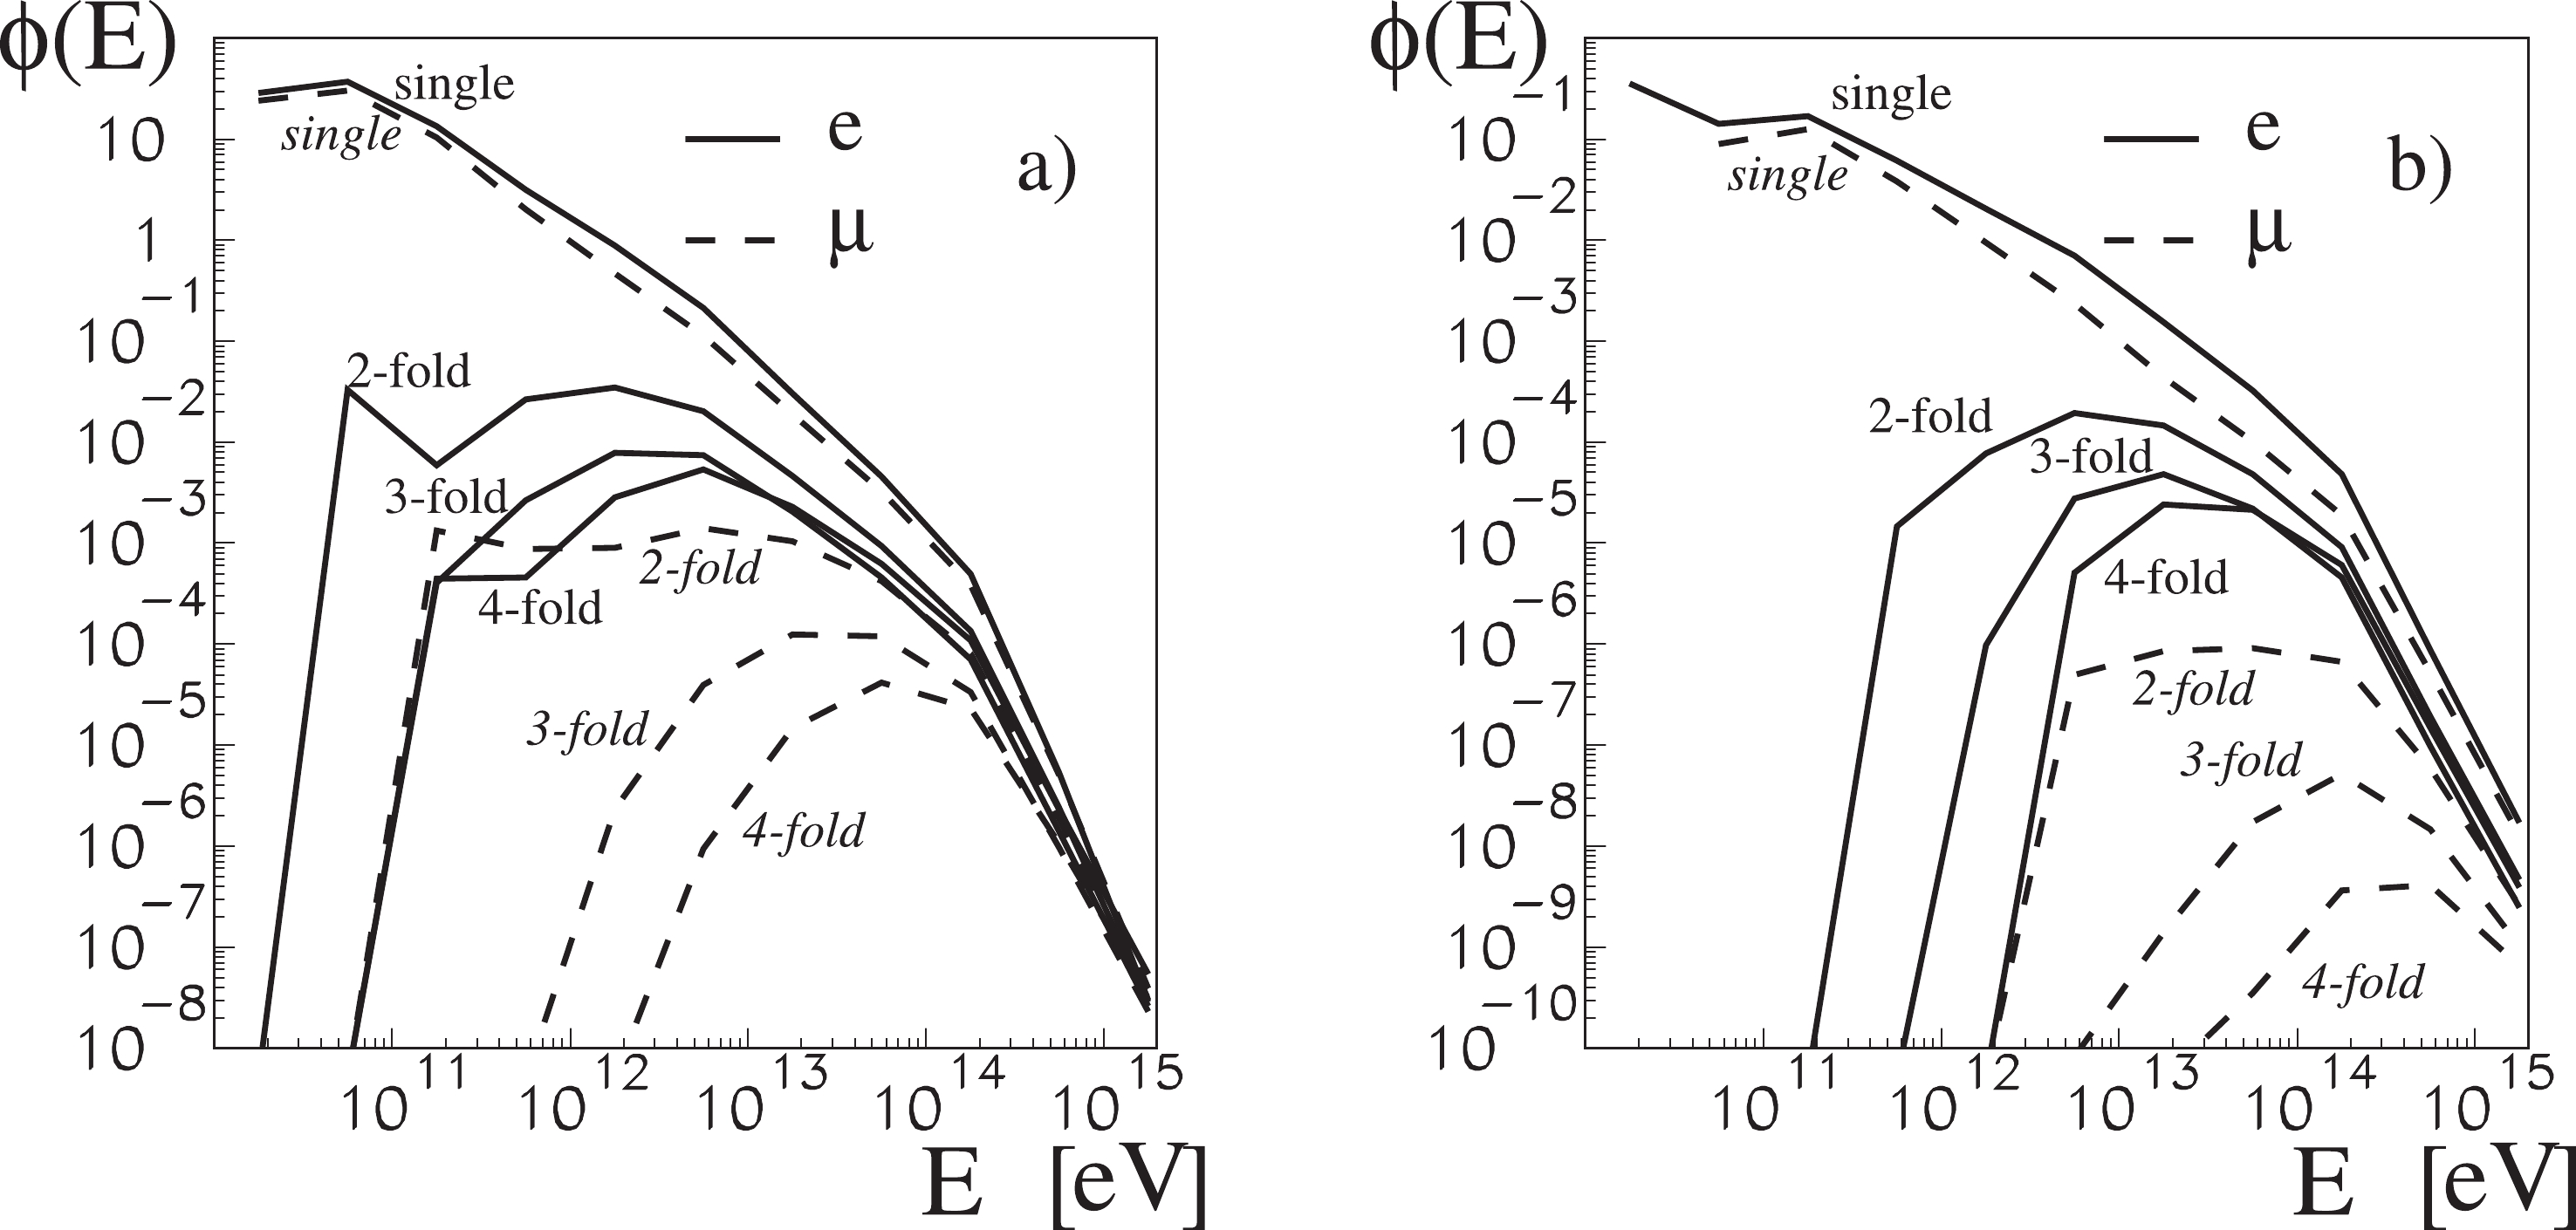
Figure 12. Distributions of primary energies responsible for events with 1, 2, 3, and 4 detectors fired with electrons (solid lines) and muons (dashed lines). The two cases of different detector sizes a) for 1 m
$ \times $ 1 m and b) for 10 cm$ \times $ 20 cm are presented.With the spectra illustrated in Fig. 12 , we can determine the rate of particular coincidence. The obtained results are presented in Table 1.
coincidence charged muons only 1 m2 0.02 m2 1 m2 0.02 m2 single 433 2.0 331 1.3 2-fold 5.6×10⁻¹ 2.5×10⁻³ 2.7×10⁻² 1.5×10⁻⁵ 3-fold 1.1×10⁻¹ 5.2×10⁻⁴ 1.6×10⁻³ 4.3×10⁻⁷ 4-fold 6.0×10⁻² 2.9×10⁻⁴ 4.1×10⁻⁴ 4.4×10⁻⁸ Table 1. Rates (s−1) of single detector registration as well as 2-fold, 3-fold, and 4-fold coincidences for stations of four detectors of 1 m2 and 0.02 m2 each. Results for muons alone are presented in the last two columns.
-
As mentioned in Sec. I, the size of detectors in local, school arrays is a very important parameter in their design. It seems that the 1 m
$ \times $ 1 m size is impractical (and too expensive). Among the planned school experiments, detector layouts of 0.5 m2 are being investigated; however, they are not significantly smaller than those of 1 m$ \times $ 1 m. Another approach is to adopt smaller detector sizes of 10 cm$ \times $ 20 cm that can also be used for other measurements/experiments [10].The effect of the dominance of the electron component for higher rank coincidences, which we have shown in Fig. 12b), is substantially important for the planning of small, school shower arrays and their detailed location. Detectors placed under concrete roofs in physics labs will record shower events significantly less frequently. To obtain a four-fold coincidence once an hour, detectors with a size of 10 cm
$ \times $ 20 cm should be positioned, such that they are not shielded by anything from the soft, electron component of the showers. The same detectors shielded and only exposed to the muon, the hard component, will give one quadruple coincidence per year. -
We developed a "small shower generator," which can be adopted in the semi-analytical method to calculate secondary particle flux at the sea level, and to mimic the exact shower generation provided by CORSIKA and other Monte-Carlo programs that completely simulate showers passing through the Earth's atmosphere.
We used CORSIKA to obtain the characteristics of the shower from the lowest primary energies allowed by this program. The average values of the quantities of interest were determined, as well as the shapes of their distributions, their second moments, and small prevalent correlations. The adjustments were done separately for the soft (electrons) and hard (muons) components. Accordingly, the transverse distributions of these particles, as a function of the primary energy of cosmic ray particle, its mass, and the zenith angle of its arrival, have been parameterized to build our small shower generator.
By analyzing electron and muon shower sizes for different atomic masses of the primary nuclei, we have examined the simple superposition hypothesis, and we infer that the extensive air shower produced in the interaction of a nucleus of mass A is a simple compound of A showers initiated by the nucleons (protons) of appropriately lower energy. The behavior of the average size values agrees with this assumption. In addition, we have also determined the consistency with the superposition rule in the range of the smallest showers that do not contain any particle (electrons nor muons).
However, by investigating dispersions of the shower size (electrons and muons), we observed that the assumption that the shower from nucleons, folding according to the superposition principle, fold independently of each other, does not correspond to reality, or at least, does not correspond to the reality of the CORSIKA program. In our shower generator, we introduced a correction to address the inconsistency of the simple superposition model by including a correlation between some of the constituent subshowers, the magnitude of which is proportional to the number of wounded nucleons in the interacting nucleus of the primary cosmic ray.
Using our small shower generator, it is possible to perform fast integrations of secondary particle fluxes at sea level and predict the registrations made by small school, local EAS arrays, as well as single detectors. These predictions, when confronted with the measured values, allow a deeper analysis of the local measurements and the properties of the detectors themselves.
Examples of the results presented in this paper, such as the spectra of primary particles illustrated in Figs. 11 and 12, demonstrate that signals from single detectors with low triggering thresholds primarily originate from single muons produced by primary particles of very low energies reaching tens or several tens of GeV. In contrast, the electron component of showers with energies of approximately 10
$ ^{13} $ eV and higher is predominantly responsible for cases with local densities of charged particles larger than a few and capable of triggering coincidences of some detectors in a local shower array. It is crucial to consider this result when planning small, local shower arrays.The small shower generator also allows the count rate in small EAS arrays to be estimated and the detector size and number of detectors to be optimized accordingly.
A small shower generator, packaged in a user-friendly manner and supplemented with appropriate documentation and instructions for use, can be an excellent research tool for allowing young people engaged in the study of modern physics during planned educational projects.
Small shower CORSIKA simulations
- Received Date: 2021-03-10
- Available Online: 2021-08-15
Abstract: Extensive Air Showers (EAS) induced by cosmic ray particles of very low energies, owing to the significantly steep cosmic ray energy spectrum, dominate the secondary particle flux measured by single detectors and small shower arrays. Such arrays connected in extended networks can be used to determine potentially interesting spatial correlations between showers, which may shed new light on the nature of ultra high-energy cosmic rays. The quantitative interpretation of showers recorded by small local arrays requires a methodology that differs from that used by ordinary large EAS arrays operating in the "knee" region and above. We present "small EAS generator," a semi-analytical method for integrating cosmic ray spectra over energies of interest and summing over the mass spectra of primary nuclei in arbitrary detector configurations. Furthermore, we provide results on the EAS electron and muon fluxes and particle density spectra.


 Abstract
 HTML
HTML Reference
 Related
 PDF
PDF




 DownLoad: