


 Abstract
 HTML
HTML Reference
 Related
 PDF
PDF


-
Good reproduction of fission barrier heights and fission fragments mass yields is a test of the theoretical models describing the nuclear fission process. An interesting review of the existing fission models can be found in Refs. [1-3]. Apart from these theories, which are based mostly on the macroscopic-microscopic approximation of potential energy surfaces of fissioning nuclei, there has been considerable progress in fully microscopic studies on nuclear fission, like the HFB+PNP [4], HFB+TDGCM [5] or TDHF [6]. More information about the future and present status of nuclear fission theories can be found in Ref. [7]. Extended calculations of the fission barrier heights can be found in Refs. [8, 9]. Readers who are interested in the theory of nuclear fission can find more details in Ref. [10].
In the present paper, the fission fragment mass yields (FMY) are obtained by an approximate solution of the eigenproblem of a three-dimensional collective Hamiltonian, of which the coordinates correspond to the fission, neck, and mass-asymmetry modes. The model presented here is described in detail in Refs. [11-13]. The potential energy surfaces (PES) of fissioning nuclei are obtained by the macroscopic-microscopic (mac-mic) method, in which the Lublin-Strasbourg Drop (LSD) model [14] has been used for the macroscopic part of the energy (
$ V_{\rm mac} $ ), while the microscopic shell and pairing corrections ($ V_{\rm mic} $ ) are evaluated using single-particle levels of the Yukawa-folded (YF) mean-field potential [15, 16]. The Fourier parametrization is used to describe the shapes of fissioning nuclei [17, 18]. It is shown in Ref. [19] that this parametrization describes the shapes of the nuclei very well, even close to the scission configuration.The paper is organized in the following way. In Sect. II, we first present the details of the shape parametrization and the theoretical model. Then we show the collective potential energy surface evaluated within the mac-mic model for the selected isotopes, and our estimates of the fission barrier heights. The calculated FMYs are compared with the existing experimental data in Sect. III. The estimates of FMYs for Th isotopes and their dependence on two adjustable parameters are further discussed in detail in Sect. IV. Conclusions and perspectives of further investigations are presented in Sect. V.
-
The evolution of a nucleus from the equilibrium state towards fission is described here by a simple dynamical approach based on the PES. We assume that at large deformations, the shape of the nucleus should depend on three collective degrees of freedom describing its elongation, left-right asymmetry, and neck-size. At smaller deformations, up to the second saddle, non-axial shapes are also considered. In the following subsection, we briefly present a Fourier-type parametrization of the nuclear shape which is used in the paper.
-
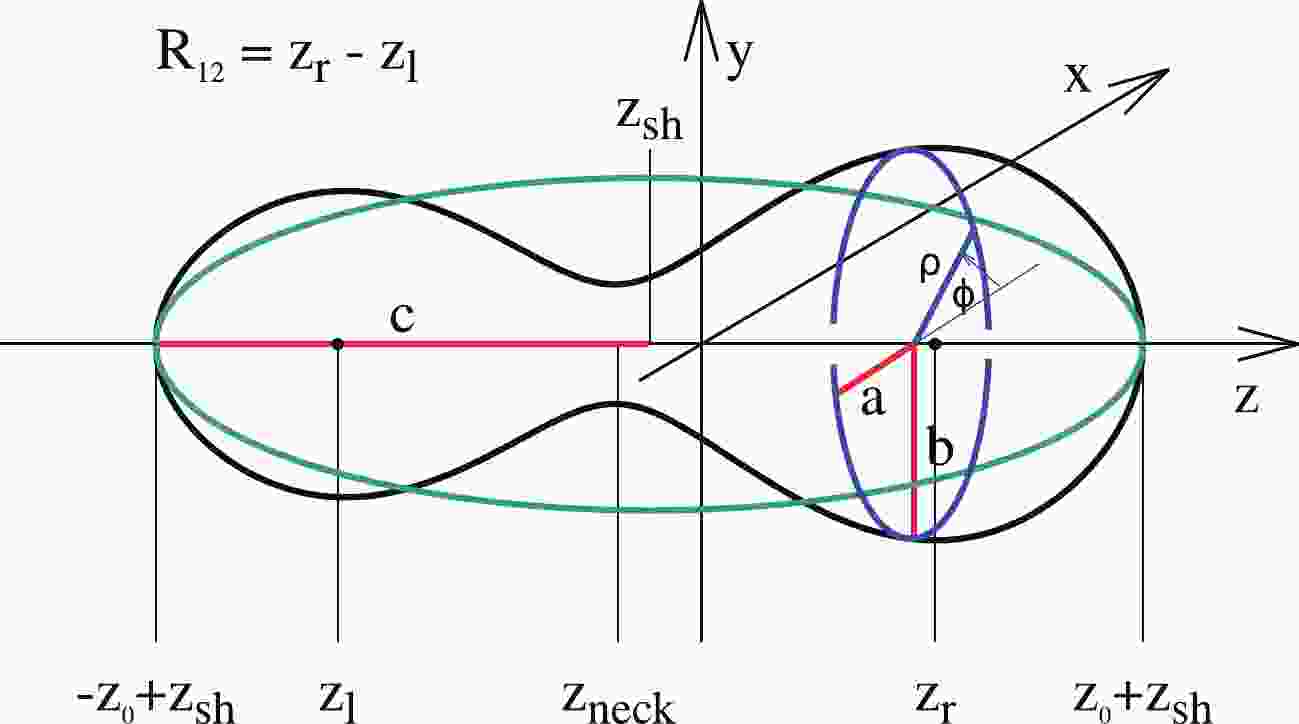
A typical shape for a nucleus on its way from saddle to scission configuration is shown in Fig. 1, where
$ \rho(z) $ , the distance from the z-axis to the surface of the nucleus as a function of z, is plotted. Here, the nuclear surface is treated as the surface of the nuclear liquid drop, or the half-density surface when the microscopic density distribution is considered.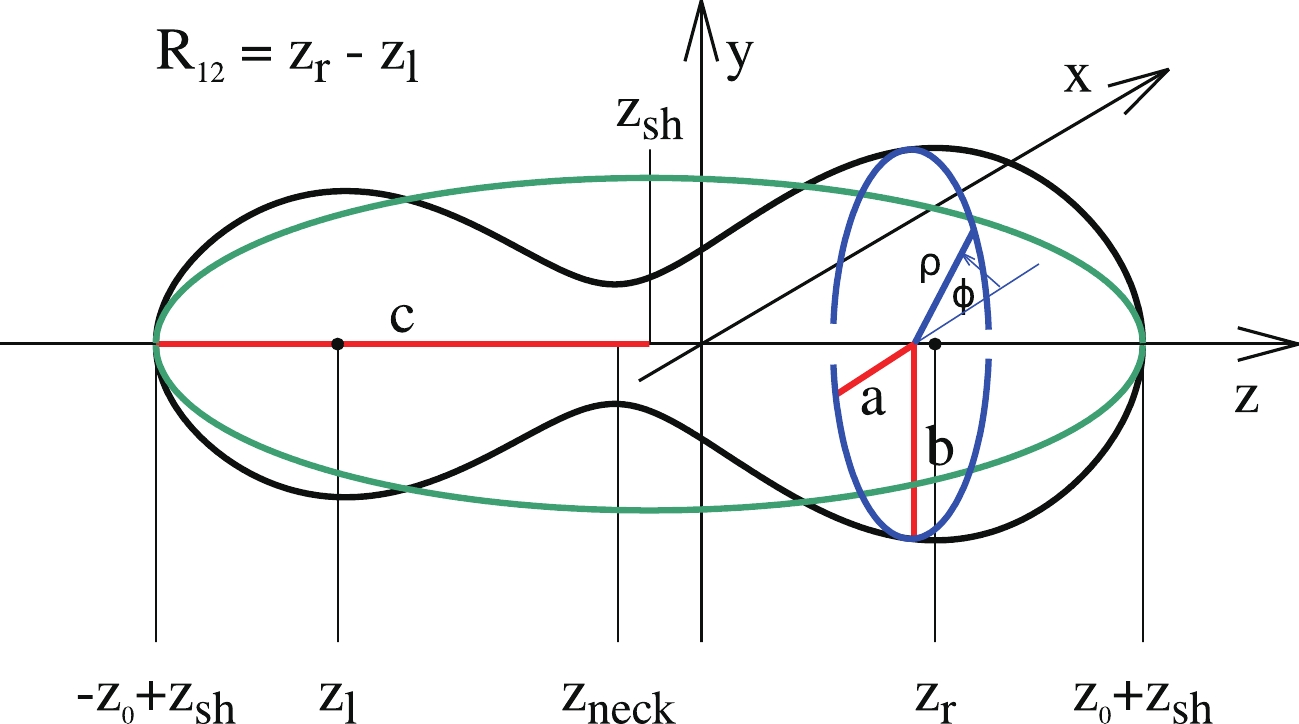
Figure 1. (color online) Shape of a very elongated fissioning nucleus.
The function
$ \rho (z) $ corresponding to the nuclear surface can be expanded in the Fourier series in the following way [17]:$ \begin{aligned}[b] \rho_s^2(z) =\;& R_0^2\sum\limits_{n = 1}^\infty \left[ a_{2n} \cos\left(\frac{(2n-1) \pi}{2} \, \frac{z-z_{sh}}{z_0}\right)\right.\\& +\left. a_{2n+1} \sin\left(\frac{2 n \pi}{2} \, \frac{z-z_{sh}}{z_0}\right) \right]\, . \end{aligned} $

(1) Here,
$ z_0 $ is the half-length of the total elongation of the nucleus and$ z_{\rm sh} $ locates the center of mass of the nucleus at the origin of the coordinate system. The expansion parameters$ a_i $ can serve as parameters describing the shape of the nucleus. The length parameter$ c = z_0/R_0 $ is fixed by the volume conservation condition, where$ R_0 $ is the radius of a spherical nucleus with the same volume as the deformed one.Contrary to the frequently used spherical harmonics expansion (cf. e.g., Refs. [8, 9]), the Fourier series converges on a realistic shape for the nuclei much earlier [17, 18] and only the few first terms are needed in practical use. Although one can work directly with these Fourier expansion coefficients, treating them as free deformation parameters, it is more suitable to use their combinations
$ \{q_n\} $ , called optimal coordinates [18], as follows:$ \left\{ \begin{array}{l} q_2 = a_2^{(0)}/a_2 - a_2/a_2^{(0)}, \\[1ex] q_3 = a_3, \\[1ex] q_4 = a_4+\sqrt{(q_2/9)^2+(a_4^{(0)})^2}, \\[1ex] q_5 = a_5-(q_2-2)a_3/10, \\[1ex] q_6 = a_6-\sqrt{(q_2/100)^2+(a_6^{(0)})^2} \;\;. \end{array} \right. $

(2) The functions
$ q_n(\{a_i\}) $ were chosen in such a way that the liquid-drop energy as a function of the elongation$ q_2 $ becomes minimal along a trajectory that defines the liquid-drop path to fission. The$ a^{(0)}_{2n} $ in Eq. (2) are the expansion coefficients of a spherical shape given by$ a^{(0)}_{2n} = (-1)^{n-1}\dfrac{32}{\pi^3\,(2n-1)^3} $ . The above relations proposed in Ref. [18] transform the original deformation parameters$ a_i $ to the more natural parameters$ q_i $ , which ensure that only minor variations of the liquid-drop fission paths occur around$ q_4 = 0 $ . Also, more and more elongated prolate shapes correspond to decreasing values of$ a_2 $ , while oblate ones are described by$ a_2>1 $ , which contradicts the traditional definition of the elongation parameter. The parametrization (2) is rapidly convergent. It was shown in Ref. [19] that the effect of$ q_5 $ and$ q_6 $ on the macroscopic potential energy of nuclei is negligible for small elongations of nuclei up to the saddle points, and contributes within 0.5 MeV around the scission configurations.Non-axial shapes can easily be obtained assuming that, for a given value of the z-coordinate, the surface cross-section (the blue dashed oval in Fig. 1) has the form of an ellipse with half-axes
$ a(z) $ and$ b(z) $ [18]:$ \varrho_s^2(z,\varphi) = \rho^2_s(z) \frac{1-\eta^2}{1+\eta^2+2\eta\cos(2\varphi)} \quad \rm{with} \quad \eta = \frac{b-a}{a+b}\; , $

(3) where the parameter
$ \eta $ describes the non-axial deformation of the nuclear shapes. The volume conservation condition requires that$ \rho_s^2(z) = a(z)b(z) $ . -
The nuclear potential energies of actinide nuclei are evaluated in the following equidistant grid-points in the 4D collective space built on the
$ q_2,\; q_3,\; q_4 $ , and$ \eta $ deformation parameters:$ \begin{aligned}[b] q_2 &= -0.60\; (0.05)\; 2.35 \, ,\\ q_3 &= 0.00\; (0.03)\; 0.21 \, ,\\ q_4 &= -0.21\; (0.03)\; 0.21 \, ,\\ \eta\; &= 0.00\; (0.03)\; 0.21 \, . \end{aligned} $

(4) Here, the numbers in the parentheses are the step size, while the numbers on the left (right) side are the lower (upper) boundaries of the grid, respectively. The energy of a nucleus is obtained in the mac-mic model, where the smooth energy part is given by the LSD model [14], and the microscopic effects have been evaluated using the YF single-particle potential [15, 16]. The Strutinsky shell-correction method [20-24] with a
$ 6^{\mathrm{th}} $ order correctional polynomial and a smoothing width$ \gamma_S = 1.2\hbar\omega_0 $ is used to determine the shell energy correction, where$ \hbar\omega_0 = 41/A^{1/3} $ MeV is the distance between the spherical harmonic-oscillator major shells. The BCS theory [25] with the approximate GCM+GOA particle number projection method [26] is used for the pairing correlations. A universal pairing strength is written as$ G{\mathcal N^{2/3}} = 0.28\hbar\omega_0 $ , with$ {\mathcal N} = Z, N $ for protons or neutrons, was adjusted in Ref. [27] to the experimentally measured mass differences of nuclei from different mass regions. It was assumed in Ref. [27] that the “pairing window” contains$ 2\sqrt{15{\mathcal N}} $ single-particle energy levels closest to the Fermi level. All the above parameters were fixed in the past, and none of them was specially fitted to the properties of actinide nuclei.A typical PES for actinides is shown in Fig. 2, where two cross-sections,
$ (q_2,\eta) $ and$ (q_2,q_3) $ , of the 4D potential energy surface of$ ^{240} $ Pu are shown. As one can see, the inclusion of the non-axial deformation is important up to elongations corresponding to the second saddle ($ q_2\le 1.2 $ ). Apart from some neutron-deficient actinide nuclei which have$ q_3\ne 0 $ in the ground-state, the left-right asymmetry begins to play an important role at large elongations of nuclei, from the second saddle ($ q_2\approx 1 $ ) up to the scission configuration ($ q_2 \gtrsim 2 $ ).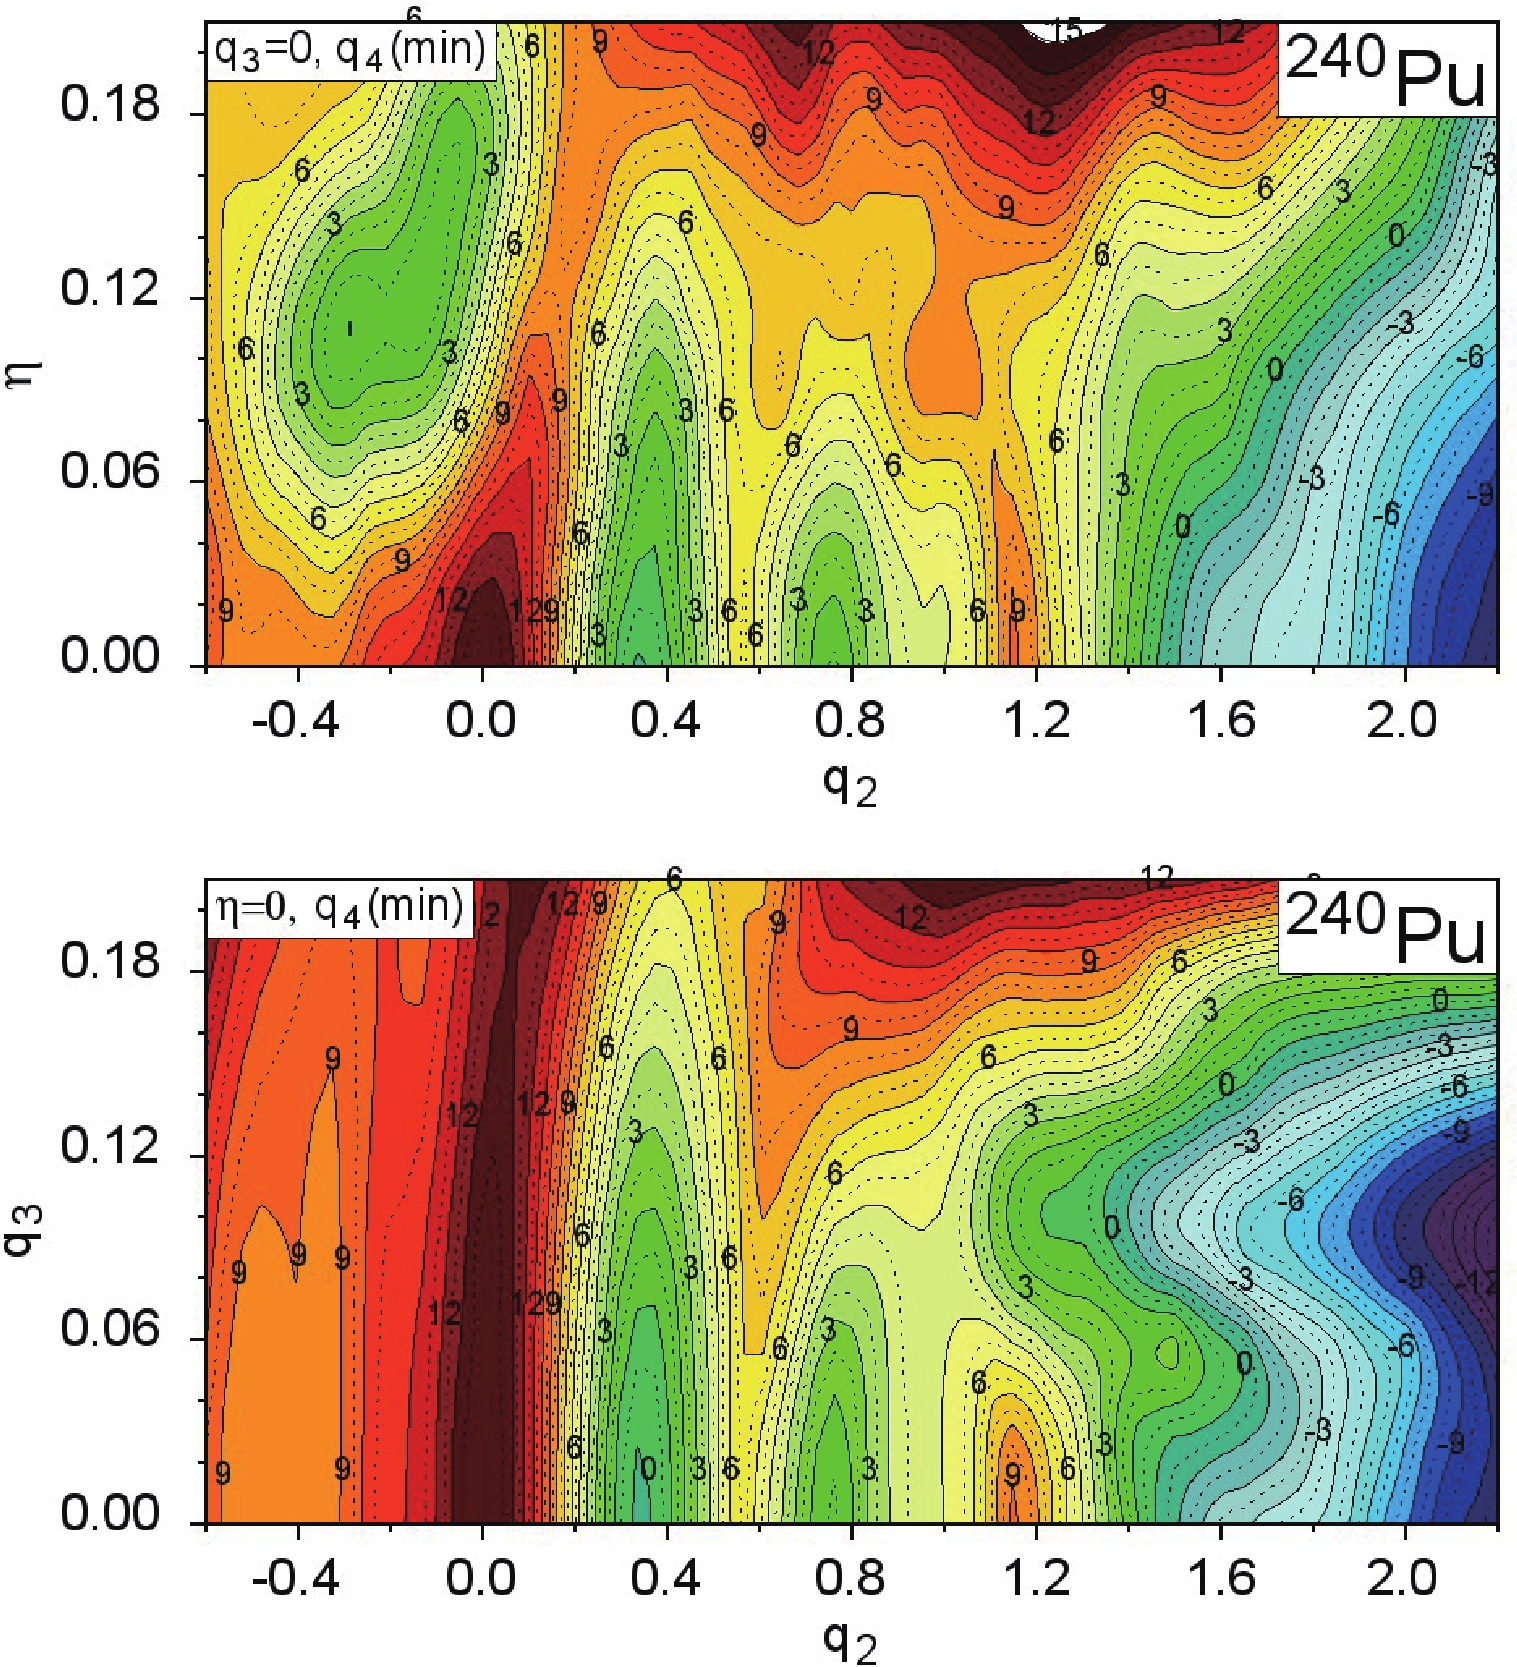
Figure 2. (color online) Potential energy surface of
$ ^{240} $ Pu minimized with respect to$ q_4 $ at the$ (q_2,\eta) $ (top map) and$ (q_2,q_3) $ (bottom map) planes.The first (
$ E_A $ ) and the second ($ E_B $ ) fission barrier heights obtained in our model for nuclei from Th to Rf are compared in Fig. 3 with the empirical data taken from Refs. [3, 28]. The agreement of our estimates with the data is rather satisfactory, and is comparable with the accuracy obtained in other theoretical models. The largest deviations between our estimates and the empirical values are observed in thorium isotopes, where they are underestimated. The main origin of these discrepancies is mostly from the inaccuracy of determining the ground-state masses in our model. To prove this, we have estimated the fission barrier heights using the so-called topographical theorem of Myers and Świątecki [29], where the barrier height (the largest one) is defined as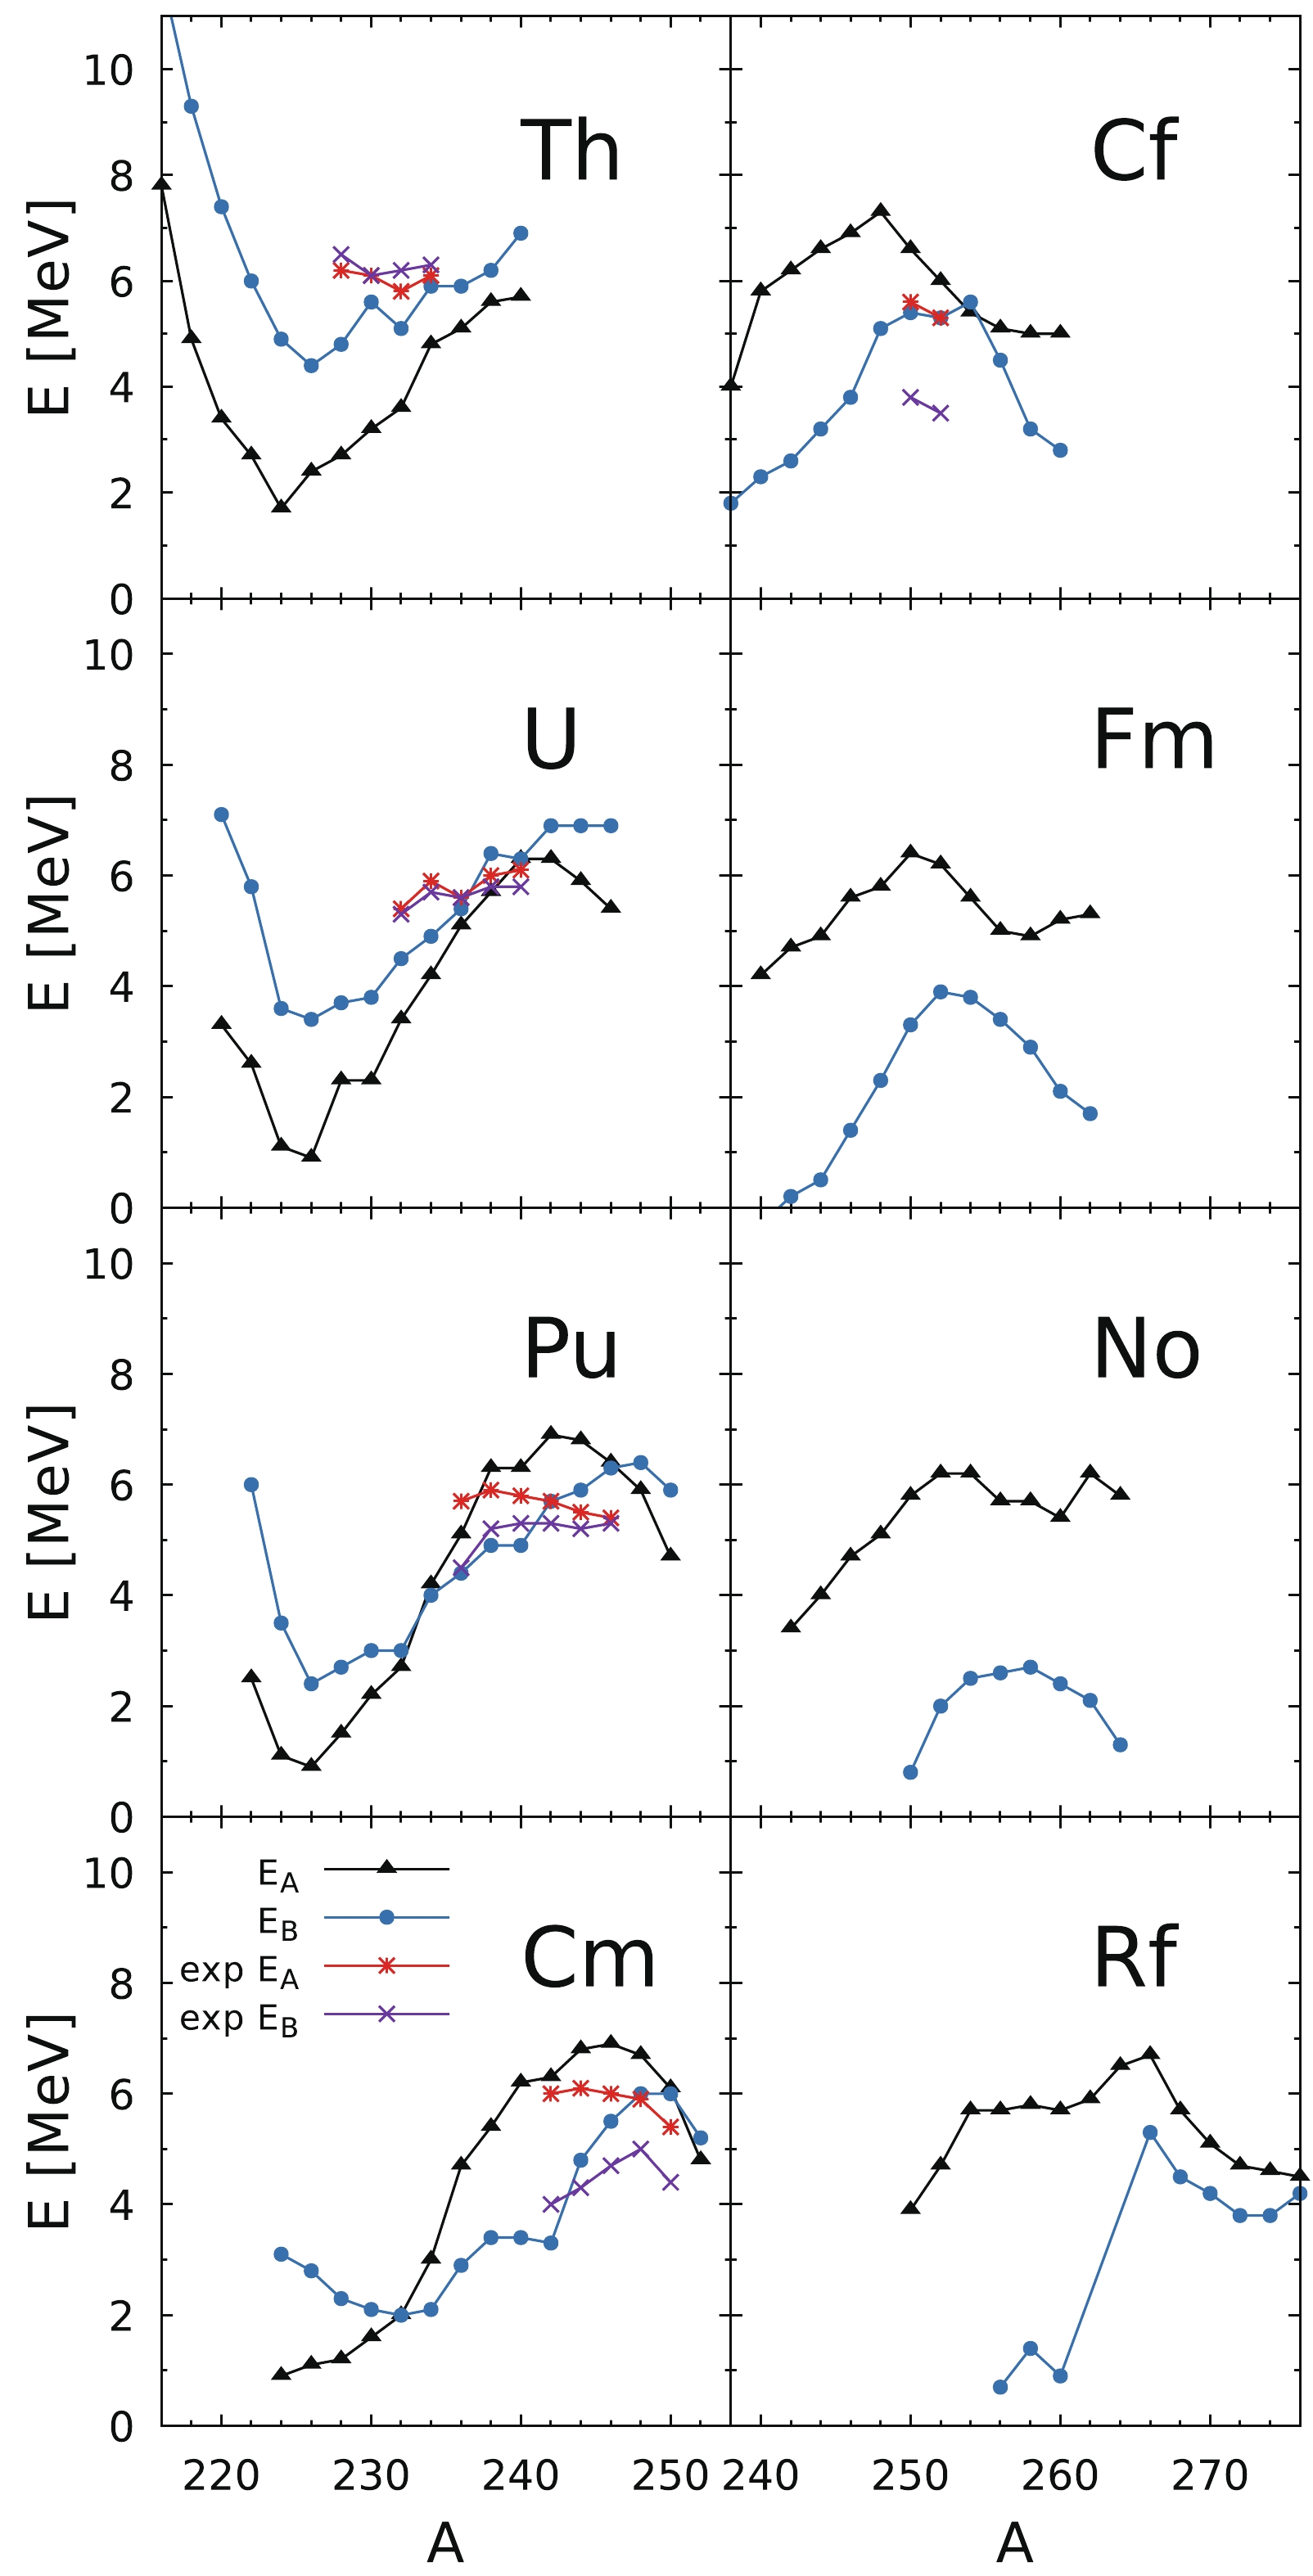
Figure 3. (color online) Fission barrier heights of even-even actinide nuclei in our 4D mac-mic model.
$ E_{\rm barr} = M_{\rm mac}^{\rm sadd}- M_{\rm g.s.}^{\rm exp}\; , $

(5) where
$ M_{\rm mac}^{\rm sadd} $ is the first barrier saddle point mass evaluated in the macroscopic model (i.e., without microscopic energy correction) and$ M_{\rm g.s.}^{\rm exp} $ is the experimental ground-state mass of the nucleus.Using the LSD model [14] to evaluate the macroscopic mass, one obtains the ‘Świątecki’ estimates of barrier heights, which deviate from the experimental data only by 310 keV on average, as shown in Fig. 4. This means that additional work has to be done to improve the estimates of the ground-state masses, to give a better fit of the pairing strength in particular. Our “universal” pairing force [27], used in the present work, reproduces on average the pairing gaps of nuclei from different mass regions, but it might be that it does not perfectly reproduce the pairing properties in actinides.

Figure 4. (color online) Fission barrier heights of even-even actinide nuclei evaluated using the topographical theorem and the LSD model, compared with the experimental barrier heights as a function of mass number A [30].
-
The present research is a continuation and extension of our previous work [11-13], where a more detailed description of the collective fission model was given. The fundamental idea of this approach is the use of the Born-Oppenheimer approximation (BOA) to separate the relatively slow motion towards fission, mainly in the
$ q_2 $ direction, from the fast vibrations in the “perpendicular”$ q_3 $ and$ q_4 $ collective coordinates. The BOA allows us to treat both these types of motion as decoupled, what leads, in consequence, to a wave function in the form of the following product:$ \Psi_{nE}(q_2,q_3,q_4) = u_{nE}(q_2)\,\phi_n(q_3,q_4;q_2)\; . $

(6) The function
$ u_{nE}(q_2) $ is the eigenfunction corresponding to the motion towards fission, while$ \phi_n(q_3,q_4;q_2) $ simulates the$ n- $ phonon “fast” collective vibrations in the plane “perpendicular” to the fission mode,$ \{q_3,q_4\} $ .To determine the
$ u_{nE}(q_2) $ function for a single$ q_2 $ mode, one can use the WKB approximation, as has been done in Ref. [11]. To obtain the function$ \phi_n(q_3,q_4;q_2) $ , one has to solve numerically for each value of$ q_2 $ the eigenproblem of the underlying Hamiltonian in the perpendicular$ \{q_3,q_4\} $ space. However, for low energy fission, it is sufficient to take only the lowest wave function in the perpendicular mode and evaluate the density of probability$ W(q_3,q_4;q_2) $ of finding the system, for a given elongation$ q_2 $ within the area of$ (q_3\pm {\rm d}q_3, q_4\pm {\rm d}q_4) $ as$ W(q_3,q_4;q_2) = |\Psi(q_2,q_3,q_4)|^2 = |\phi_0(q_3,q_4;q_2)|^2\; . $

(7) A further simplification we have made is to approximate the modulus square of the total wave function in Eq. (7) by the Wigner function in the following form
$ W(q_3,q_4;q_2)\propto \exp{\frac{V(q_3,q_4;q_2)-V_{\rm min}(q_2)}{T^*}}\; , $

(8) where
$ V_{\rm min}(q_2) $ is the minimum of the potential energy for a given elongation$ q_2 $ and$ T^* $ is a generalized temperature [31] which takes into account both the thermal excitation of the fissioning nucleus and the collective zero-point energy$ E_0 ,$ $ T^* = E_0/{\rm tanh}(E_0/T)\; . $

(9) The temperature (T) of a nucleus with mass number A is evaluated from its thermal excitation energy (
$ E^* $ ) using the phenomenological relation$ E^* = aT^2 $ , with$ a = A $ /(10 MeV). The generalized temperature$ T^* $ is approximately equal to the zero-point energy when T is small, while for sufficiently high temperatures ($ T\gg E_0 $ ) it approaches T. In the following,$ E_0 $ is treated as one of two adjustable parameters of our model. Of course, one expects$ E_0 $ of the order of 1 to 2 MeV, as implied by the energy level positions of typical collective vibrational states.To obtain the FMY for a given elongation
$ q_2 $ one has to integrate the probabilities (8) over the full range of the neck parameter$ q_4 ,$ $ w(q_3;q_2) = \int W(q_3,q_4;q_2) {\rm d}q_4\; . $

(10) It is rather obvious that the fission probability may depend strongly on the neck radius
$ R_{\rm neck} $ . Following Ref. [11], one assumes the neck rupture probability P to be equal to$ P(q_2,q_3,q_4) = \frac{k_0}{k}\,P_{\rm neck}(R_{\rm neck})\; , $

(11) where
$ P_{\rm neck} $ is a geometrical factor indicating the neck breaking probability proportional to the neck thickness, while$ k_0/k $ describes the fact that the larger collective velocity towards fission,$ v(q_2) = \dot q_2 $ , implies that the neck rupture between two neighboring$ q_2 $ configurations is getting less probable. The constant parameter$ k_0 $ plays the role of scaling parameter, which is finally eliminated in the calculation of the resulting FMY. The expression for the geometrical probability factor$ P_{\rm neck}(R_{\rm neck}) $ is chosen here in the form of a Gauss function [12]:$ P_{\rm neck}(R_{\rm neck}) = \exp{[-\log(2)(R_{\rm neck}/d)^2]}\; , $

(12) where d, our second adjustable parameter, is the “half-width” of the neck-breaking probability. The momentum k in Eq. (11) simulates the dynamics of the fission process, which, as usual, depends on both the local collective kinetic energy (
$ E_{\rm kin} $ ) and the inertia (M) towards the fission mode,$ \frac{\hbar^2 k^2}{2\bar{M}(q_2)} = E_{\rm kin} = E-E^*-V(q_2) \; , $

(13) with
$ \bar{M}(q_2) $ stands for the (averaged over$ q_3 $ and$ q_4 $ degrees of freedom) inertia parameter at a given elongation$ q_2 $ , and$ V(q_2) $ is the potential corresponding to the bottom of the fission valley. In the following calculations we assume that the part of the total energy converted into heat$ E^* $ is negligibly small due to rather small friction forces in low energy fission. A good approximation of the inertia$ \bar{M}(q_2) $ , proposed in Ref. [32], is to use the irrotational flow mass parameter$ B_{\rm irr} $ , which is derived initially as a function of the distance between fragments$ R_{12} $ and the reduced mass$ \mu $ of both fragments,$ \bar{M}(q_2) = \mu [1+11.5\,(B_{\rm irr}/\mu -1)]\left(\frac{\partial R_{12}} {\partial q_2}\right)^2 \; . $

(14) In order to make use of the neck rupture probability
$ P(q_3,q_4;q_2) $ of Eq. (11), one has to rewrite the integral over$ q_4 $ in probability distribution (10) in the following form:$ w(q_3;q_2) = \int W(q_3,q_4;q_2) P(q_2,q_3,q_4) {\rm d}q_4 \; , $

(15) in which the neck rupture probability is now taken into account. The above approximation describes the very important fact that, for a fixed
$ q_3 $ value, the fission may occur within a certain range of$ q_2 $ deformations with different probabilities. Therefore, to obtain the true fission probability distribution$ w'(q_3;q_2) $ at a strictly given$ q_2 $ , one has to exclude the fission events which have occurred in the “previous”$ q'_{2}<q_2 $ configurations, i.e.,$ w'(q_3;q_2) = w(q_3;q_2)\frac{1-\int\limits_{q'_{2}<q_2} w(q_3;q'_2) {\rm d}q'_2} {\int w(q_3;q'_2) {\rm d}q'_2}\; . $

(16) The normalized mass yield is then obtained as the integral of partial yields over
$ q_2 $ :$ Y(q_3) = \frac{\int w'(q_3;q_2) {\rm d}q_2}{\int w'(q_3;q_2) {\rm d}q_3 \, {\rm d}q_2}\; . $

(17) Since there is a one-to-one correspondence between
$ q_3 $ deformation and the masses of the left ($ A_{\rm L} $ ) and right ($ A_{\rm R} = A-A_{\rm L} $ ) fission fragments, the yield given by Eq. (17) can be directly compared with the experimental FMYs. Note that due to the normalization procedure (17), the scaling parameter$ k_0 $ introduced in Eq. (11) no longer appears in the definition of mass yield.So, there are only two free parameters in the above model, namely the zero-point energy
$ E_0 $ in Eq. (9) and the half-width parameter d which appears in the probability of neck rupture in Eq. (12).A typical dependence of the fission fragment mass yield on these two adjustable parameters is shown in Fig. 5, where the FMY of
$ ^{228}{\rm Th} $ at$ E^* $ = 11 MeV is plotted for different values of$ E_0 $ (top panel) and d (bottom panel) as a function of the fragment mass number ($ A_{\rm f} $ ). It is seen the zero-point energy, also called collective temperature in some papers, mostly influences the width of the distribution, which grows with increasing$ E_0 $ , while the neck-rupture related parameter d slightly changes the position of the maximum of the fragment distribution and the relation between the asymmetric and symmetric yields. However, it is good to mention here that the main properties of the FMY are determined by the potential energy landscape of the fissioning nucleus.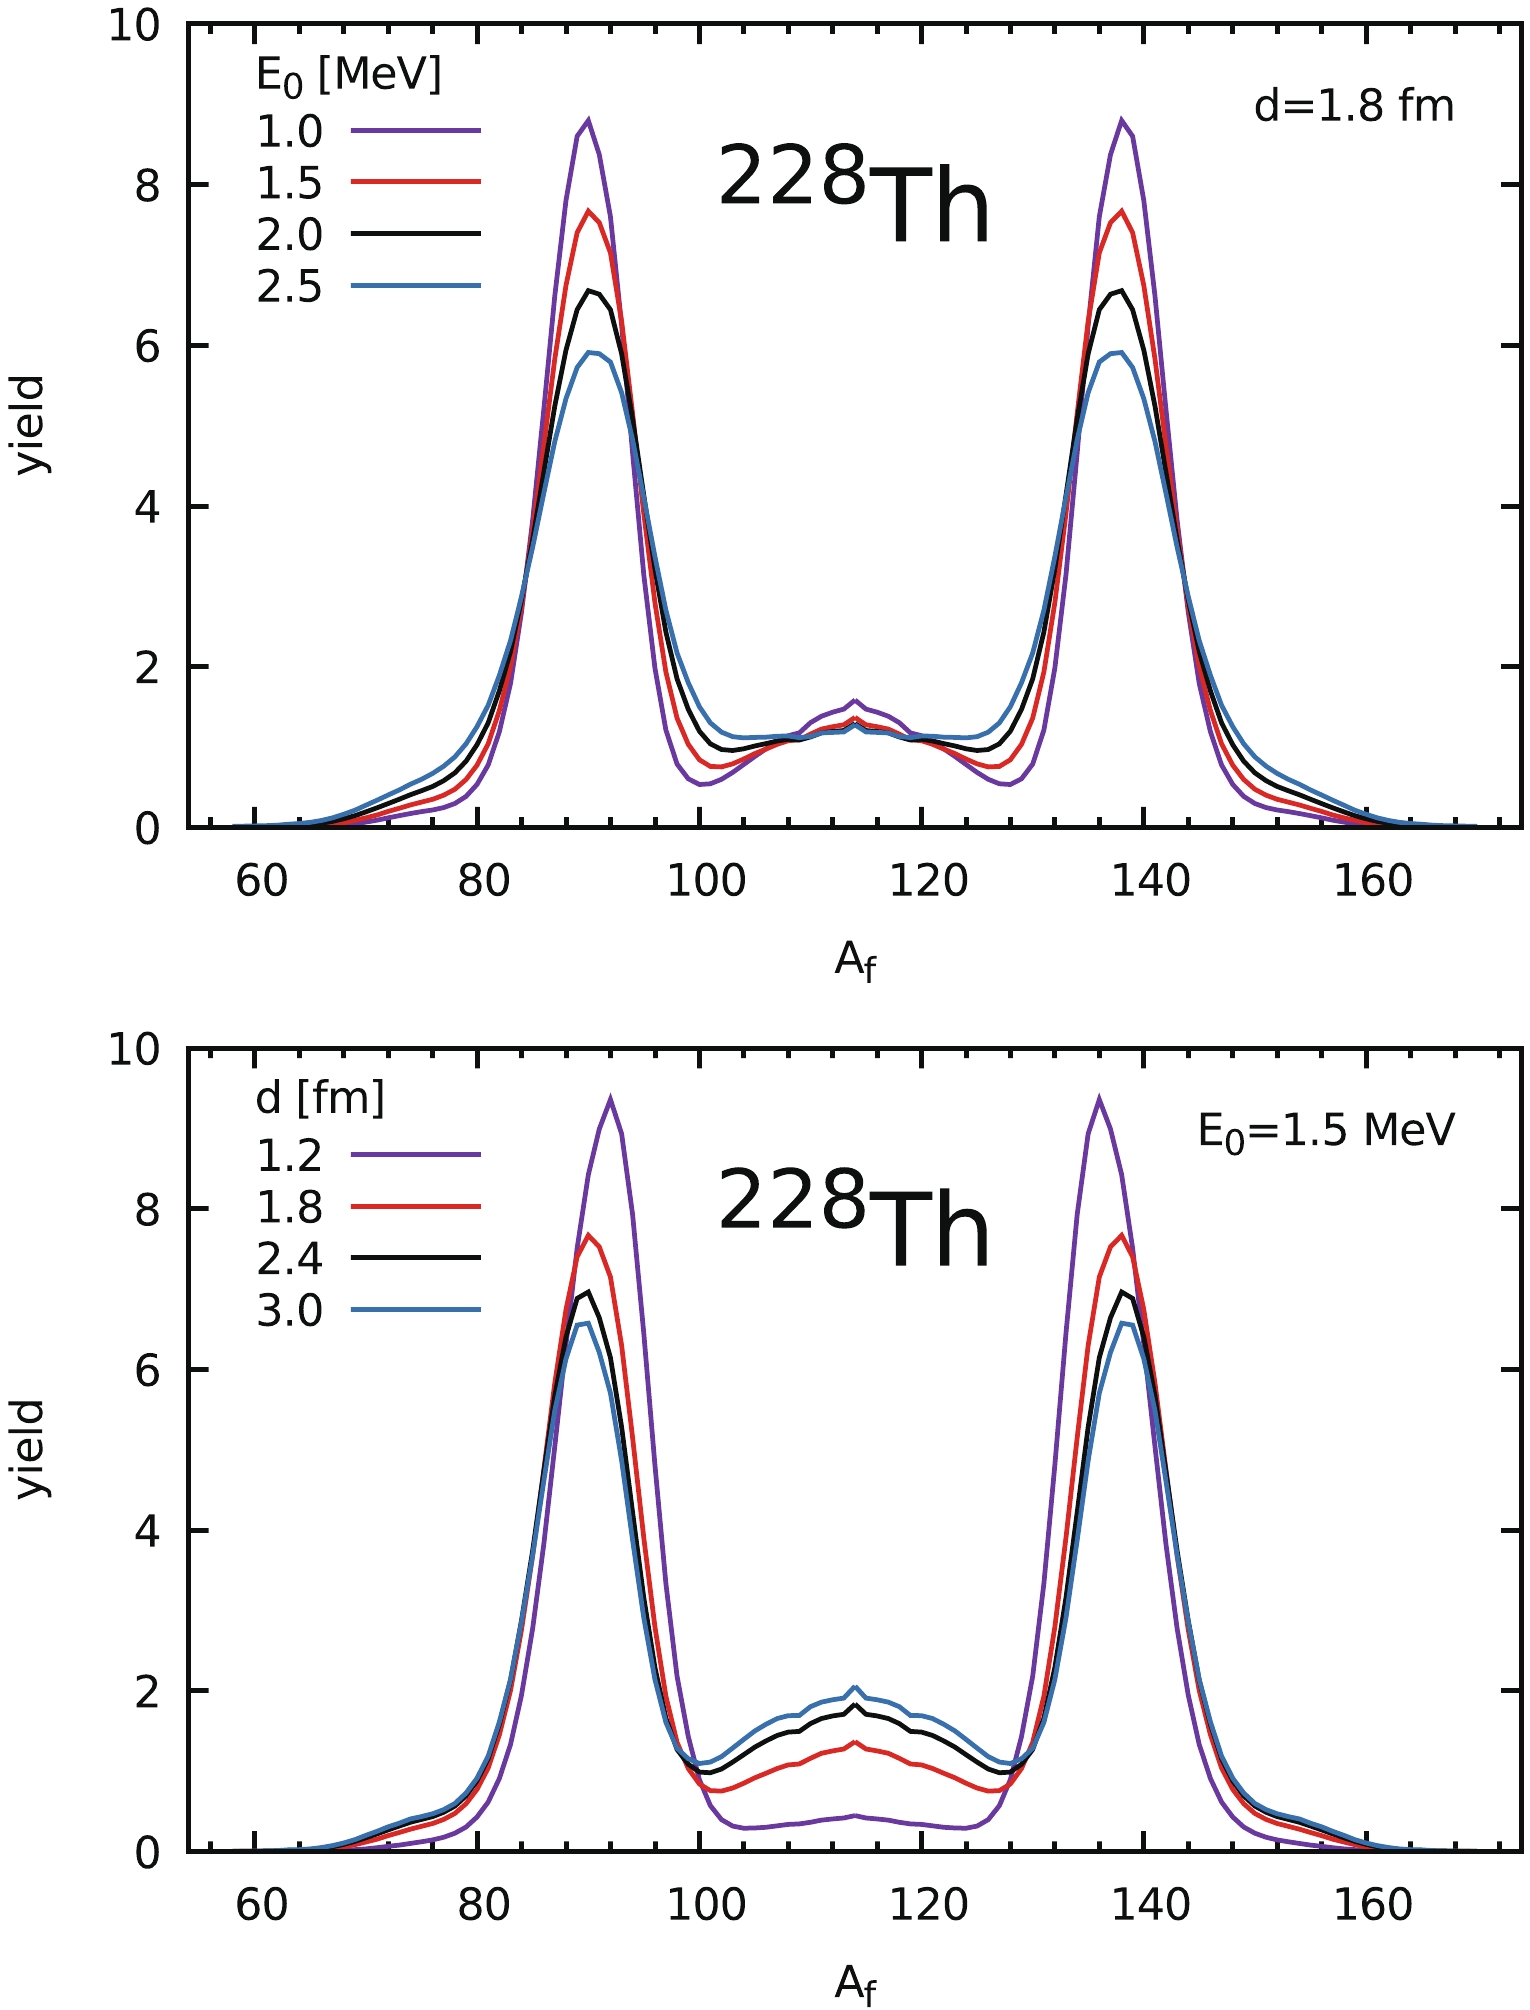
Figure 5. (color online) Fragment mass yield of
$ ^{228} $ Th at excitation energy$ E^* $ = 11 MeV for different values of zero-point energy$ E_0 $ = 1, 1.5, 2, 2.5 MeV (top) and neck-rupture half-width d = 1.2, 1.8, 2.4, 3 fm (bottom). -
Relatively good estimates of the FMYs obtained in our previous works [12, 13] for Pu and Pt to Ra isotopes encourage us to apply our model to describe and predict the mass yield for the low-energy fission of actinide nuclei from Th to Rf. Our main goal is to show that the innovative Fourier shape parametrization [17] and the mac-mic model based on the LSD macroscopic energy [14] with the microscopic energy correction evaluated using the Yukawa-folded potential [15, 16] gives a good description of the existing fission valleys in the broad region of nuclei. It is worth recalling that none of the model parameters, apart from
$ E_0 $ and d described in the previous section, were modified here to get a better description.In general, the theoretical estimates of FMY depend weakly on the choice of the free parameters
$ E_0 $ and d. To obtain the best fit to the existing experimental FMYs, the following overlap of theoretical and experimental yields:$ I(E_0,d) = \sum\int\limits_0^A |Y_{\rm exp}(A_{\rm f})-Y_{\rm th}(A_{\rm f};E_0,d)| {\rm d}A_{\rm f} \; , $

(18) is minimized with respect to
$ E_0 $ and d. The sum in Eq. (18) runs over the nuclei, where the experimental data exist. Contrary to the$ \xi^2 $ fit, this fitting procedure does not overestimate the role of large deviations. The optimised values$ E_0 = 2.2 $ MeV and$ d = $ 1.6 fm are finally used to obtain the FMY for all considered actinide nuclei.It is well known that the FMY of a given nucleus is mainly determined by its PES properties at large deformations. Typical examples of PES for
$ ^{240} $ Pu are shown in Fig. 2, where the mac-mic energy minimized with respect to$ q_4 $ is plotted on the$ (q_2,\eta) $ (top) and$ (q_2,q_3) $ (bottom) planes. The labels at the layers correspond to the energy of the deformed nucleus (in MeV) measured with respect to the LSD macroscopic energy of the spherical nucleus. The first saddle is visible around$ q_2 = 0.55 $ and$ q_3 = 0 $ , while the second is at$ q_2 = 1.10 $ and$ q_3 = 0.08 $ . As one can see in the upper panel, the non-axial deformation$ \eta $ does not influence the PES at larger$ q_2 $ deformation. So, we do not take this degree of freedom into account in our analysis of the FMYs. Each of the 2D energy maps shown in Fig. 2 is only a projection of the full 4D PES, and one has to consider other cross-sections to analyze the fission process in detail.The fission fragment mass yields obtained in our model are presented in Figs. 6 to 9. Some empirical data for the FMY have been obtained for the fission of excited nuclei. In such cases, we take the excitation energy of nucleus (
$ E^* $ ) into account when evaluating the Wigner function (8) and we reduce the microscopic energy correction according to the prescription found in Ref. [33]: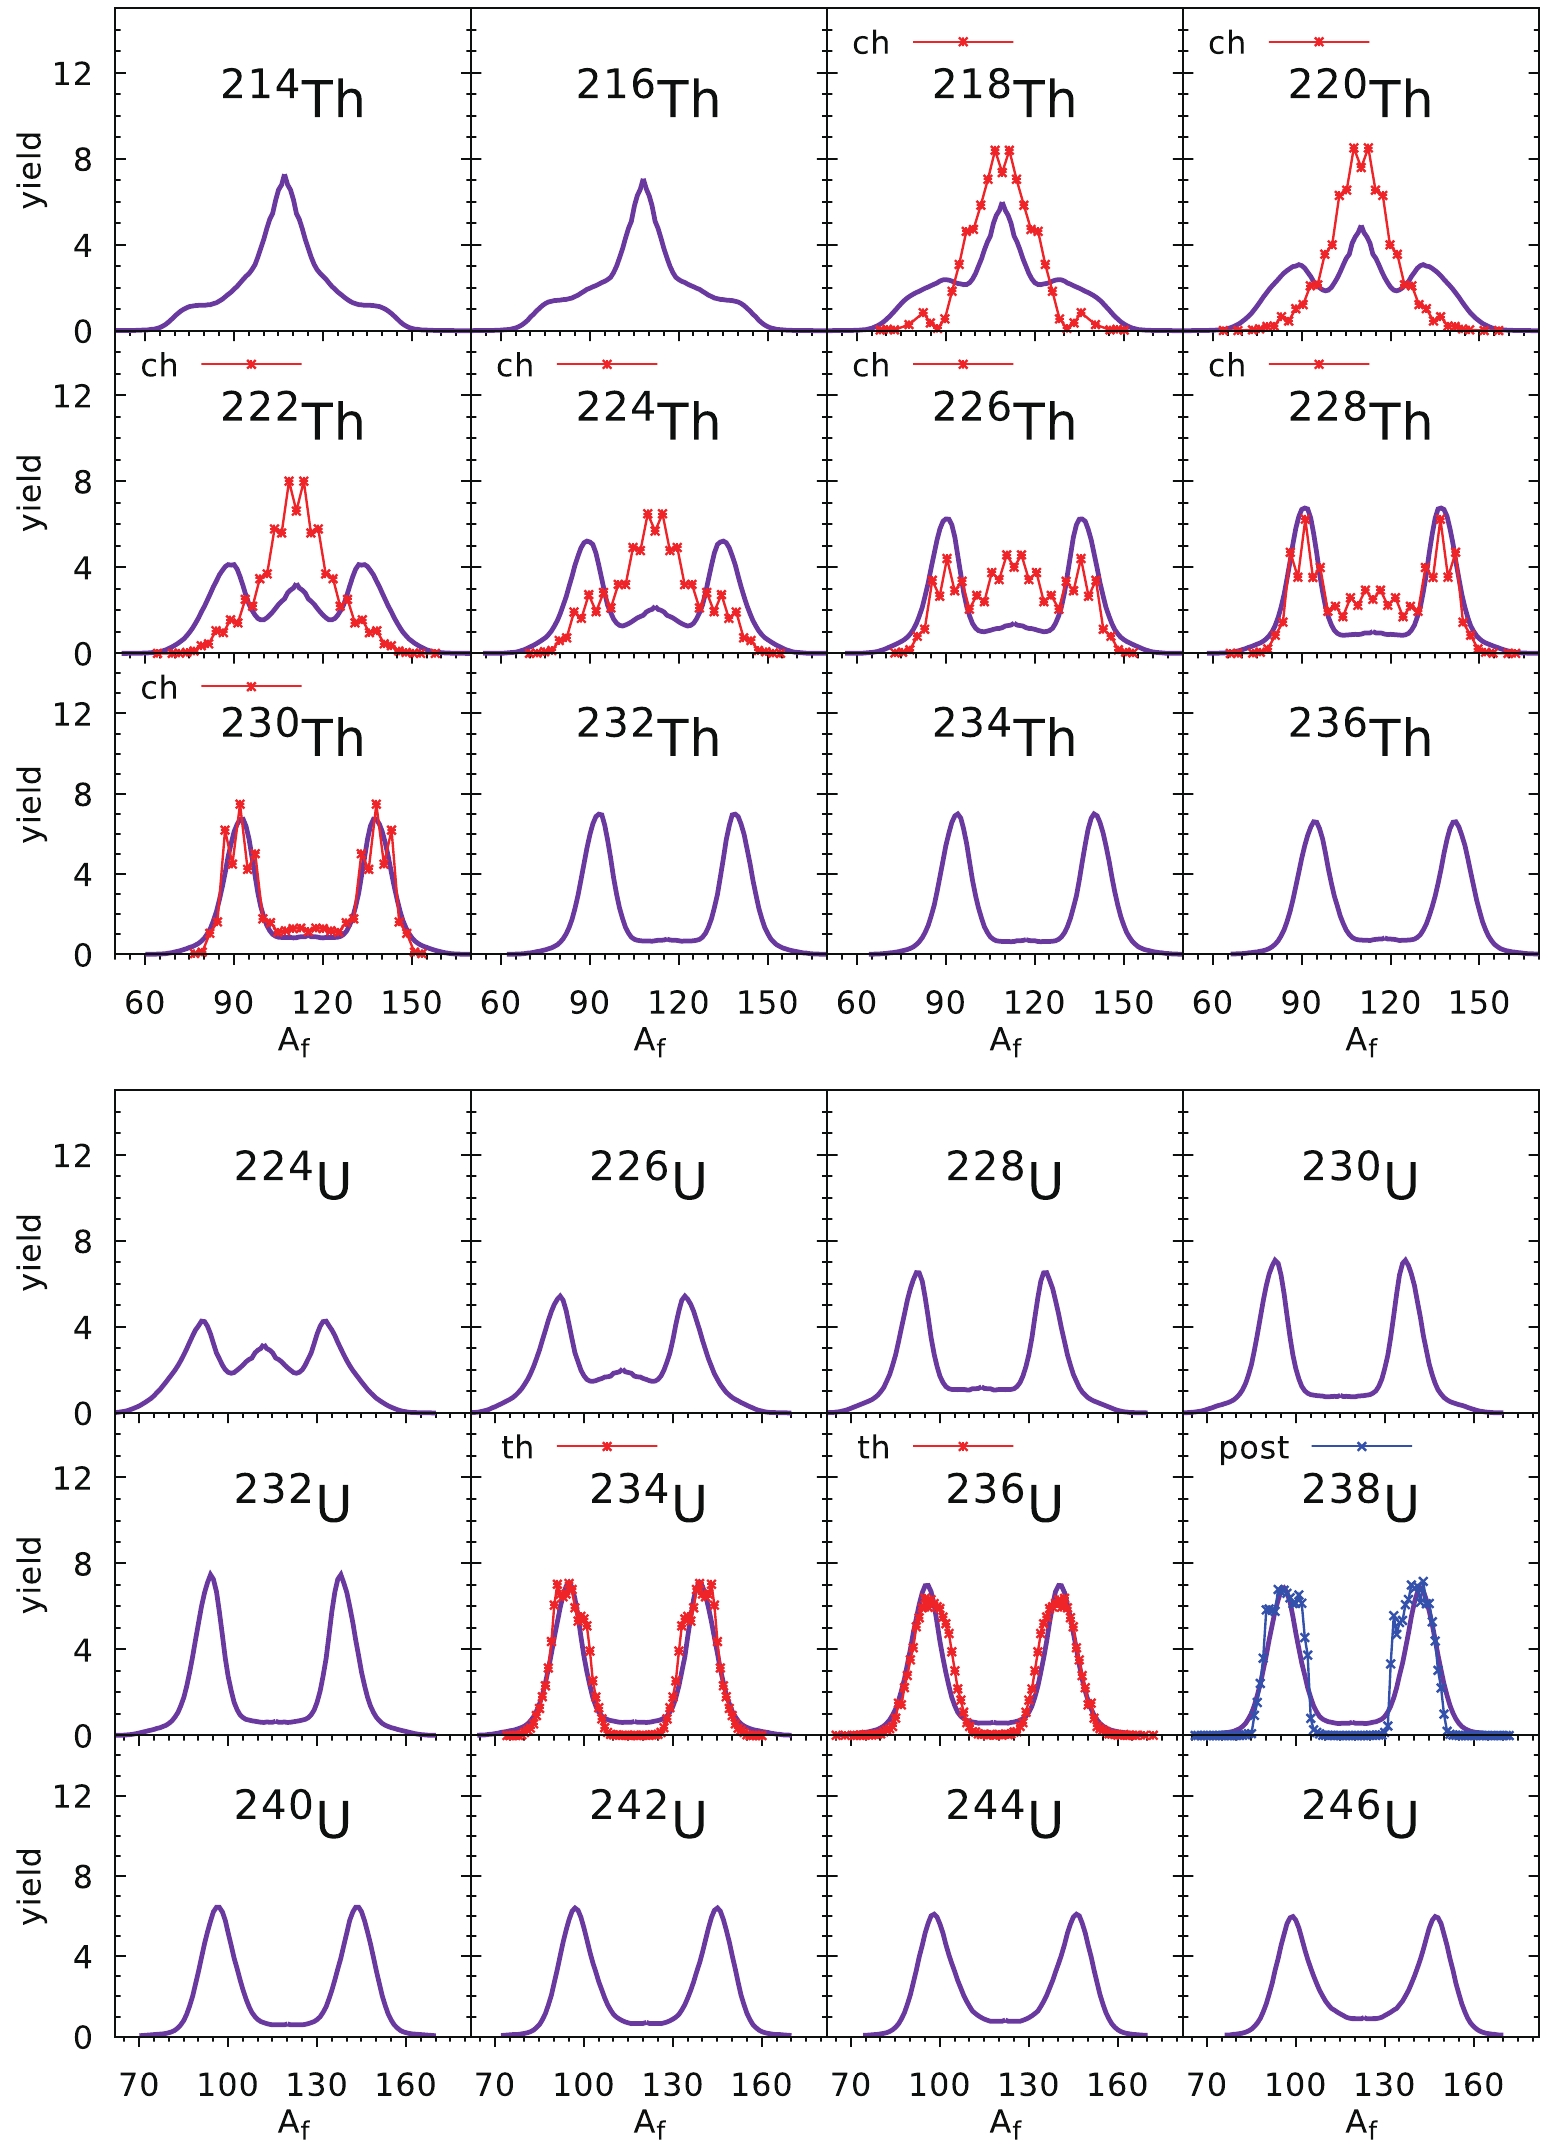
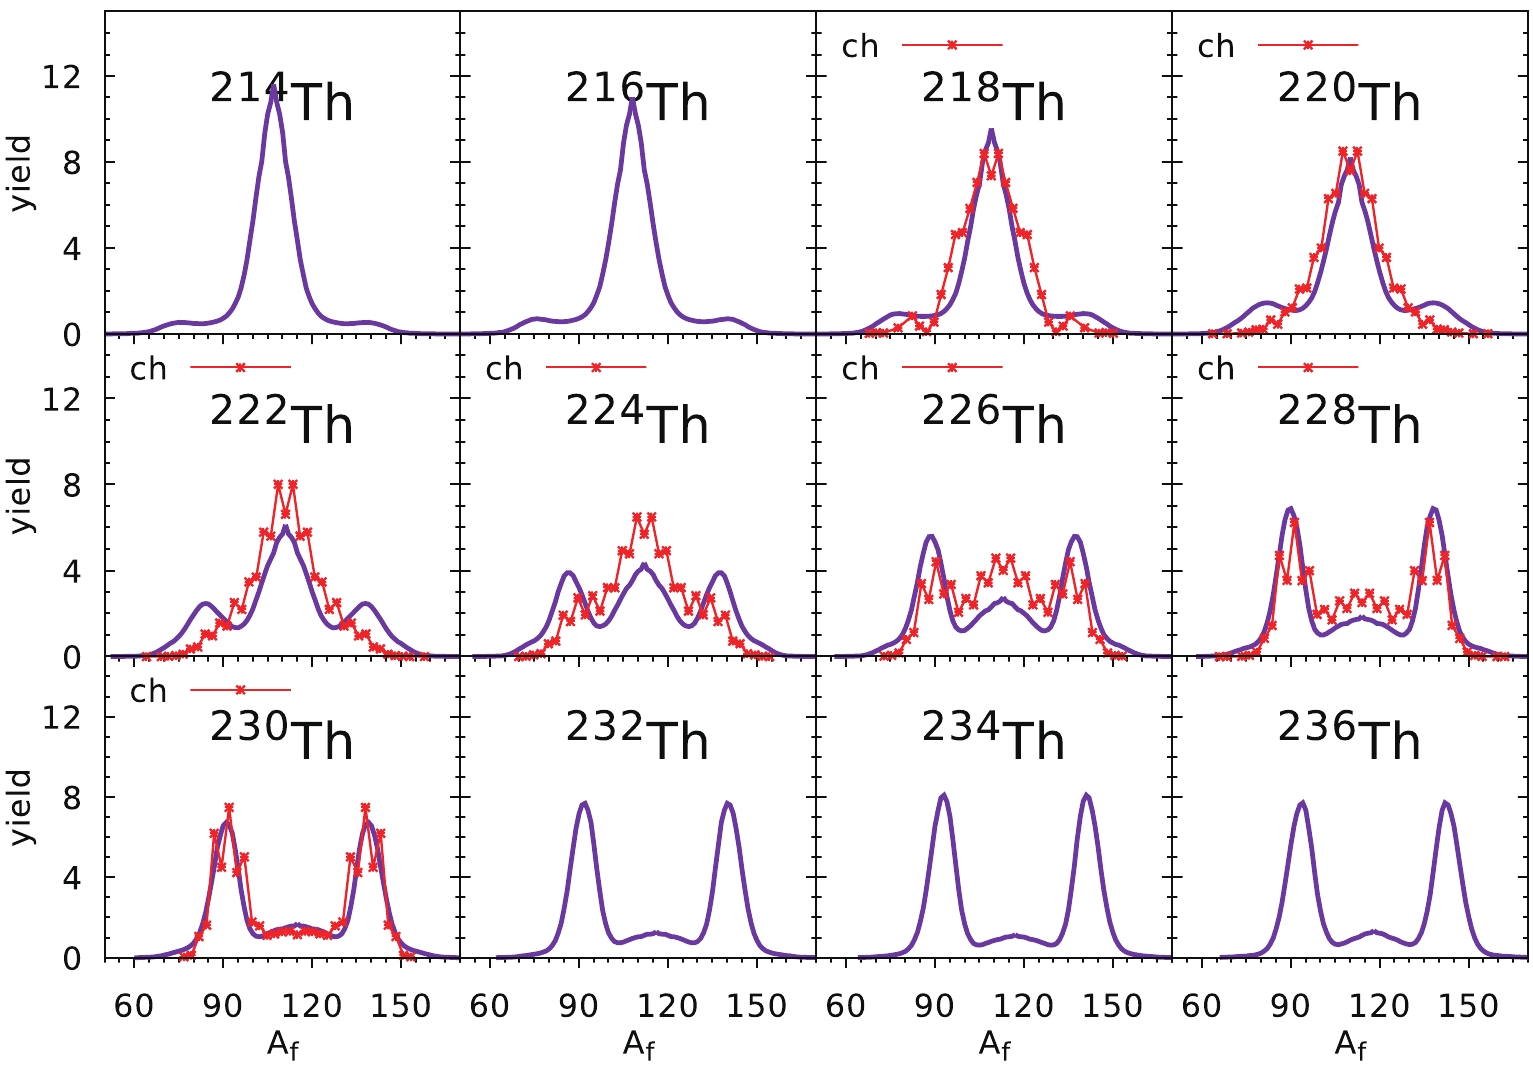
Figure 6. (color online) Fission fragment mass yields of Th (top part) and U (bottom part) isotopes. Experimental data (red stars) for Th isotopes are extracted from the charge-yields of Refs. [34, 35] while the mass yields for U isotopes (botton part) are taken from Refs. [36, 37] for the thermal neutron induced fission (th). To guide the eye, for
$ ^{238} $ U we have used the post-neutron data (blue crosses) taken from Ref. [3].$ V_{\rm mic}(T) = \frac{V_{\rm mic}(T = 0)}{1+\exp{(T-1.5)/0.3}}\; , $

(19) where the temperature
$ T = \sqrt{E^*/a} $ is expressed in MeV. Our estimates of FMY correspond to the so-called pre-neutron yields, i.e., the mass yields before neutron emission from fragments, and they have to be compared with such data (red stars in Figs. 6 to 9). In the case of Th isotopes, we have used the fragment charge yields from Refs. [34, 35], and to obtain the mass yields it is assumed that the$ Z/N $ ratio in the fragment is the same as in the mother nucleus. In cases when the pre-neutron data were not available, we have plotted the post-neutron data (blue crosses) just to get a piece of information about the experimental situation. It is shown that for the Th isotopes, although the agreement of the estimates with the experimental data is not very satisfactory, the general trend is reproduced, i.e., a transition from symmetric to asymmetric fission is reproduced with a growing mass number of isotope. The best agreement is achieved for$ ^{218} $ Th and$ ^{228-230} $ Th nuclei. The agreement with experimental data in the uranium chain, presented in the bottom part of Fig. 6, is much better. Here the maxima and the widths of the fragment mass distribution are reproduced well, and a similar transition between symmetric and asymmetric fission as in Th isotopes is evident.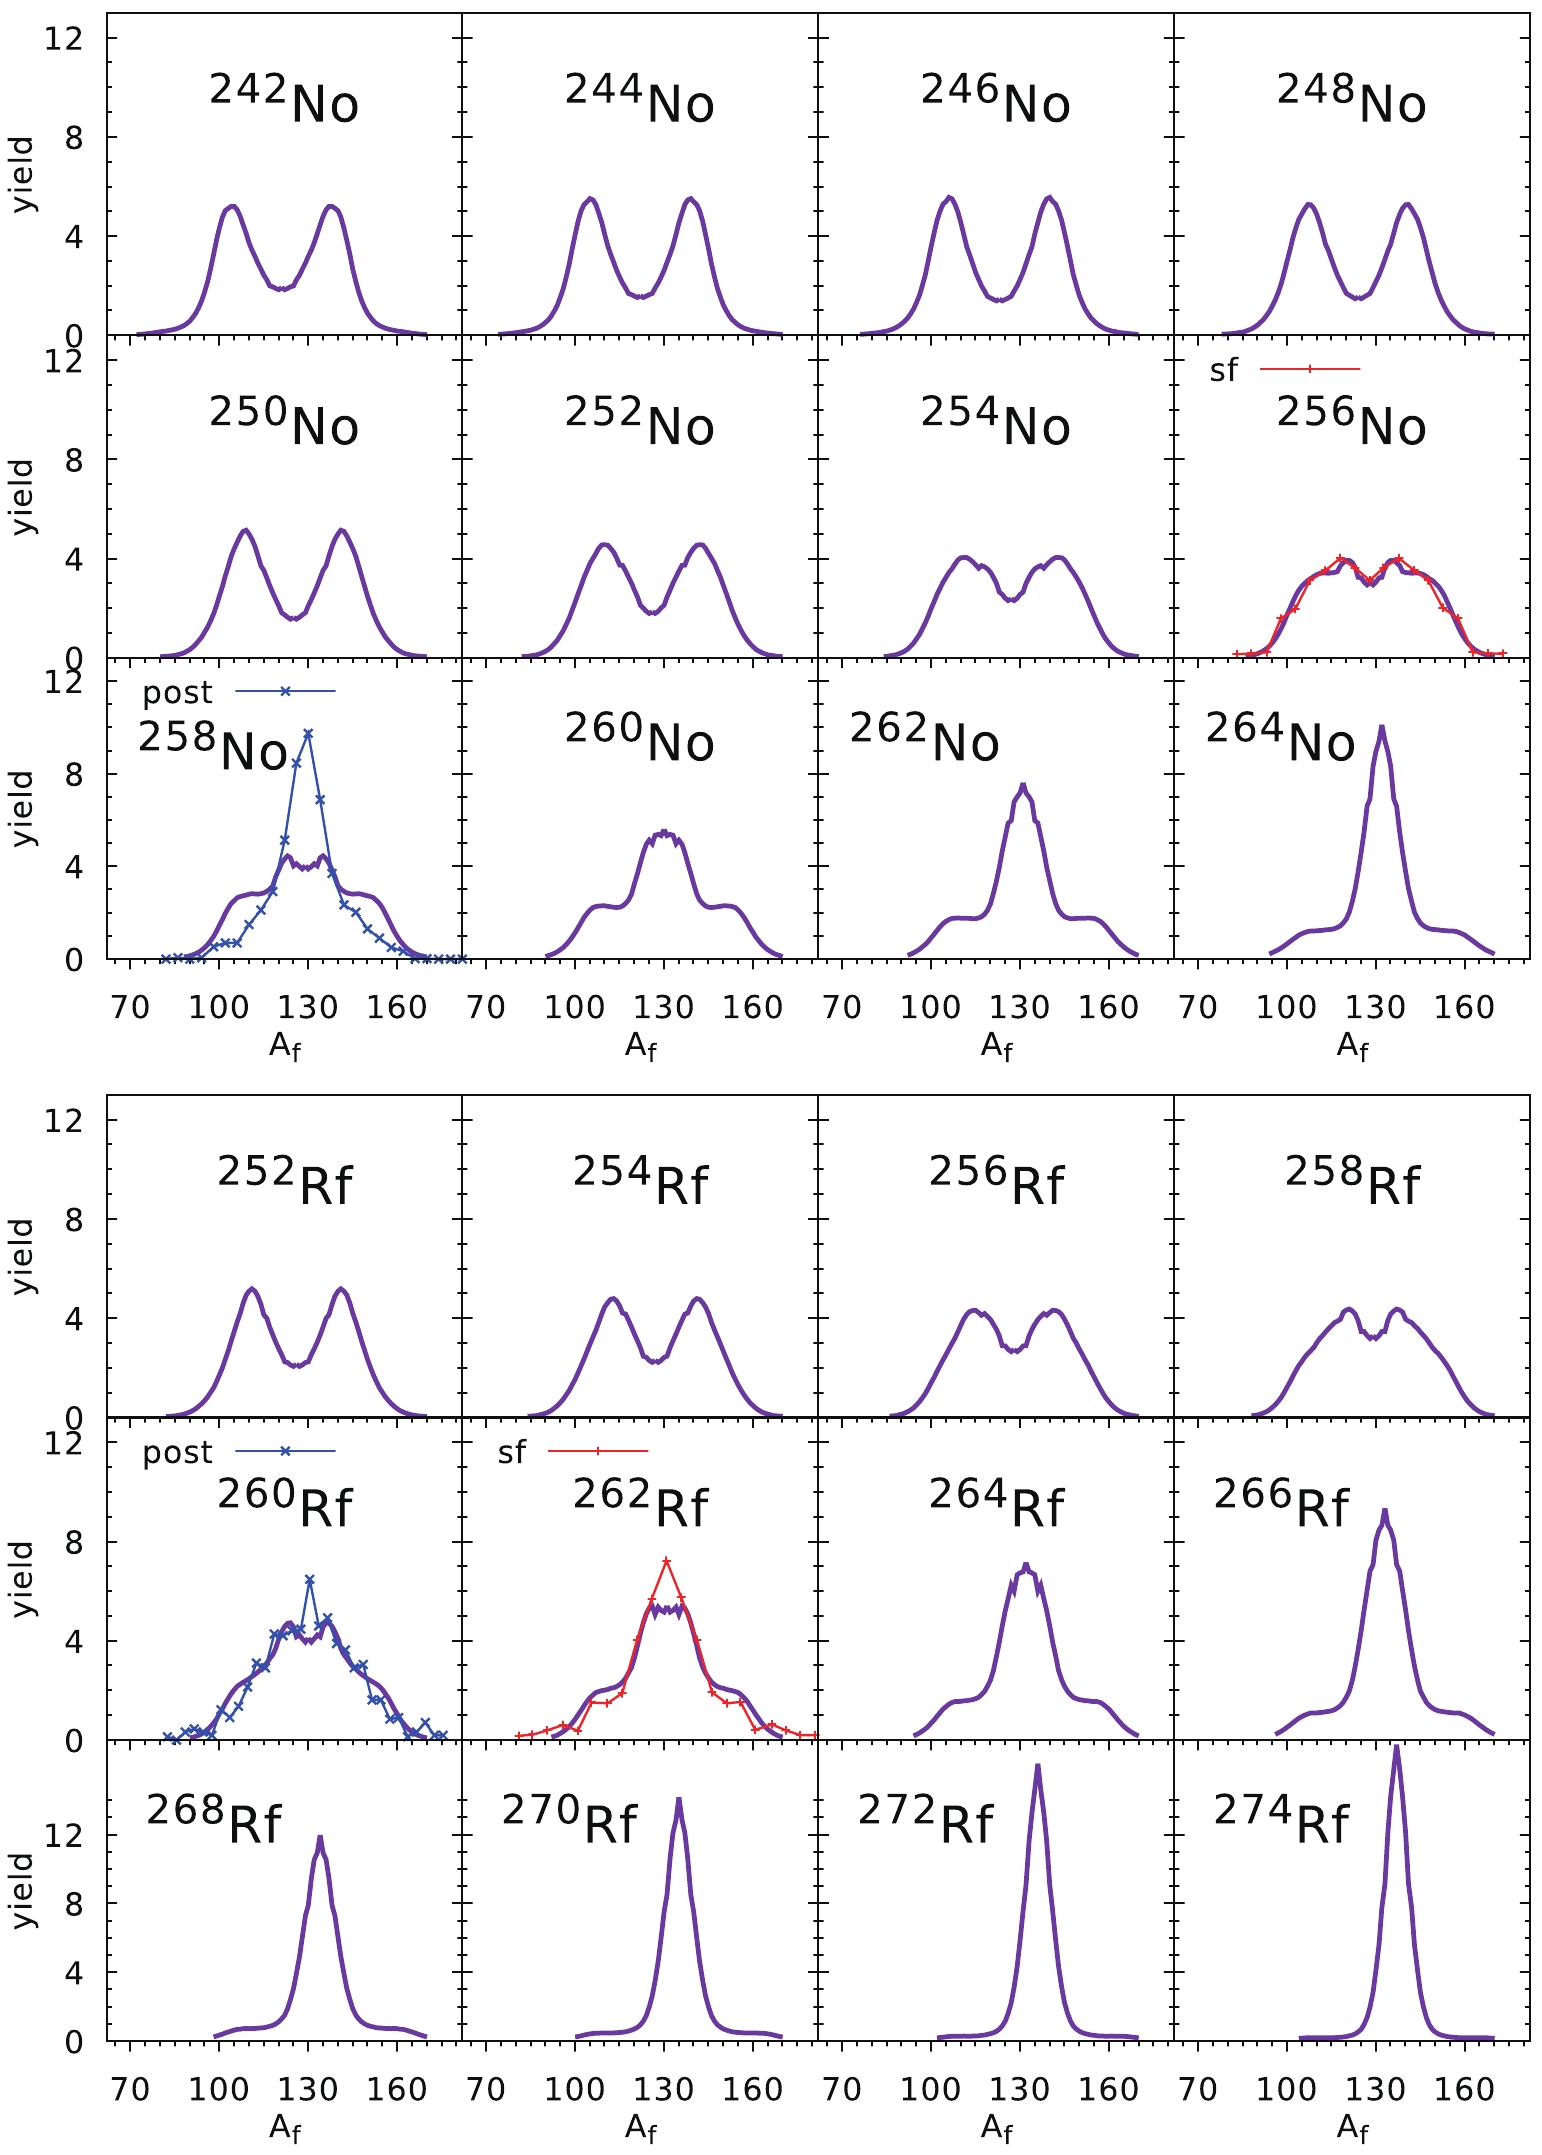
The prediction of the FMYs for Pu and Cm isotopes are compared with the experimental data in Fig. 7. The pre-neutron experimental yields for Pu [38] and
$ ^{246} $ Cm [39] isotopes are obtained for the spontaneous fission case, while those for$ ^{244} $ Cm and$ ^{248} $ Cm are post-neutron yields taken from Ref. [3]. A nice agreement with the data obtained for the two lightest Pu isotopes,$ ^{236} $ Pu and$ ^{238} $ Pu, is slightly spoiled when the number of neutrons increases, i.e. for$ ^{242} $ Pu and$ ^{244} $ Pu. This is mainly because we have used the globally optimized values of$ E_0 $ and d, which are not fitted to Pu data only as done in Ref. [12]. In all the Pu and Cm isotopes investigated here, asymmetric fission is predicted with the mass of the heavy fragment$ A_{\rm f}\approx 140 $ .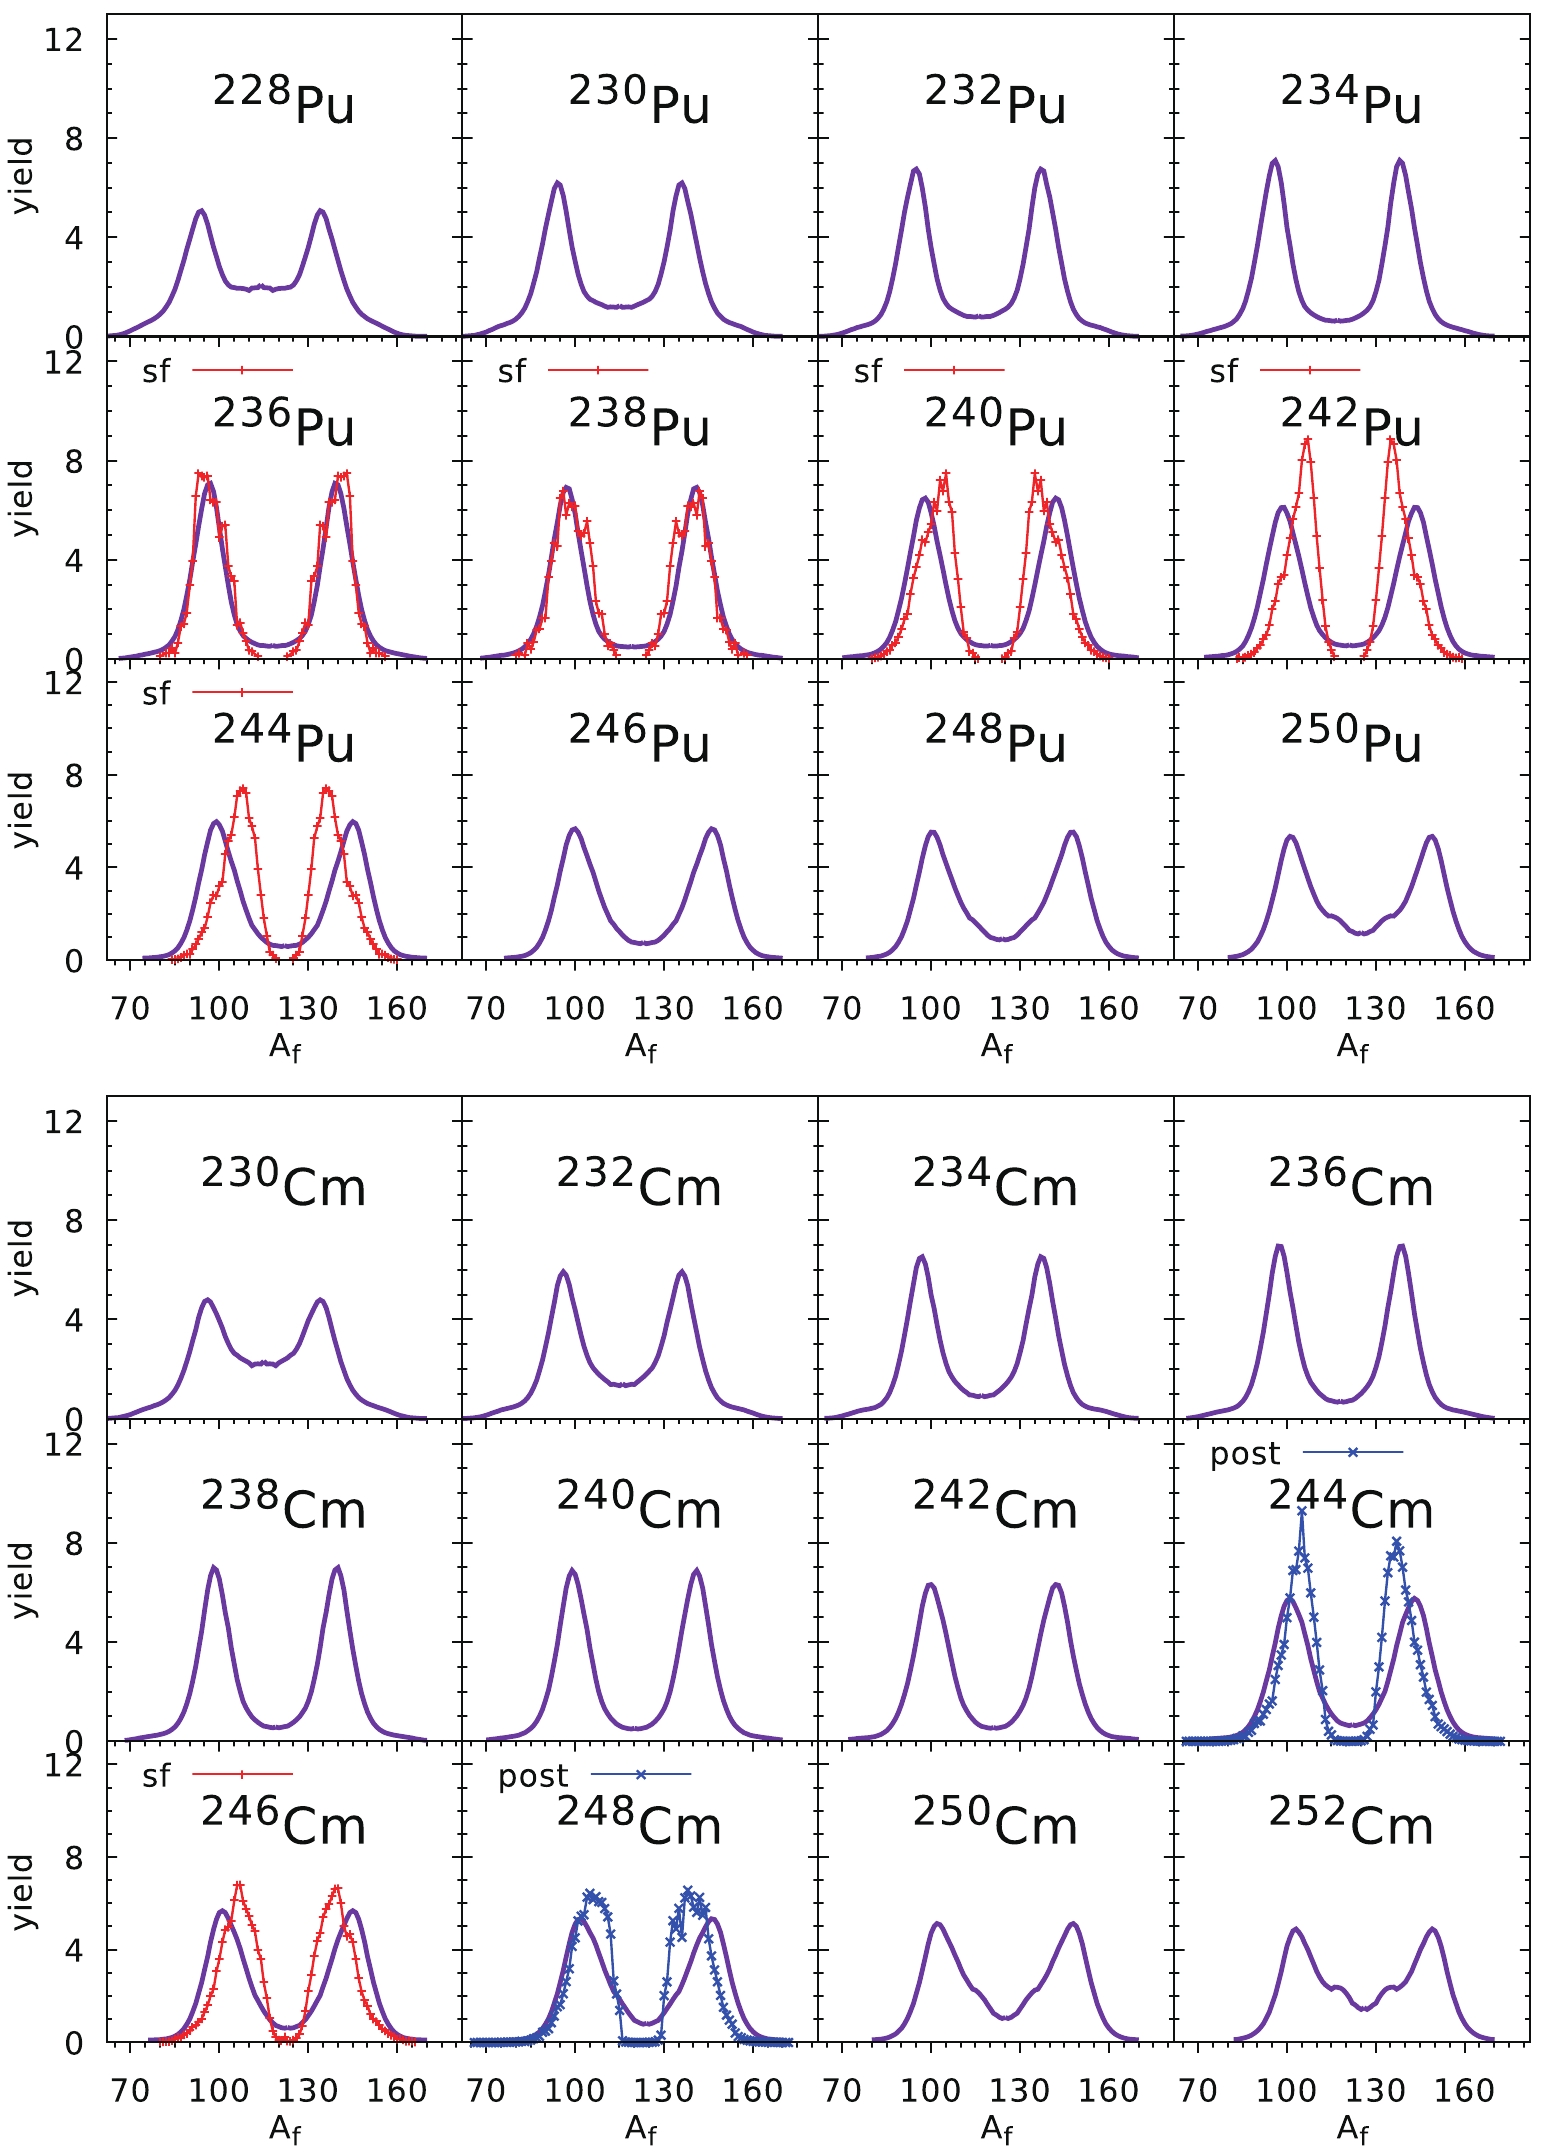
The estimates of the FMY for the Cf and Fm chains of isotopes are shown in Fig. 8. All experimental data correspond to spontaneous fission, but only for
$ ^{252} $ Cf [37] and$ ^{256} $ Cf [38] are they for pre-neutron yields. The rest of the experimental yields presented in Fig. 8 correspond to the post-neutron data (blue crosses). One can see that for lighter Cf and Fm isotopes, asymmetric yields are predicted, while in the case of the heaviest Cf and Fm nuclei, symmetric fission is foreseen. As one can deduce from the above results, our estimates are rather consistent with the experimental yields. A similar tendency as seen in the Cf and Fm chains can be observed in Fig. 9 for the No and Rf isotopes, where asymmetric fission is predicted in the lighter nuclei, while the symmetric fission mode dominates for isotopes with$ N > 156 $ . The agreement with the experimental data for$ ^{256} $ No and$ ^{262} $ Rf [42, 43] is evident.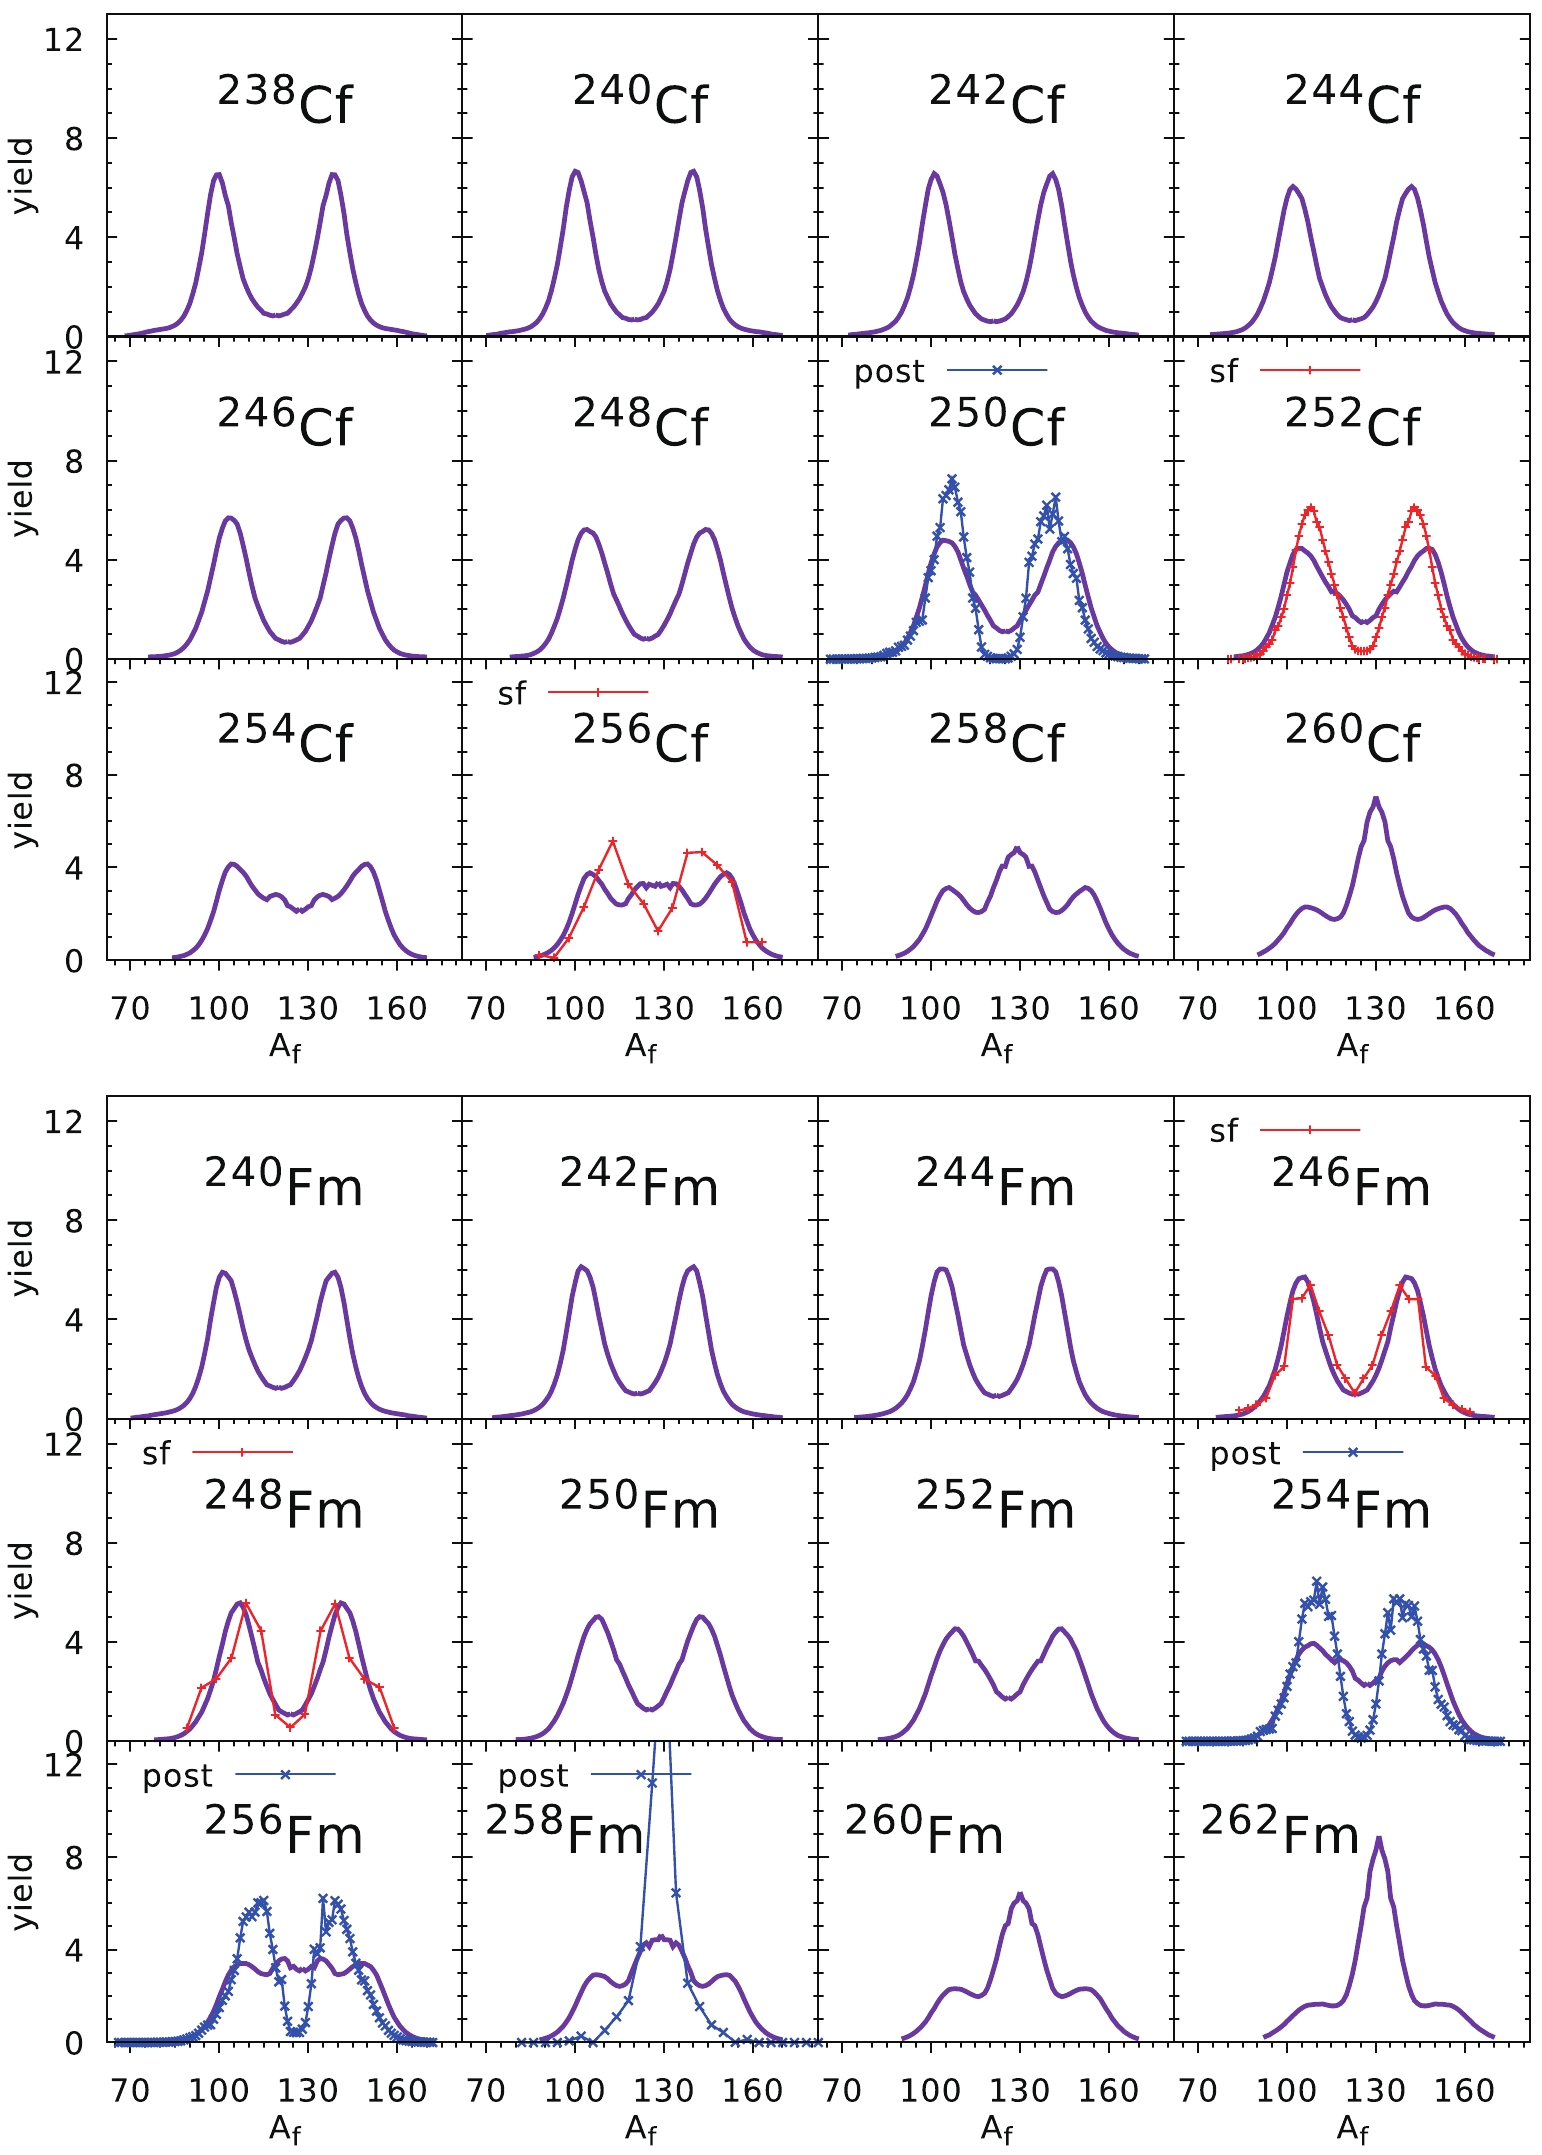
The overall good quality of our predictions in a broad mass region of the actinide elements is probably because in very heavy nuclei, the fission barrier is very short, and the fission valley forms very early, i.e., at a relatively small elongation of the nucleus. The opposite situation occurs in the thorium nuclei, where the fission barriers are very broad. Figure 10 presents the fission valley potential V as a function of the elongation parameter
$ q_2 $ . It is shown that the average slope of the curve from the last saddle to scission in the thorium nuclei is almost three times smaller than in nobelium. Such a large difference in the slope towards fission influences the fission dynamics in both types of nuclei. This is the main reason one has to study the PES in Th nuclei in detail to explain the change observed here in the FMY systematics.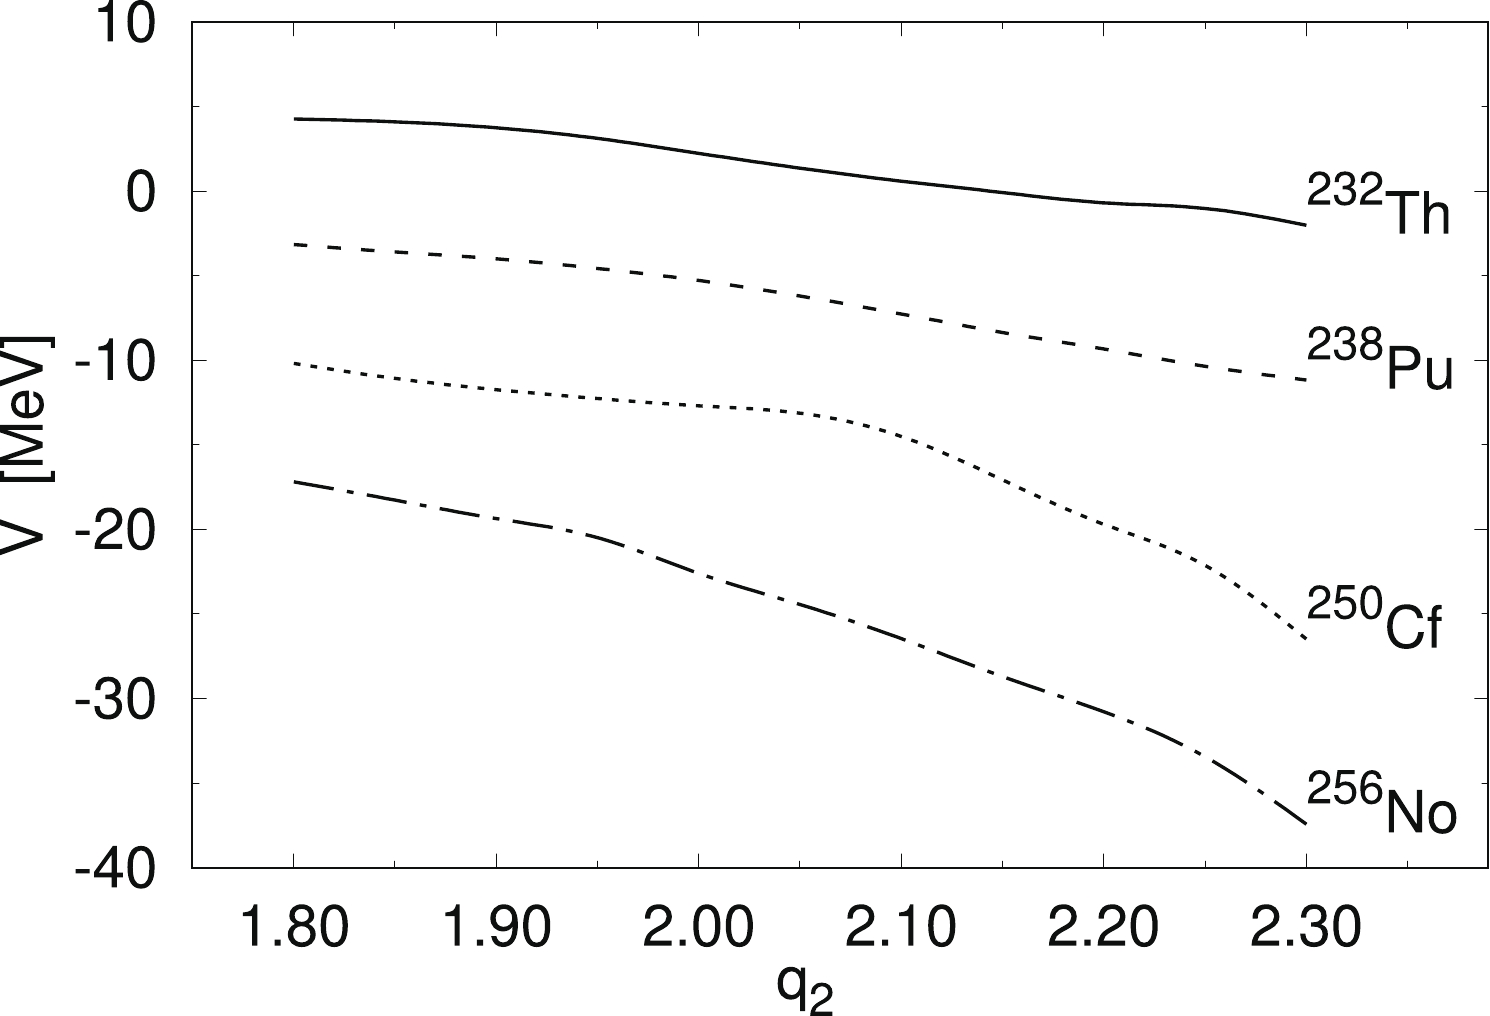
Figure 10. Potential corresponding to the bottom of fission valley as a function of the elongation parameter
$ q_2 .$ -
The agreement of our estimates of the FMYs with the experimental data in the Th chain of isotopes depicted in Fig. 6 is not quantitatively satisfactory. So, in the present section, we would like to look for the origin of these discrepancies. First, these yields for the Th nuclei are evaluated using
$ E_0 $ and d obtained by a fit to the data for all nuclei. The PESs for Th nuclei are very different from those for heavier nuclei. This can be seen by comparing the PES of$ ^{240} $ Pu shown in Fig. 2 (bottom) with the corresponding maps for$ ^{218-230} $ Th isotopes presented in Fig. 11.
Figure 11. (color online) Potential energy surface cross-sections of
$ ^{218-230} $ Th isotopes minimized with respect to the neck parameter$ q_4 $ on the plane$ (q_2,q_3) $ .In
$ ^{240} $ Pu, the fission path goes directly from the saddle point to the asymmetric fission valley. This is not the case in$ ^{218} $ Th, where the system from the 3rd minimum at$ q_2\approx 1.2 $ has a much smaller barrier towards symmetric fission ($ < 0.5 $ MeV) than an asymmetric one, where the barrier is slightly higher ($ \approx 1 $ MeV) and thicker. This means that the$ ^{218} $ Th nucleus prefers symmetric fission, which is confirmed by the experimental yield. In$ ^{222} $ Th the situation is similar, while beyond$ ^{226} $ Th the path leading to asymmetric fission begins to be preferred. To better understand this process, one has to study the PESs in the full 3D deformation space. In Fig. 12, the ($ q_3,q_4 $ ) cross-sections of the PES for$ ^{218} $ Th corresponding to different elongations ($ q_2 = $ 1.8, 2.0, 2.2, 2.3) are shown.
Figure 12. (color online) Potential energy surface cross-sections of
$ ^{218} $ Th on the plane$ (q_3,q_4) $ . The panels, from top to bottom, correspond to elongations$ q_2 = $ 1.8 to 2.3, respectively. The solid red lines drawn in the bottom panels correspond to the neck radius equaling the nuclear radius constant.Two minima, one corresponding to the symmetric (
$ q_3 = 0 $ ) and the other to the asymmetric ($ q_3\approx 0.12 $ ) configuration, are visible in each cross-section. At$ q_2 = 1.8 $ the asymmetric minimum is separated from the symmetric one by a 2.7 MeV high barrier. The barrier separating these two minima becomes smaller with growing elongation$ q_2 $ , reaching 0.7 MeV height at$ q_2 = 2.0 $ . At such elongations, the transition between symmetric and asymmetric fission is possible. Both fission valleys are well separated again at the largest deformations close to the scission line (the red line in the figure). So, the Th nuclei make the “decision” of where to go at an early stage, far before the scission configuration. This means that one has to modify the adjustable parameters$ E_0 $ and d to better describe the transition between the symmetric and asymmetric fission modes observed in Th nuclei when the neutron number grows. The new fit performed to the data for Th isotopes only gives$ E_0 $ = 1.5 MeV and$ d = $ 2.5 fm. The resulting mass yields are compared with the experimental data in Fig. 13. This time the agreement is much more satisfactory. The new value of the neck parameter d is larger than that adjusted to all nuclei. This suggests that in Th nuclei, the choice of the preferred fission mode is made at a thicker neck, i.e., at a fairly early stage. The smaller value of$ E_0 $ used for Th isotopes is probably related to the competition between the symmetric and asymmetric minima. -
To briefly summarize our investigations, we can write:
● The overall agreement of the theoretical FMY estimates with the experimental data indicates that the mac-mic model with the LSD energy for the macroscopic smooth part and the shell and pairing corrections evaluated based on the Yukawa-folded single-particle potential gives a good description of the potential energy surfaces of actinide nuclei;
● The three-dimensional set of the Fourier deformation parameters used to describe the shape of fissioning nuclei is fully capable of producing a wide variety of the shapes of nuclei on their way to fission;
● The collective 3D model based on the Born-Oppenheimer approximation and comprising elongation, mass asymmetry, and neck modes reproduces the main features of the fission fragment mass yield data well;
● The Wigner function used to approximate the probability distribution related to the neck and mass asymmetry degrees of freedom simulates this distribution properly for low-energy fission; and
● A neck-breaking probability depending on the size of the neck has to be introduced to improve the agreement of our FMY estimates with the experimentally measured values.
Our mac-mic model and the collective 3D approach, which couples fission mode, neck, and mass asymmetry collective vibrations, can describe the main features of the fission process in actinide nuclei. The estimated fission barrier heights do not deviate much from their experimental values. The measured fission fragment mass yields are also reproduced satisfactorily. On the other hand, one has to treat the presented collective model as a kind of rough tool which allows the FMY to be obtained by a relatively quick calculation. To get more precise results, one has to use more advanced models in which the whole fission dynamics and the energy dissipation are taken into account. Such calculations may use Langevin dynamics (cf. Ref. [10]) or the improved quantum molecular dynamics model (ImQMD). The latter method has been successfully applied to describe the fission process in heavy ion induced fission reactions, where the excitation energy increases, possibly leading to a shorter fission time scale and even to the occurrence of ternary fission [44, 45].
The Langevin type calculations, profiting from the PES generated in a mac-mic approach together with the 3D Fourier shape parametrization, as well as the use of the self-consistent method, are being carried out in parallel by our group.
-
The authors would like to thank Christelle Schmitt and Karl-Heinz Schmidt for supplying us with part of the experimental data.
Fission fragment mass yields of Th to Rf even-even nuclei
- Received Date: 2021-01-09
- Available Online: 2021-05-15
Abstract: Fission properties of the actinide nuclei are deduced from theoretical analysis. We investigate potential energy surfaces and fission barriers and predict the fission fragment mass yields of actinide isotopes. The results are compared with experimental data where available. The calculations were performed in the macroscopic-microscopic approximation with the Lublin-Strasbourg Drop (LSD) for the macroscopic part, and the microscopic energy corrections were evaluated in the Yukawa-folded potential. The Fourier nuclear shape parametrization is used to describe the nuclear shape, including the non-axial degree of freedom. The fission fragment mass yields of the nuclei considered are evaluated within a 3D collective model using the Born-Oppenheimer approximation.


 DownLoad: