-
The direct observation of gravitational waves (GWs) provides an important probe for investigating the dynamical origin of high-energy cosmic transients [1]. In 1987, neutrino signals were observed in the Super-Kamiokande [2], IMB [3], and Baksan [4] experiments, 7 hours before the optical observation of a type II core-collapse supernova in the Large Magellanic Cloud. After the first detection of GWs [5] at the Advanced Laser Interferometer Gravitational-wave Observatory (LIGO) [6], astronomy has transitioned into another new and exciting era of exploration. The detected GW170817 [7] was temporally correlated with the GRB170817A [8], detected by the Fermi-GBR 1.7 s after the proposed coalescence of two neutron stars (NSs), providing the first direct evidence of a link between NS mergers and gamma-ray bursts (GRBs). The search for coincident signals and the exploration of the dynamics of astronomical sources through distinct channels may facilitate the validation of competing model descriptions, thus expanding our understanding of the universe [1, 9, 10]. Therefore, studies on joint detection of GW events that coincide with neutrino signals have received substantial attention.
The merging of two black holes (BHs), two NSs, or a BH and an NS with rapidly rotating cores are expected to become GW sources, with an output that can be experimentally detected [11]. NS-NS or NS-BH mergers with an accretion disk or BH accretion disks that produce a gamma-ray burst (GRB) [12, 13] can also drive a relatively large neutrino outflow [14-18]. Neutrinos and GWs can propagate almost unchanged from their sources to a detector, acting as invaluable signatures of their hidden region of production. GWs of interest to this study are listed in Table 1, along with their observed times and distances.
GW events type of merged bodies detection time (UTC) distance $ D_{\rm{LIGO}} $ (Mpc)

GW150914 black holes 2015.09.14 09:50:45 $ 410^{+160}_{-180} $ 

GW151012 black holes 2015.10.12 09:54:43 $ 1100^{+500}_{-500} $ 

GW151226 black holes 2015.12.26 03:38:53 $ 440^{+180}_{-190} $ 

GW170104 black holes 2017.01.04 10:11:58 $ 880^{+450}_{-390} $ 

GW170608 black holes 2017.06.08 02:01:16 $ 340^{+140}_{-140} $ 

GW170814 black holes 2017.08.14 10:30:43 $ 540^{+130}_{-210} $ 

GW170817 neutron stars 2017.08.17 12:41:04 $ 40^{+8}_{-14} $ 

ANTARES and IceCube [25] searched for high-energy neutrino signals (above 100 GeV) within
$ \pm 500 $ s relative to the occurrence of GW150914 but did not find any significant signals. KamLAND [26] searched for low-energy neutrino signals (below 100 MeV) within$ \pm 500 $ s relative to GW150914 and GW151226 but was also unsuccessful in identifying significant signals above the background. Super-Kamiokande [27] searched for coincident neutrino events (3.5 MeV - 100 PeV) within$ \pm 500 $ s of GW150914 and GW151226 but observed no significant candidates beyond the expected background rate. Borexino [28] searched for correlated neutrino events with energies exceeding 250 keV for GW150914, GW151226, and GW170104, obtaining a result consistent with the expected number of solar neutrino and background events. Thus far, no experiment has observed any connection between GW events and neutrino signals.The Daya Bay experiment has been stably operating since 24 December 2011 and is part of the Supernova Early Warning System [29], facilitating long-term monitoring of astrophysical electron-antineutrino (
$ \bar\nu_e $ ) bursts. In this paper, we present a detailed off-line study using the data collected from 24 December 2011 to 30 August 2017 [30], based on the search for neutrino candidates coinciding with GW150914, GW151012, GW151226, GW170104, GW170608, GW170814, and GW170817. -
The Daya Bay Reactor Neutrino Experiment is designed to measure the electron-antineutrino disappearance with
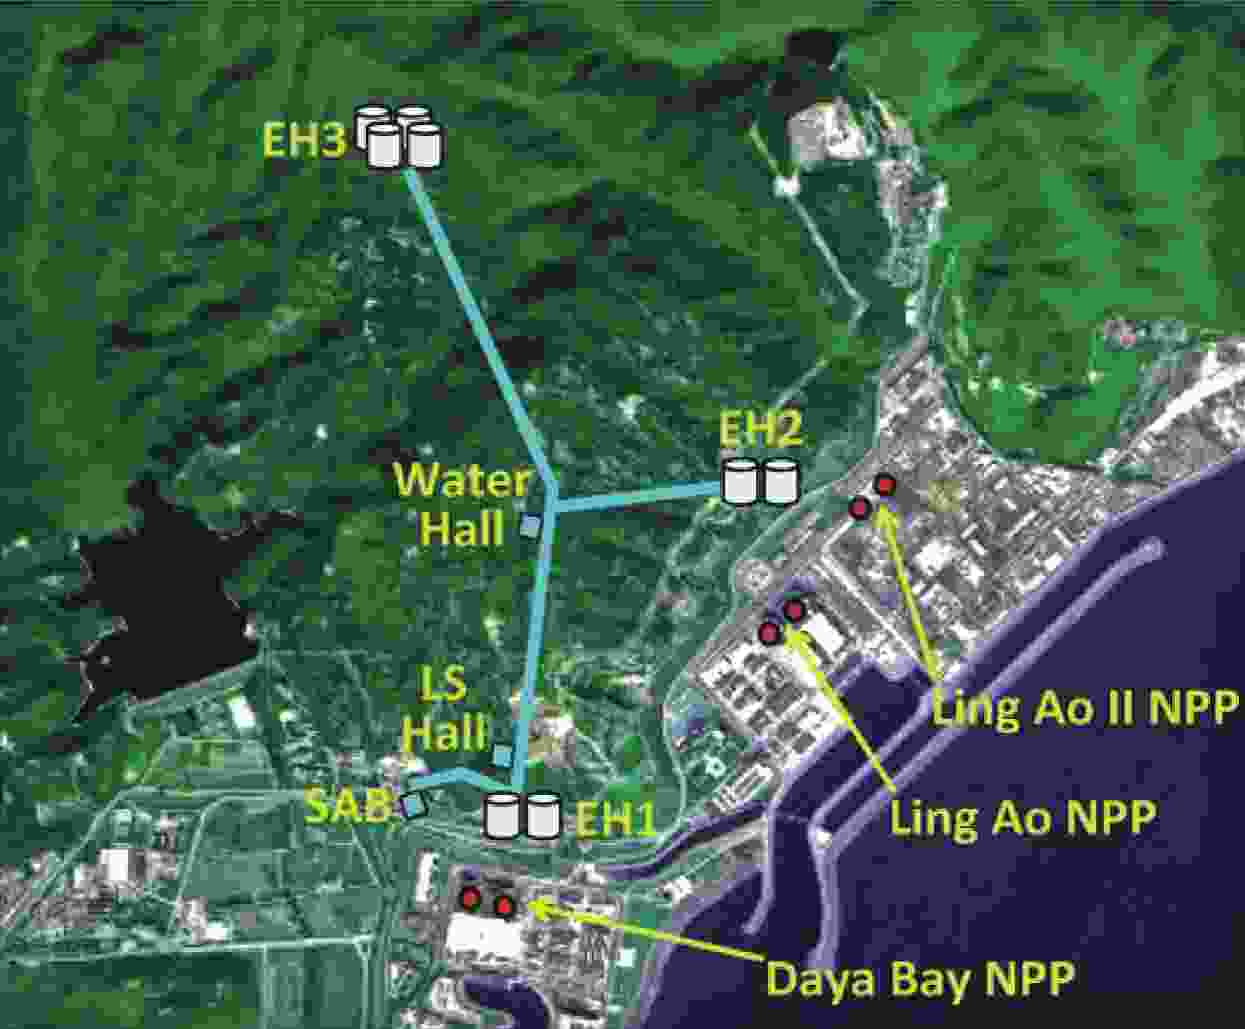
$ \bar\nu_e $ emitted by the six Daya Bay reactor cores. There are two nearby experimental halls (EH1 and EH2); each has two antineutrino detectors (ADs). Their distances to the nearby reactors range from 350 to 600 m. A more distant hall (EH3) has four ADs, and their distances to the reactors range from 1500 to 2000 m. The layout of the Daya Bay experiment is shown in Fig. 1. The three EHs are located underground with 250, 265, and 860 meters water-equivalent overburden, respectively.
Figure 1. (color online) Layout of the Daya Bay experiment. Eight antineutrino detectors (ADs) are placed in three experimental halls (EHs). The solid cylinders represent the ADs. There are three nuclear power plants (NPPs): Daya Bay, Ling Ao, and Ling Ao II near EH1 and EH2. Each NPP consists of two reactor cores, shown as the red dots in the figure.
Each AD is a 5-m-diameter and 5-m-tall stainless-steel vessel containing three volumes separated by two coaxial transparent acrylic vessels. The inner vessel holds 20 t of gadolinium-loaded liquid scintillator (Gd-LS) enclosed by the outer vessel filled with 22 t of undoped liquid scintillator (LS). The outermost volume holds 40 t of mineral oil and 192 20-cm-diameter photomultiplier tubes (PMTs). An engineering plot of the AD is shown in Fig. 2. A more detailed description of the apparatus is available in [31, 32]. The energy deposition and position of particles in each AD are reconstructed based on the amount of light collected by the PMTs. The universal time (UTC) of each event is recorded with a global positioning system (GPS) receiver.
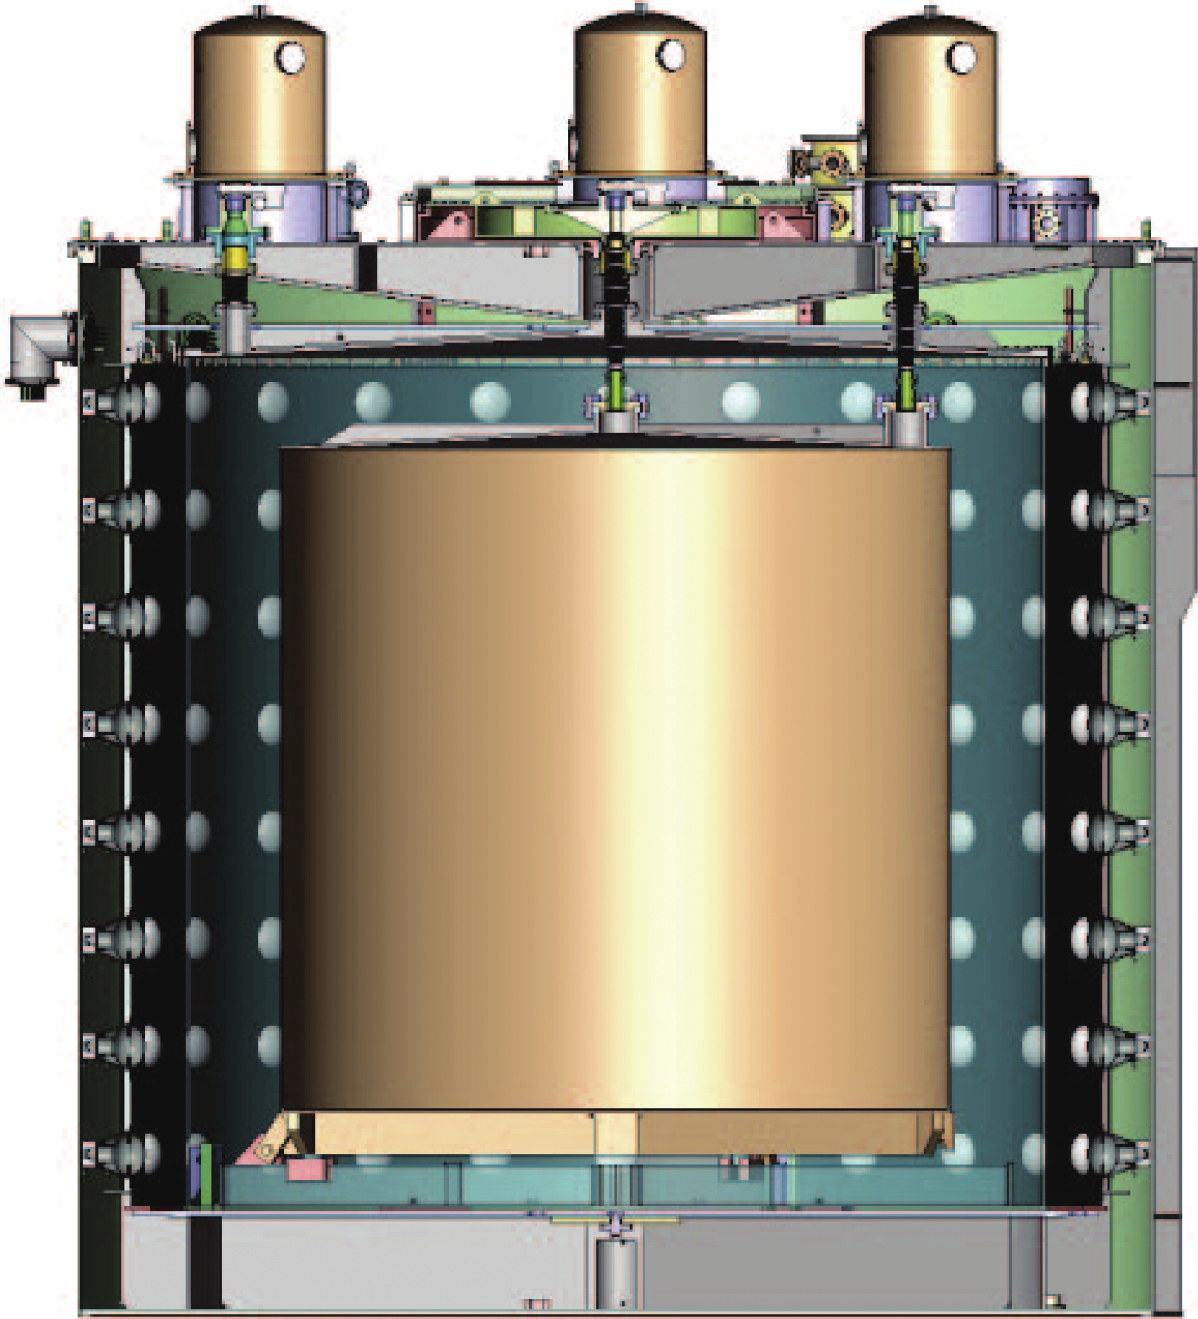
Figure 2. (color online) Schematic of the Daya Bay antineutrino detector. Three nested structures, starting from the inner-most one, contain a gadolinium-loaded liquid scintillator, an un-doped liquid scintillator, and mineral oil. Three automated calibration units are installed at the top of each detector for calibration along three vertical axes. The inner surface of the stainless-steel vessel is equipped with 192 Hamamatsu R5912 PMTs to collect scintillation light.
The ADs are immersed in large water pools with at least 2.5 m of water on each side. Each water pool is divided into inner and outer regions (IWS and OWS), and both are equipped with PMTs. The water is used to shield the detectors from environmental radiation and to tag muons based on their Cherenkov radiation.
The reaction for the detection of
$ \bar\nu_e $ at Daya Bay is the inverse beta decay (IBD):$ \bar\nu_e + p \rightarrow e^+ + n. $

(1) The
$ e^+ $ rapidly deposits its kinetic energy and annihilates with an electron into two 0.511-MeV$ \gamma $ . The neutron is thermalized and captured on a Gd or H nucleus (nGd or nH). The energy deposited by the$ e^+ $ and neutron recoil forms a prompt signal, while the gamma ray(s) from the deexcitation after neutron capture generates a delayed signal. The prompt-delayed coincidence greatly suppresses the background. A search was performed for IBDs that are temporally coincident with the GW events at Daya Bay.In the analysis, we required each AD to be in standard physics data acquisition near the time of each GW. For GW150914, GW151226, and GW151012, the experiment was in regular operation. During GW170104, both ADs in EH1 were calibrated using radioactive sources and were excluded from the analysis. AD1 in EH1 was offline during GW170608, GW170814, and GW170817.
-
We limited our search to
$ \bar\nu_e $ with energies below 100 MeV, motivated by the 1987A supernova neutrino observation [2-4] and theoretical models in which the neutrino energies are mostly below 100 MeV [16, 33]. This energy range is also within the best detection range of the Daya Bay detectors.Theoretically, the arrival sequence of neutrinos and GWs and the duration of the neutrino burst, depend on the physical process and modeling. To account for uncertainties, we adopted multiple time windows to search for neutrino bursts associated with the GW events. First, we used a narrow time window of
$ \pm $ 10 s for GWs generated in a physical process similar to that of core-collapse supernovae [34]. Next, we applied an intermediate time window of$ \pm $ 500 s to cover a greater time difference between the GW event and the predicted neutrino emission [35]. Finally, we tested a more conservative time window of$ \pm $ 1000 s [36].In the analysis, we first measured the electron-antineutrino fluence,
$ \Phi_{\rm{FD}} $ , with a normalized pinched Fermi-Dirac spectrum [37, 38], for zero chemical potential and a pinching factor of$ \eta = 0 $ , as applied in the KamLAND experiment [26]. Using the number of electron-antineutrino candidates$ N_{\nu} $ within the searching window, the electron-antineutrino fluence is calculated as$ \Phi_{\rm{FD}} = \frac{N_{\nu}}{N_p\int \sigma (E_{\nu}) \epsilon(E_{\nu}) \phi(E_{\nu}) {\rm d} E_{\nu}}, $

(2) where
$ N_p $ is the number of target protons,$ \sigma(E_\nu) $ is the IBD cross-section, and$ \epsilon(E_{\nu}) $ is the detector efficiency. The Fermi-Dirac spectrum is$ \phi(E_{\nu}) = \frac{1}{T^{3}F_{2}(\eta)}\frac{E_\nu^2}{{\rm e}^{E_\nu/T-\eta}+1}, $

(3) where the complete Fermi-Dirac integral function,
$ F_n(\eta) $ , is given by$ F_{n}(\eta) = \int^{\infty}_{0} \frac{x^{n}}{{\rm e}^{x-\eta}+1}{\rm d}x, $

(4) and the average
$ \bar{\nu}_e $ energy is set to$ \langle E_{\nu}\rangle = 12.7 $ MeV [39];$ T = \langle E_{\nu}\rangle $ /3.15.To examine the detailed sensitivity of the Daya Bay, the fluence was also estimated at several discrete energies
$ \Phi_{\rm{D}}(E_\nu) $ below 100 MeV as$ \Phi_{\rm{D}}(E_\nu) = \frac{N_{\nu}}{N_p\sigma (E_{\nu}) \epsilon(E_{\nu})}, $

(5) where
$ N_{\nu} $ is the number of neutrino candidates as in Eq. (2) but limited to only the nearby region of the energy of interest. -
In the IBD process, the positron kinetic energy depends on the true neutrino energy,
$ E_\nu $ , and the scattering angle. As such, the recoiling neutron from the IBD process shares part of the neutrino energy. Most of the neutron kinetic energy will transfer to the proton by scattering. The kinetic proton produces approximately half of the scintillation for the same kinetic energy of an electron, considering the quenching effect. The effects in the IBD process and the detector response are considered in the Daya Bay simulation, and smearing of the reconstructed prompt energy,$ E_{\rm rec} $ , is introduced when converted from$ E_\nu $ .In the analysis, for
$ E_\nu <100 $ MeV, the relationship between the mean value of$ E_{\rm rec} $ (defined as$ E_p $ ) and$ E_\nu $ is estimated based on simulation results and is described by the following empirical equation:$ E_p = A \times E^2_{\nu} + B \times E_\nu +C, $

(6) where
$ A = -0.0010\; \rm{MeV^{-1}} $ ,$ B = 1.01 $ , and$ C = -0.73 $ MeV. Due to the smearing effect in the energy conversion process, various energy windows will be opened to search for neutrinos with specified discrete energies as described in the next section.The absolute energy scale given in Eq. (6) is calibrated using spallation neutrons, radiative sources, and Michel electrons. At low energies,
$ E_p<10 $ MeV, and in the Gd-LS region, the absolute energy scale uncertainty is less than 1% [40]. In the LS region, the absolute energy scale uncertainty is better than 6% [41]. At the higher energy range of Michel electrons, 53 MeV, the absolute energy scale uncertainty is better than 10% for AD. -
The IBD candidates are selected according to their features. Neutron capture on gadolinium emits an approximately 8-MeV
$ \gamma $ cascade, and the average neutron capture time in the Gd-LS region is 28 μs [40]. A 2.2-MeV gamma ray is emitted after neutron capture on hydrogen, and the average capture time is 216 μs in the LS region [41, 42].In the analysis, the standard selection criteria for IBDs in [40, 41] were adopted with a few minor modifications, as shown in Table 2. AD-triggered events caused by spontaneous light emission from PMTs (flashers) were rejected with no loss in efficiency [43]. The coincidence time of the prompt and delayed signals was required to be greater than 1 μs and less than 200 and 400 μs for the nGd and nH samples, respectively. The delayed signal needed to be higher than 6 MeV for the nGd sample and exhibit a three-standard-deviation cut near the 2.2 MeV gamma-ray energy peak for the nH sample. Two more cuts were applied to suppress the accidental background in the nH sample. The distance between the prompt and delayed signal vertices needed to be less than 100 cm, and a lower bound of 3.5 MeV was required for the reconstructed prompt energy. Furthermore, the prompt-energy cut was adjusted according to the different searching regions as follows.
nGd nH basic AD trigger and flasher cut AD muon > 100 MeV AD muon veto (0, 800) μs pool muon [IWS, OWS] ${N_{{\rm{IWS}}\;{\rm{PMT}}}} > 12$ or

${N_{{\rm{OWS}}\;{\rm{PMT}}}} > 15$ 

pool muon veto (0, 600) μs shower muon > 2.5 GeV shower muon veto (0, 1) s coincidence time (1, 200) μs (1, 400) μs delayed energy $(6, 12)$ MeV

peak $\pm 3 \sigma_{E}$ 

coincidence distance N/A <100 cm prompt energy (basic) N/A > 3.5 MeV prompt energy (window) signal searching region Table 2. Selection criteria for the nH and nGd neutrino candidate samples. See the text for more details.
● For the Fermi-Dirac spectrum, the neutrino energy range of interest is 1.8 to 100 MeV, which corresponds to the reconstructed prompt energy of 0.7 to 90 MeV, as given by Eq. (6). Due to the different ratios of signal to background, the searching energy range is further divided into two regions, low E (
$ E_{\rm rec} $ $ < $ 10 MeV) and high E ($ E_{\rm rec} $ $ > $ 10 MeV).● For the monochromatic spectra, we selected
$ \bar{\nu}_e $ energies at 5, 7, 10, 20, 30, 50, 70, and 90 MeV to represent the entire energy range ($ E_{\nu}< $ 100 MeV). For these specified discrete$ \bar{\nu}_e $ energies, the prompt-energy search range was$ E_p \pm \Delta $ , where$ \Delta $ is defined as follows:$ \Delta = 5 \times \sqrt{a^2 \times E^2_{p}+ {b^2} \times {E_{p}}+{c^2}}, $

(7) where the parameters,
$ a = 0.016 $ ,$ b = 0.081 $ $ \rm{MeV^{1/2}} $ , and$ c = 0.026 $ MeV. We obtained these parameters from the detector resolution equation [40] to define the signal window.The above selection criteria define different energy regions, neutron capture samples (nH or nGd), and ADs. In total, there are 32 data sets for the Fermi-Dirac spectrum study and 16 data sets for each monochromatic energy study.
The number of candidates is measured within these regions of interest. The detailed time and energy information is documented in Appendix A. A detailed example for GW150914 is shown in Table 3.
nGd Low E nGd High E nH Low E nH High E EH1-AD1 candidate 4 0 4 0 BKG. (±5 days) 6.96±0.08 0.060±0.008 2.52±0.06 0.080±0.009 BKG. (averaged) 7.65±0.01 0.064±0.001 2.88±0.01 0.092±0.001 EH1-AD2 candidate 5 0 1 0 BKG. (±5 days) 6.95±0.08 0.054±0.007 2.54±0.05 0.072±0.008 BKG. (averaged) 7.65±0.01 0.064±0.001 2.88±0.01 0.092±0.001 EH2-AD1 candidate 4 0 2 0 BKG. (±5 days) 6.62±0.08 0.037±0.006 2.37±0.05 0.041±0.006 BKG. (averaged) 6.82±0.01 0.043±0.001 2.58±0.01 0.063±0.001 EH2-AD2 candidate 8 0 1 0 BKG. (±5 days) 6.46±0.08 0.027±0.005 2.35±0.05 0.056±0.006 BKG. (averaged) 6.82±0.01 0.043±0.001 2.58±0.01 0.063±0.001 EH3-AD1 candidate 0 0 0 0 BKG. (±5 days) 0.97±0.03 0.004±0.002 0.37±0.02 0.008±0.003 BKG. (Averaged) 0.850±0.001 0.0038±0.0001 0.330±0.001 0.0056±0.0001 EH3-AD2 candidate 0 0 0 0 BKG. (±5 days) 1.00±0.03 0.003±0.002 0.36±0.02 0.007±0.003 BKG. (averaged) 0.850±0.001 0.0038±0.0001 0.330±0.001 0.0056±0.0001 EH3-AD3 candidate 0 0 0 0 BKG. (±5 days) 0.97±0.03 0.001±0.001 0.34±0.02 0.004±0.002 BKG. (averaged) 0.850±0.001 0.0038±0.0001 0.330±0.001 0.0056±0.0001 EH3-AD4 candidate 1 0 0 0 BKG. (±5 days) 0.97±0.03 0.007±0.002 0.36±0.02 0.005±0.002 BKG. (averaged) 0.850±0.001 0.0038±0.0001 0.330±0.001 0.0056±0.0001 Table 3. Candidates and background details for the GW150914 coincidence neutrino search. Listed are the number of candidates in
$ \pm $ 500 s near GW150914. The background is calculated using data over$ \pm $ 5 days or using the average background rate of all data multiplied by 1000 s. The uncertainties are statistical only. -
This section describes the determination of the background. In all possible cases, we used a real-time estimation, i.e., the result over
$ \pm $ 5 days near a GW for background estimation. However, when the background is very low, we used the average of the entire data set.The prompt-energy spectra for the entire analyzed data period after the selection criteria are treated as the background, and are shown in Fig. 3. In the low-energy region (
$ < $ 10 MeV), the background is dominated by reactor anti-neutrinos because the detector is close to the reactors. The variation of these backgrounds with time follows the trend of the reactor power, which was published in a previous Daya Bay report [44]. In the high-energy region (10 to 100 MeV), the background is dominated by fast neutrons. The fast neutrons are the spallation products induced by cosmic-ray muons that are not vetoed. The proton recoil of a neutron introduces a prompt signal, whereas the capture of the neutron yields the delayed signal [40, 41]. The muon flux has some seasonal changes, and the maximal annual change is less than 1% [45]; for the short time span of this study, the variation of these backgrounds is not significant.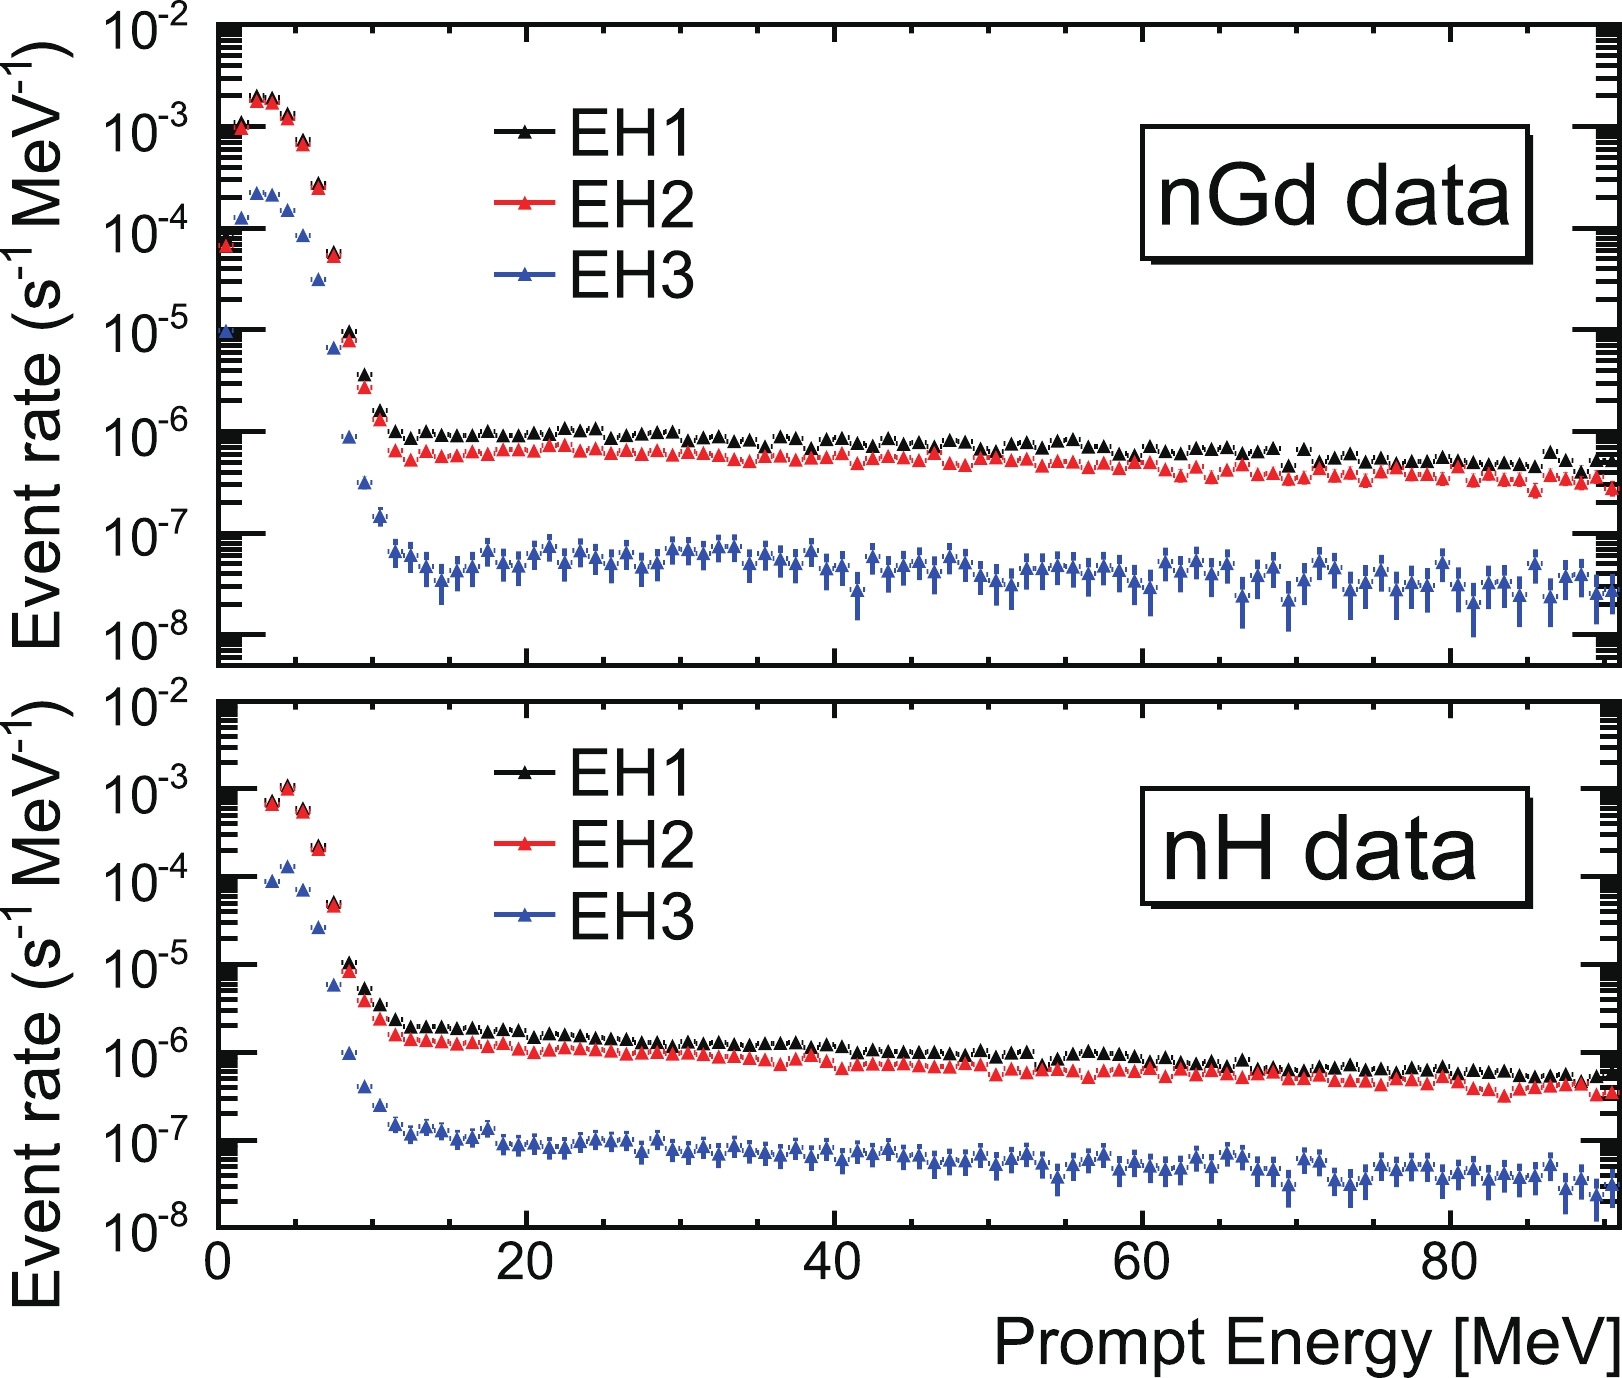
Figure 3. (color online) Prompt-energy spectra of the neutrino candidates. The upper (lower) panel shows the spectra for the nGd (nH) selection.
The detailed background determined based on the
$ \pm $ 5 days data is shown in Table 3 for GW150914. The average background rates for each AD are calculated using all the data and are shown in Table 4. The ADs in the same EH are close to each other. We will compile other results in the same EH as shown for conciseness. In Table 3, the calculated background rate using the average rate multiplied by 1000 s is also shown for comparison.EH1 EH2 EH3 nGd Low E $ (7.65 \pm 0.01)\; \times 10^{-3} $ 

$ (6.82 \pm 0.01)\; \times 10^{-3} $ 

$ (8.45 \pm 0.01)\; \times 10^{-4} $ 

High E $ (6.35 \pm 0.04 )\; \times 10^{-5} $ 

$ (4.32\pm 0.04)\; \times 10^{-5} $ 

$ (3.83 \pm 0.08)\; \times 10^{-6} $ 

nH Low E $ (28.75 \pm 0.04)\; \times 10^{-4} $ 

$ (25.76 \pm 0.03)\; \times 10^{-4} $ 

$ (3.25 \pm 0.01)\; \times 10^{-4} $ 

High E $ (9.20 \pm 0.05 )\; \times 10^{-5} $ 

$ (6.30 \pm 0.05 )\; \times 10^{-5} $ 

$ (5.65 \pm 0.10)\; \times 10^{-6} $ 

Table 4. Average background rate (per second per antineutrino detector) for the studied energy spectrum (Low E:
$ E_{\rm rec} < 10 $ MeV, High E:$ E_{\rm rec}> 10 $ MeV). The uncertainties are statistical only.Depending on the statistics (Fig. 3, Table 3, and Table 4), for a low E region in which the background rate is high and sensitive to reactor power changes, the background rate is determined using the data for
$ \pm $ 5 days of a GW. For the high E region, the background rate is low. Occasionally, there are zero background events in$ \pm $ 5 days for EH3. Considering the stability of the muon flux, the background prediction is obtained by scaling the average background rate. -
The following is a detailed comparison of the background and candidates. For example, the numbers of candidates for GW150914 in
$ \pm $ 500 s for the 32 regions are shown in Table 3. This information can also be obtained from the figures in appendix A. The number of backgrounds comes from the result of the$ \pm5 $ -day calculation and the result obtained by scaling the average rates in Table 4 by 1000 s. The number of candidates is in agreement with the statistical fluctuation of the background predictions.A thorough check shows that for all GW candidates and all searching regions, the number of candidates is in agreement with the background predictions within their statistical fluctuation. Given the current situation that a statistically significant signal is not found, the detailed background information is not listed.
-
The signal detection efficiency,
$ \epsilon $ , is defined as [40, 41]:$ \epsilon = \epsilon_\mu \cdot \epsilon_m \cdot \epsilon_{\rm other}, $

(8) with
$ \epsilon_{\rm other} = \sum\limits_v (N_{p,v} \cdot \epsilon_{Ep,v} \cdot \epsilon_{Ed,v} \cdot \epsilon_{D,v} \cdot \epsilon_{T,v}) / \sum\limits_v N_{p,v}, $

(9) where
$ \epsilon_\mu $ is the muon veto efficiency,$ \epsilon_m $ is the multiplicity cut efficiency for the two-fold event selection, and$ \epsilon_{Ep,v} $ ,$ \epsilon_{Ed,v} $ ,$ \epsilon_{D,v} $ , and$ \epsilon_{T,v} $ correspond to the prompt energy, delayed energy, coincident distance (for the nH sample only), and coincident time efficiency, respectively. The efficiency$ \epsilon_{\rm other} $ is separately evaluated for each detector volume v and is summed according to the number of free protons$ N_{p,v} $ in each volume.The
$ \epsilon_\mu $ accounts for the live time lost due to the application of the muon veto time. We averaged$ \epsilon_{\mu} $ for$ \pm5 $ days near each GW arrival time for the final result. The average values of$ \epsilon_\mu $ over all GW candidates for nGd and nH sample selection are shown in Table 5.EH1 EH2 EH3 nGd $\epsilon_{\mu}$ 

79% 84% 98% $\epsilon_{m}$ 

98% 98% 98% nH $\epsilon_{\mu}$ 

77% 81% 98% $\epsilon_{m}$ 

98% 99% 98% Table 5. Muon veto cut efficiency,
$ \epsilon_\mu $ , and multiplicity efficiency,$ \epsilon_m $ .The multiplicity cut efficiency
$ \epsilon_m $ applies to the two-fold event selection. The quantity$ \epsilon_m $ is a function of the event rate and has a minor dependence on the muon rate and coincident time. Further details can be found in the literature [46]. In this study, we averaged$ \epsilon_m $ for$ \pm5 $ days near each GW arrival time. The difference between the nGd and nH samples and that between the halls are not significant. The average values of$ \epsilon_m $ over all GW candidates for nGd and nH sample selection are shown in Table 5.For
$ \epsilon_{\rm other} $ , all values are estimated based on simulation results. The efficiencies$ \epsilon_{\rm other} $ for the Fermi-Dirac study are shown in Table 6, and those for the monochromatic study are shown in Fig. 4. The prompt and delayed energy cuts for the Fermi-Dirac and monochromatic spectra lead to the main changes for$ \epsilon_{\rm other} $ . At high energies, the efficiency decreases because of the higher neutron energy and neutron inelastic scattering. For low energies of the nH sample, the efficiency decreases because of the 3.5 MeV prompt-energy cut.$ E_p < $ 10 MeV

$ E_p > $ 10 MeV

nGd 4.3% 32% nH 4.4% 28% Table 6. Summary of
$ \epsilon_{\rm other} $ values for IBD searching with Fermi-Dirac spectrum for Low E and High E.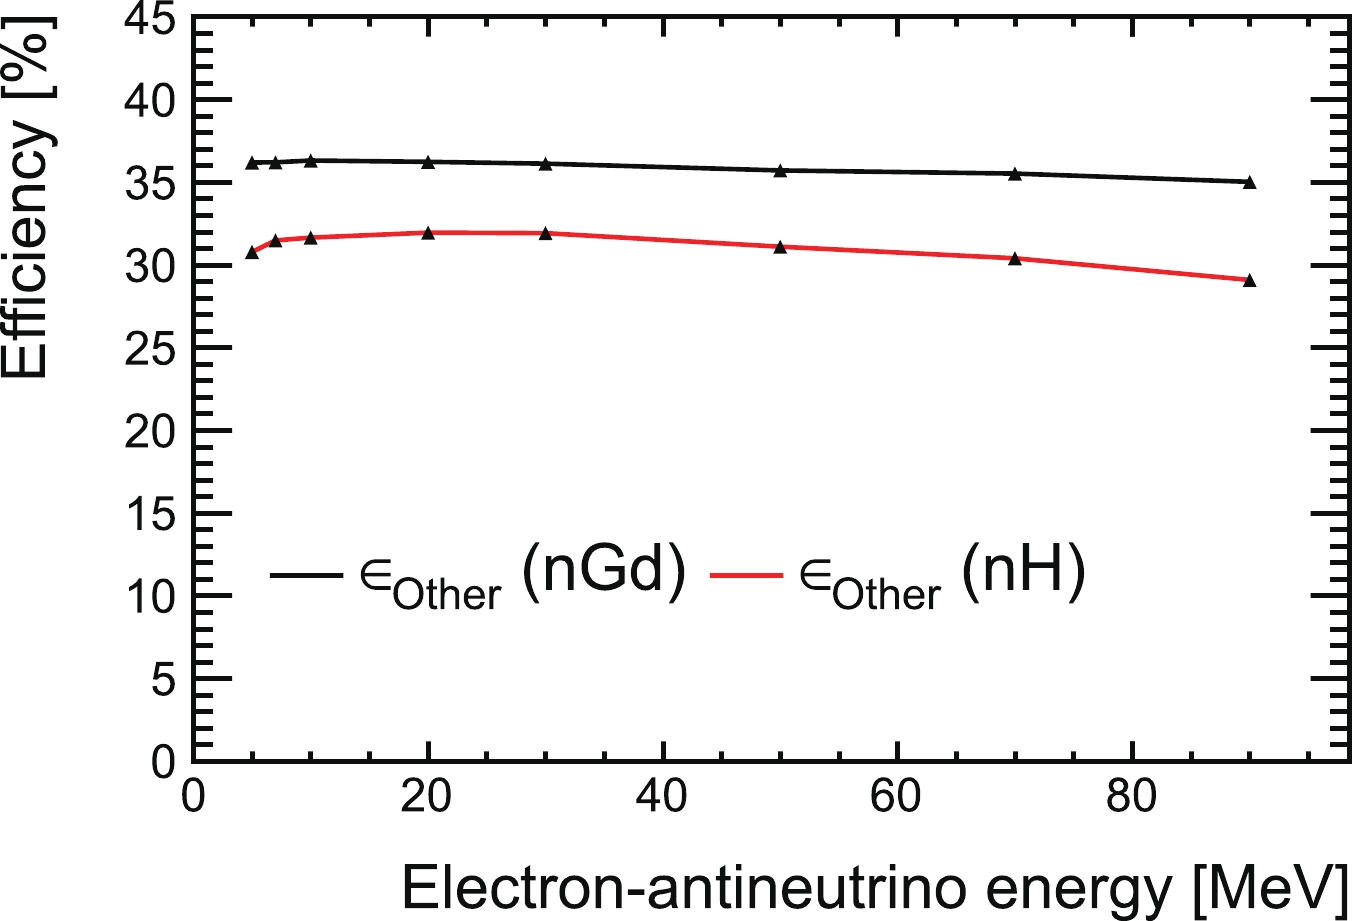
Figure 4. (color online) IBD selection efficiency
$ \epsilon_{\rm other} $ estimated based on MC simulation as a function of the$ \bar{\nu}_e $ energy.The uncertainty of the energy cut efficiency can be estimated using the absolute energy scale uncertainty (see section IV.A) and is less than 4%. The simulation of the coincident distance and the time between the prompt and delayed signal is validated using several natural coincident signals at low energies, as previously reported [46], and using fast neutrons at high energies. The efficiency uncertainty is less than 10%. The total uncertainty of the efficiency is less than 10% and negligible when calculating the upper limit.
-
Based on the observations in the study, the distributions of the GW
$ \bar{\nu}_e $ candidates are consistent with the expected background in terms of time and energy. Thus, a maximum-likelihood fitting approach was used to calculate the upper limit according to the combination of candidates and backgrounds in the different searching regions. -
The IBD cross-section is taken from [47]. The average cross-section,
$ \bar{\sigma} $ , is determined by integrating the IBD cross-section from 1.8 to 100 MeV over the neutrino spectrum. The detailed cross-section for the monochromatic energy and the average cross-section within 100 MeV for the Fermi-Dirac spectrum are given in Table 7.cross-section/( $\times 10^{-42} \;{\rm{c}}{{\rm{m}}^{\rm{2}}}$ )

5 MeV 7 MeV 10 MeV 20 MeV 30 MeV 50 MeV 70 MeV 90 MeV $\sigma(E_\nu)$ 

1.27 2.96 6.76 28.9 63.0 156 268 389 $\bar{\sigma}$ 

14.7 Table 7. IBD cross-section for the monochromatic spectra and the Fermi-Dirac spectrum.
-
A Poisson probability can be calculated for each searching region i:
$ P_i(\Phi) = \frac{(N_i+b_i)^{n_i}}{n_{i}!} {\rm e}^{-(N_i+b_i)}, $

(10) where
$ N_i $ is the expected number of neutrino events within the searching region i, estimated for the expected fluence$ \Phi $ (see Eq. (2) or Eq. (5)), efficiency, cross-section, and number of protons [40, 41];$ b_i $ is the expected background event, which is derived from the expected background rate, and$ n_i $ is the number of observed neutrino candidates. Given that the dominant errors are statistical, no other errors of the efficiency and background are included. The combined likelihood of all data sets is$L\left( \Phi \right) = \prod\limits_{i = 1}^{{N_{{\rm{data}}\;{\rm{sets}}}}} {{P_i}} \left( \Phi \right). $

(11) Using the combined likelihood function, we constructed a test statistic based on the profile likelihood ratio, which can be used for a one-sided test to find the upper limit as in Ref. [48]. We obtained the distribution of the test statistic using Monte-Carlo simulations and finally deduced the upper limit of
$ \Phi(E_\nu) $ . -
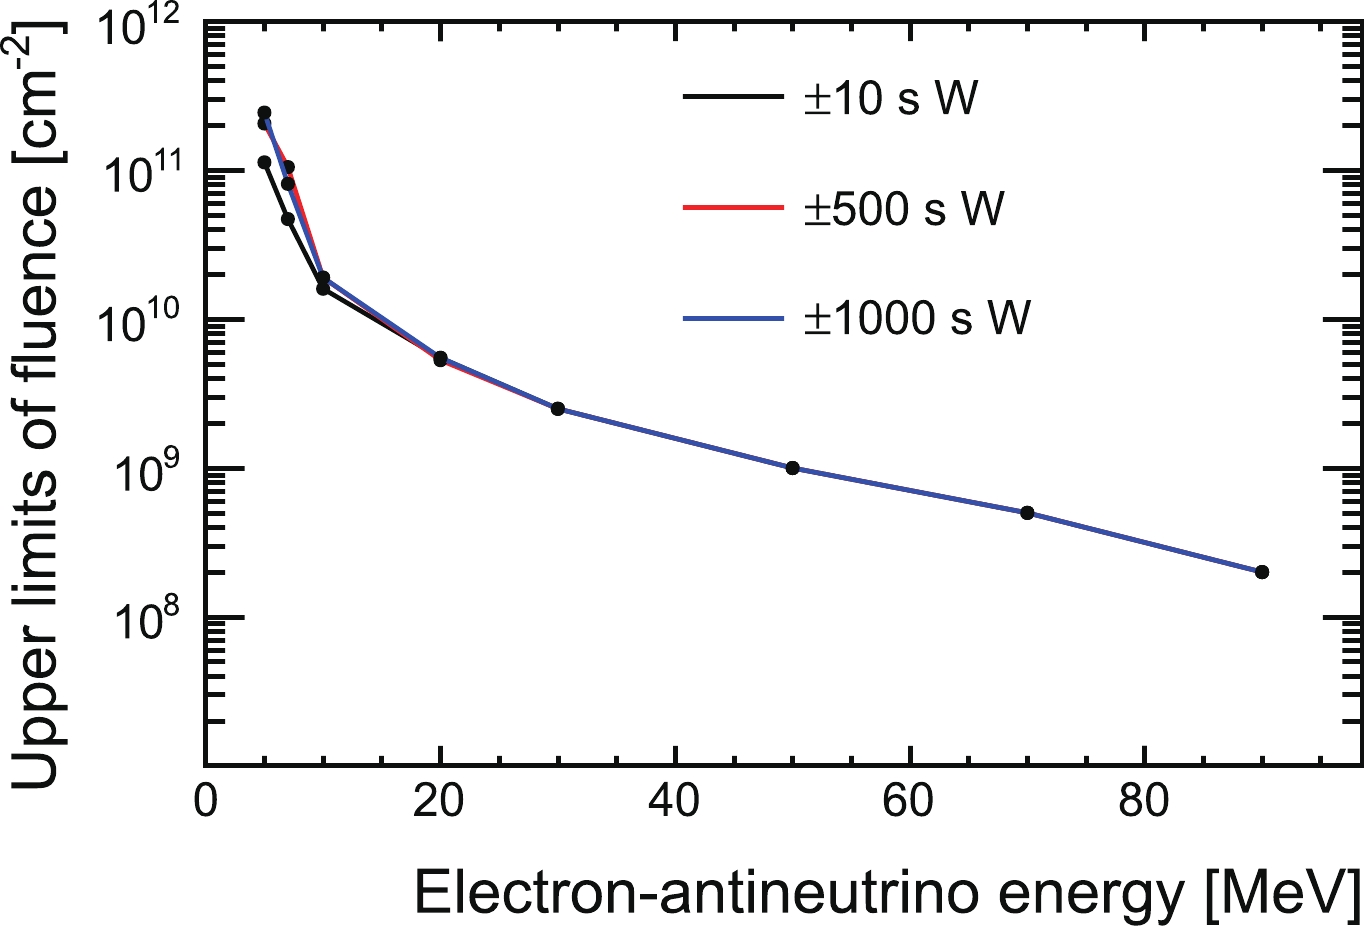
The upper limits (90% C.L.) of the fluence based on the Fermi-Dirac spectrum assumption for the searching time window of
$ \pm $ 500 s are shown in Table 8 for each GW event. The remaining results are compiled in Table 9 and Fig. 5, which show typical$ \bar{\nu}_e $ fluences that are estimated using the average number of candidates and background. For$ E_\nu \geqslant 30 $ MeV, the upper limits of the monochromatic spectrum fluence are identical for the three time windows, because the number of candidates and backgrounds are both close to null. The other variations are consistent with the expected efficiency changes and statistical fluctuations. Given that multiple ADs are used at Daya Bay, the background within a single AD has almost no impact on the other ADs; hence, a gain in sensitivity is observed [49]. The sensitivity is comparable to that of the KamLAND experiment [26].GW event $\Phi_{\rm{FD}}$ 

$/(\times 10^{10}\;{\rm{c}}{{\rm{m}}^{{\rm{ - 2}}}})$ 

$L_{\rm{GW}}$ /(

$\times 10^{60}$ erg)

GW150914 0.30 1.23 GW151012 0.79 23.3 GW151226 0.82 3.86 GW170104 0.97 18.3 GW170608 0.42 1.18 GW170814 0.73 5.18 GW170817 0.85 0.03 Table 8. Upper limit (90% C.L.) of the
$ \bar{\nu}_e $ fluence and luminosity, assuming a Fermi-Dirac spectrum within a search time window of$ \pm 500 $ s.fluence/( $\times 10^{10}\;{{\rm{cm}}^{-2}} $ )

monochromatic spectra Fermi-Dirac spectrum $E_\nu$ /MeV

5 7 10 20 30 50 70 90 (1.8, 100) $\pm 10$ s

11.3 4.7 1.6 0.55 0.25 0.10 0.05 0.02 0.70 $\pm 500$ s

20.6 10.5 1.9 0.53 0.25 0.10 0.05 0.02 0.63 $\pm 1000$ s

24.4 8.1 1.9 0.55 0.25 0.10 0.05 0.02 0.54 Table 9. Upper limits (90% C.L.) for three search time windows. The results are estimated using the average number of candidates and backgrounds of the GW candidates.
-
The upper limits of the fluence can be converted into limits of the total energy radiated in the form of
$ \bar{\nu}_e $ for the mergers. Based on the assumption that the Fermi-Dirac spectrum is in the energy range 1.8 - 100 MeV and the$ \bar{\nu}_e $ emanating from the source is isotropic, the total luminosity can be expressed as$ L_{\rm{GW}} = \Phi_{\rm{FD}} \times 4 \pi D_{\rm{LIGO}}^2 \times \langle E_{\nu}\rangle, $

(12) where
$ \langle E_{\nu}\rangle $ is the average$ \bar{\nu}_e $ energy of the Fermi-Dirac spectrum (see Section III), and$ D_{\rm{LIGO}} $ is the central value of the distance from the GW source to the Earth, as given in Table 1. The upper limits of the luminosity,$ L_{\rm{GW}} $ , for all of the GW events are listed in Table 8. -
We searched for possible
$ \bar{\nu}_e $ signals with energies of 1.8 to 100 MeV that coincide with GW150914, GW151012, GW151226, GW170104, GW170608, GW170814, and GW170817 by assuming a Fermi-Dirac spectrum and monochromatic spectra. No candidate events above the background were identified for any of the GW events in time windows up to$ \pm1000 $ s. We used a maximum-likelihood fit to determine the 90% C.L. upper limits for the$ \bar{\nu}_e $ fluence, which allowed for a comprehensive search across all of the observed GW events. -
We acknowledge Yellow River Engineering Consulting Co., Ltd., and the China Railway 15th Bureau Group Co., Ltd., for building the underground laboratory. We are grateful for the ongoing cooperation with the China General Nuclear Power Group and the China Light and Power Company.
-
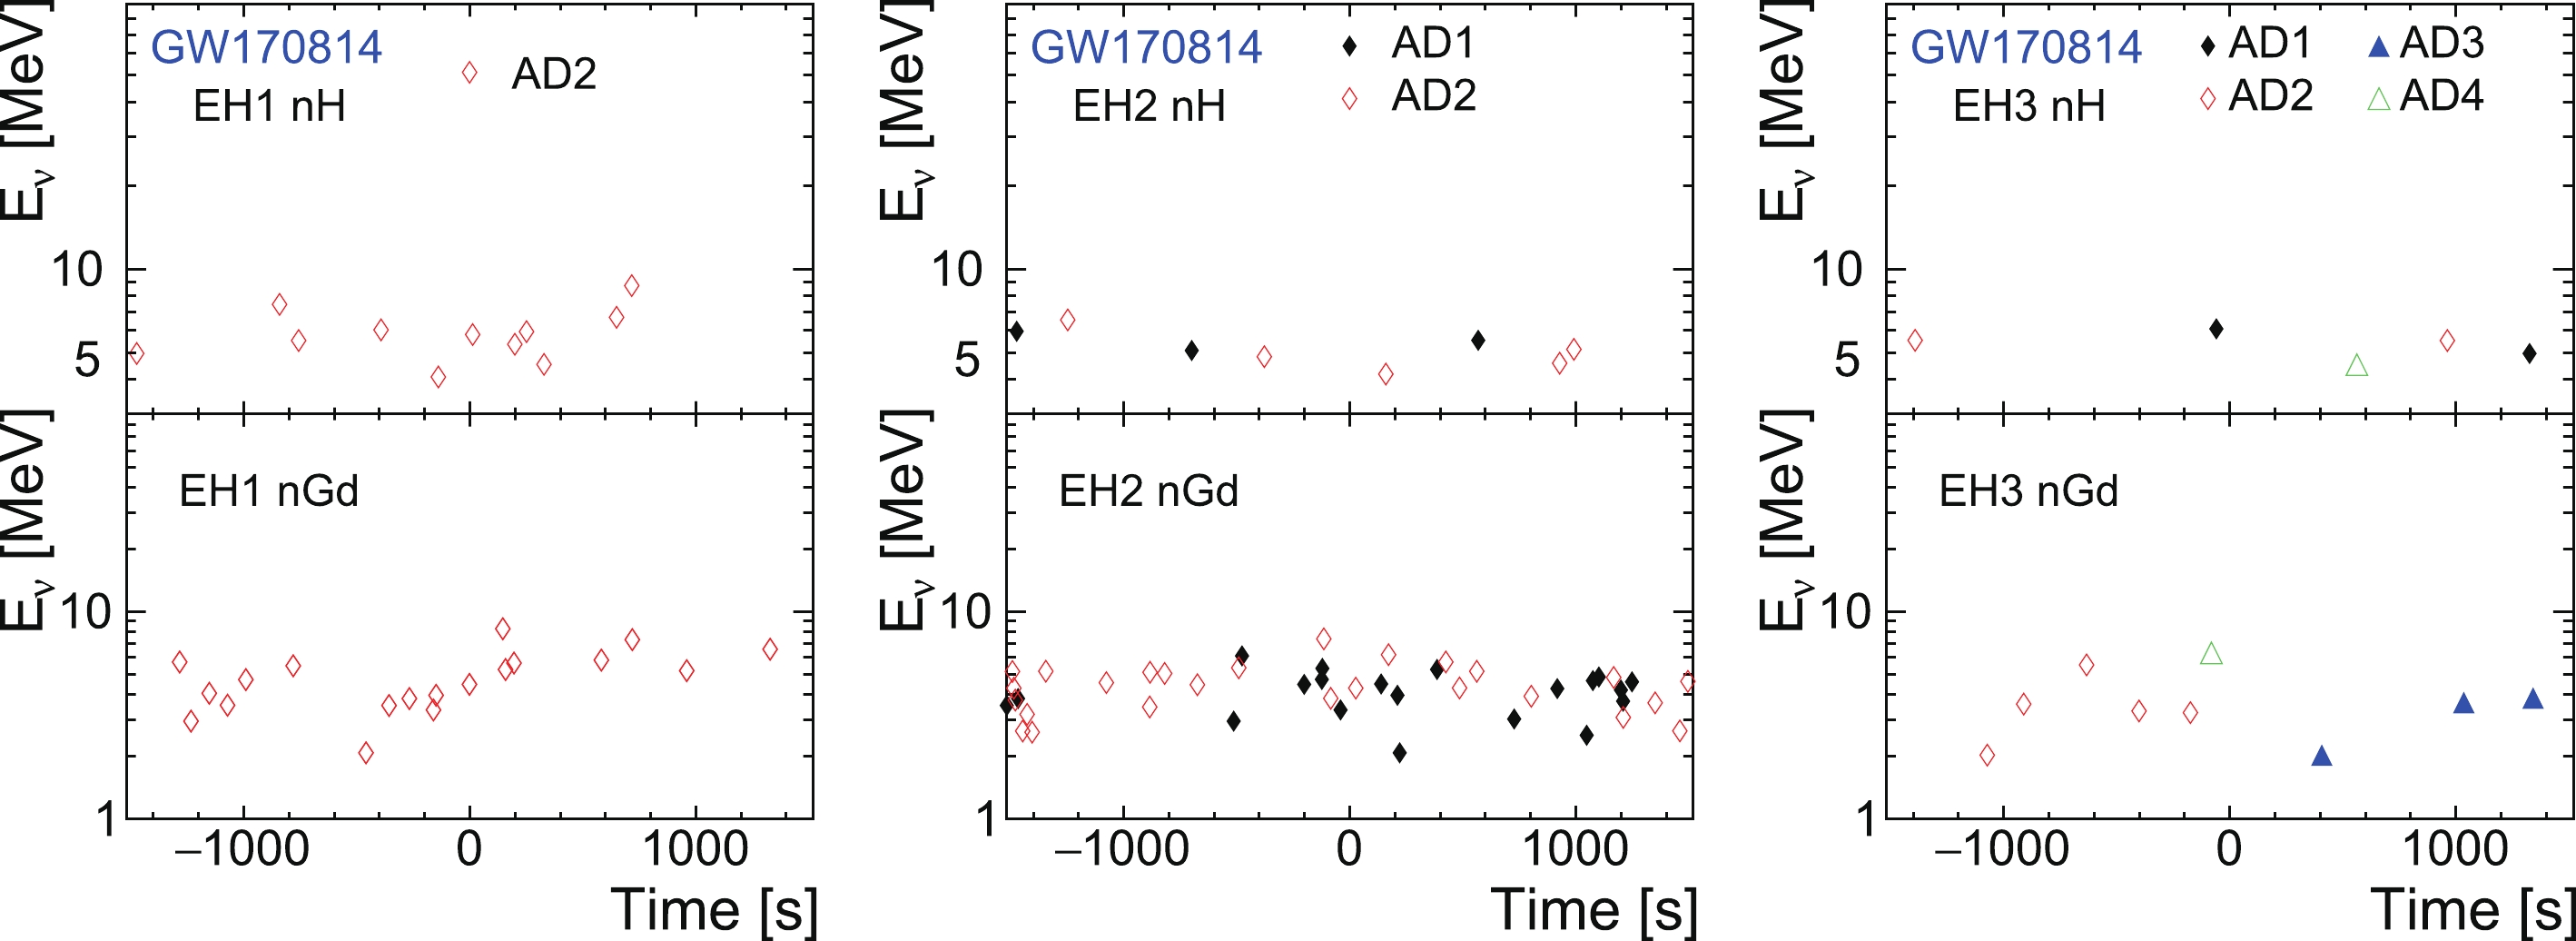
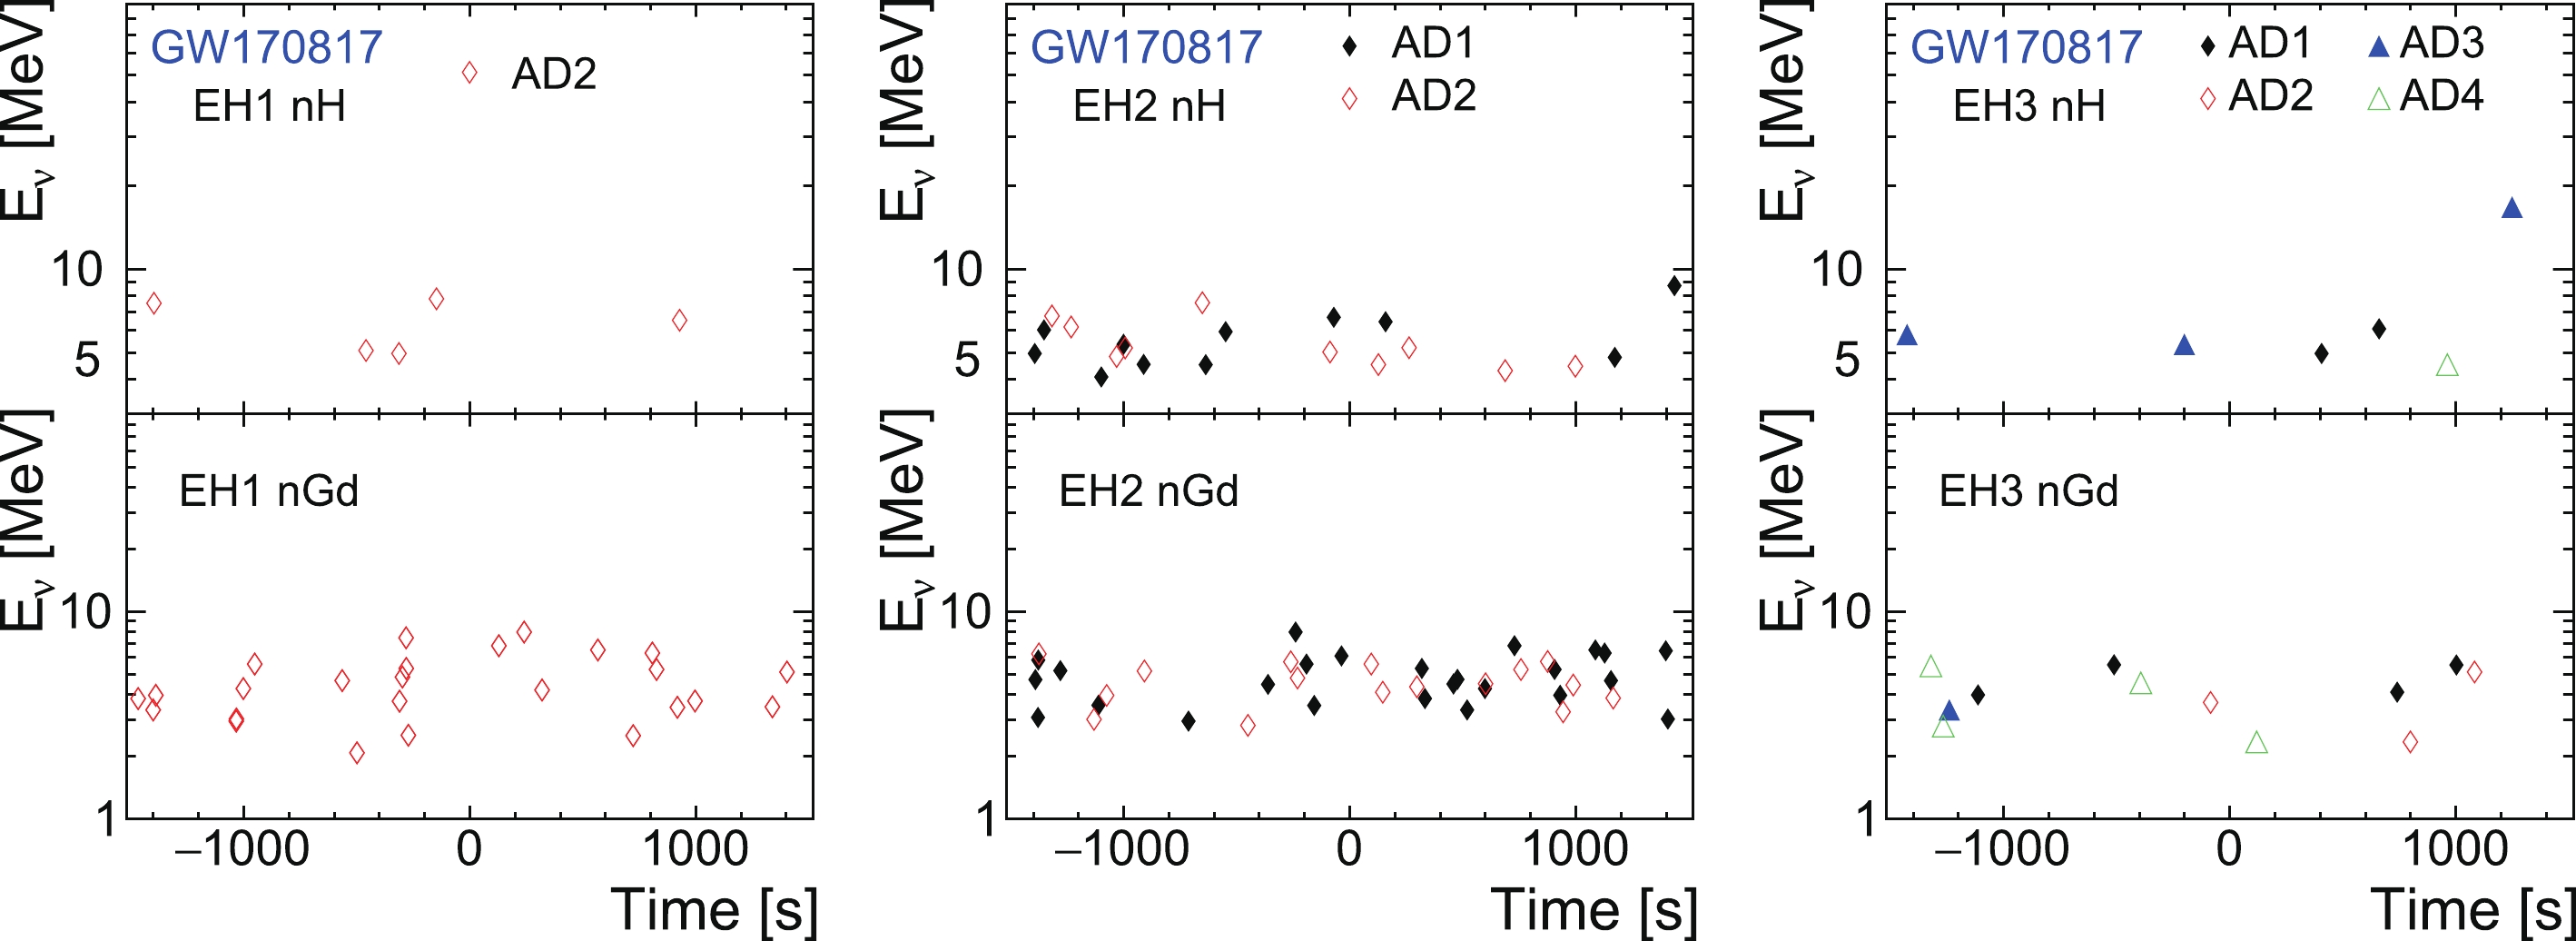
Information regarding the selected neutrino candidates is shown in Figs. 6, 7, 8, 9, 10, 11, and 12, where a two-dimensional plot of the measured neutrino energy
$ vs. $ relative time with respect to the GW observation time is presented for each GW event and each experimental hall. Observations of$ \pm 1500 $ s are shown to reveal both the candidate ($ \pm 10 $ ,$ \pm 500 $ , and$ \pm 1000 $ s) and background ([−1500, −1000 s] and [1000, 1500 s]) situations.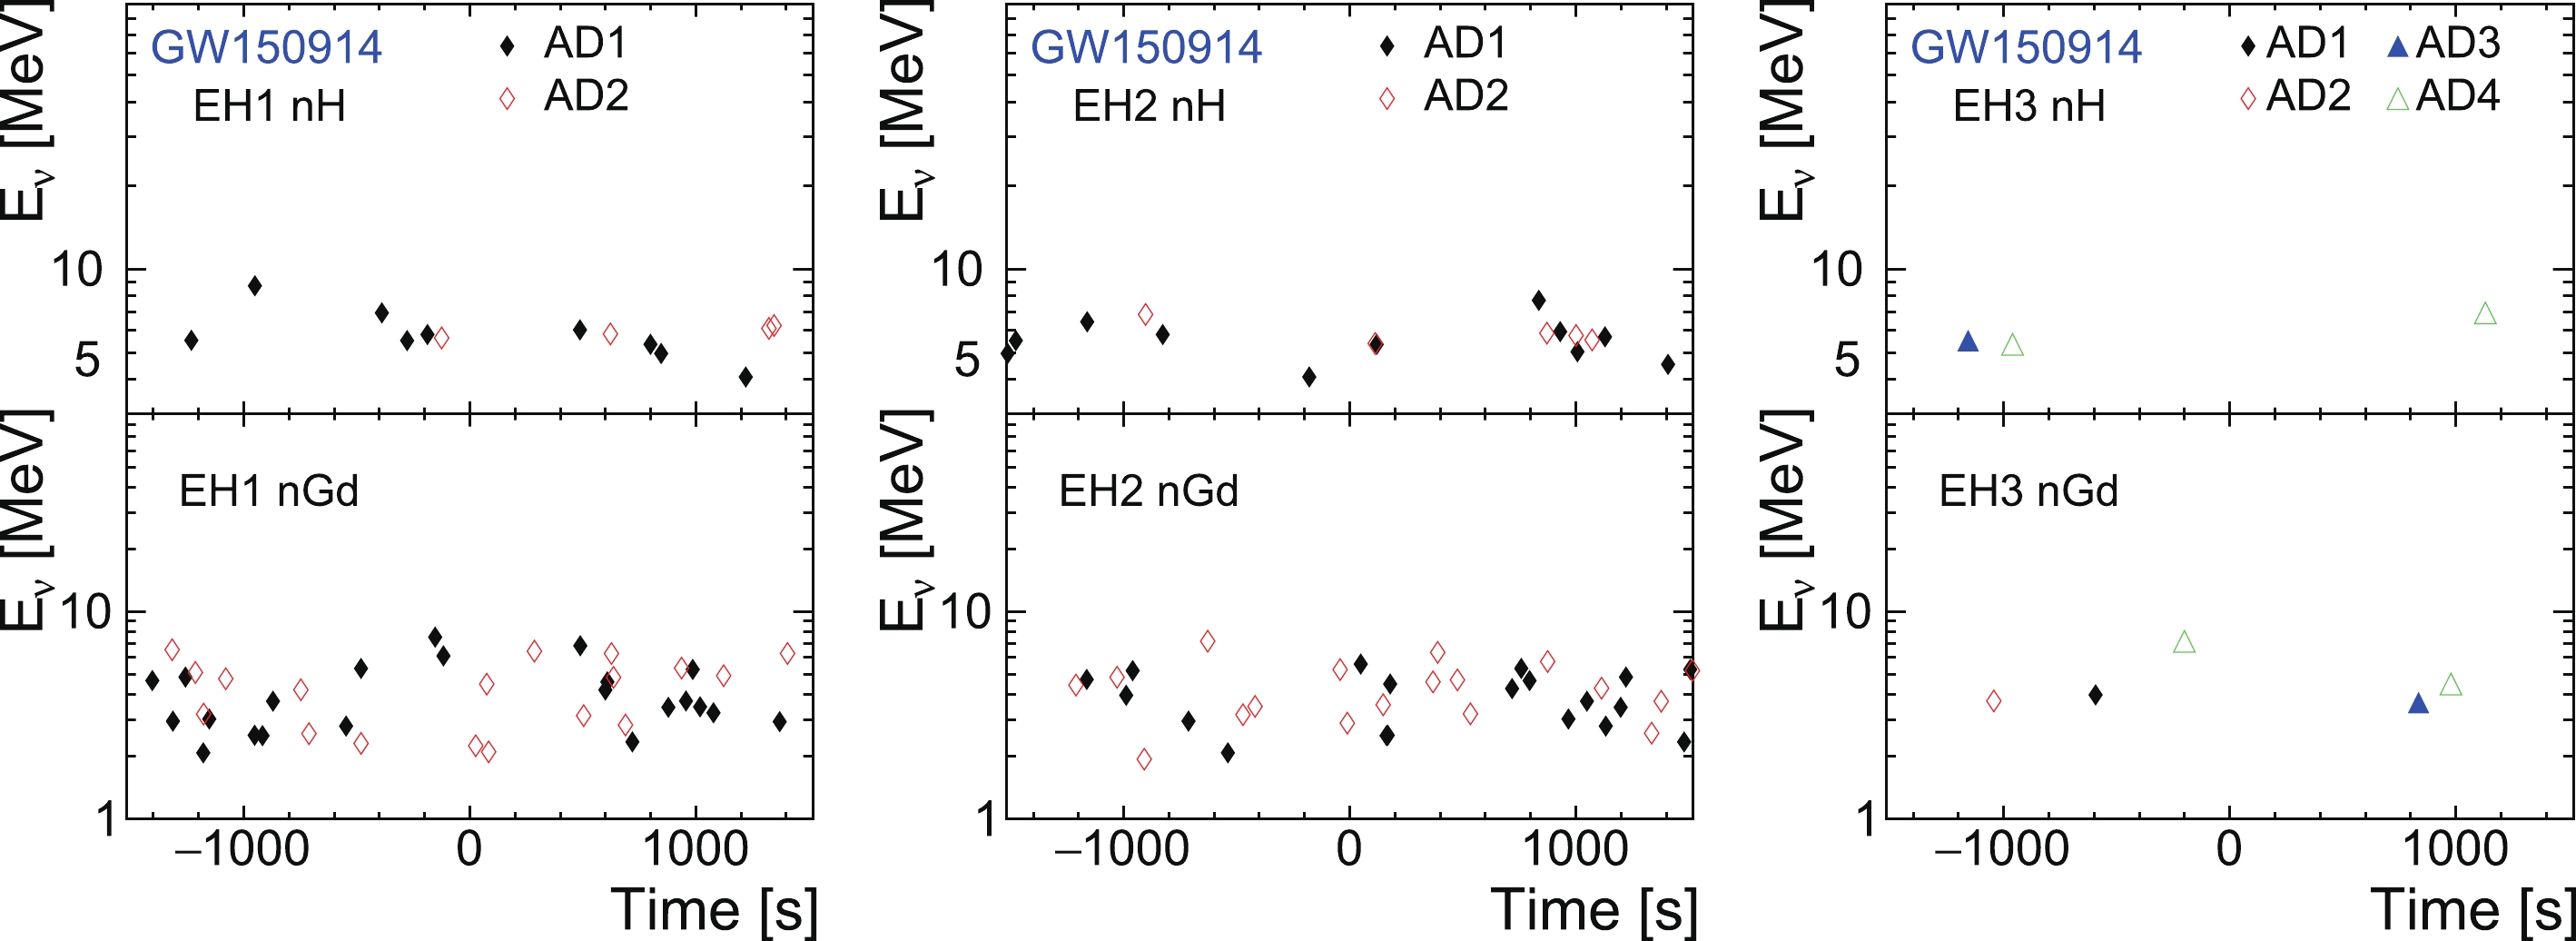
Figure 6. (color online) Neutrino energy and relative time distribution of neutrino candidates for GW150914.
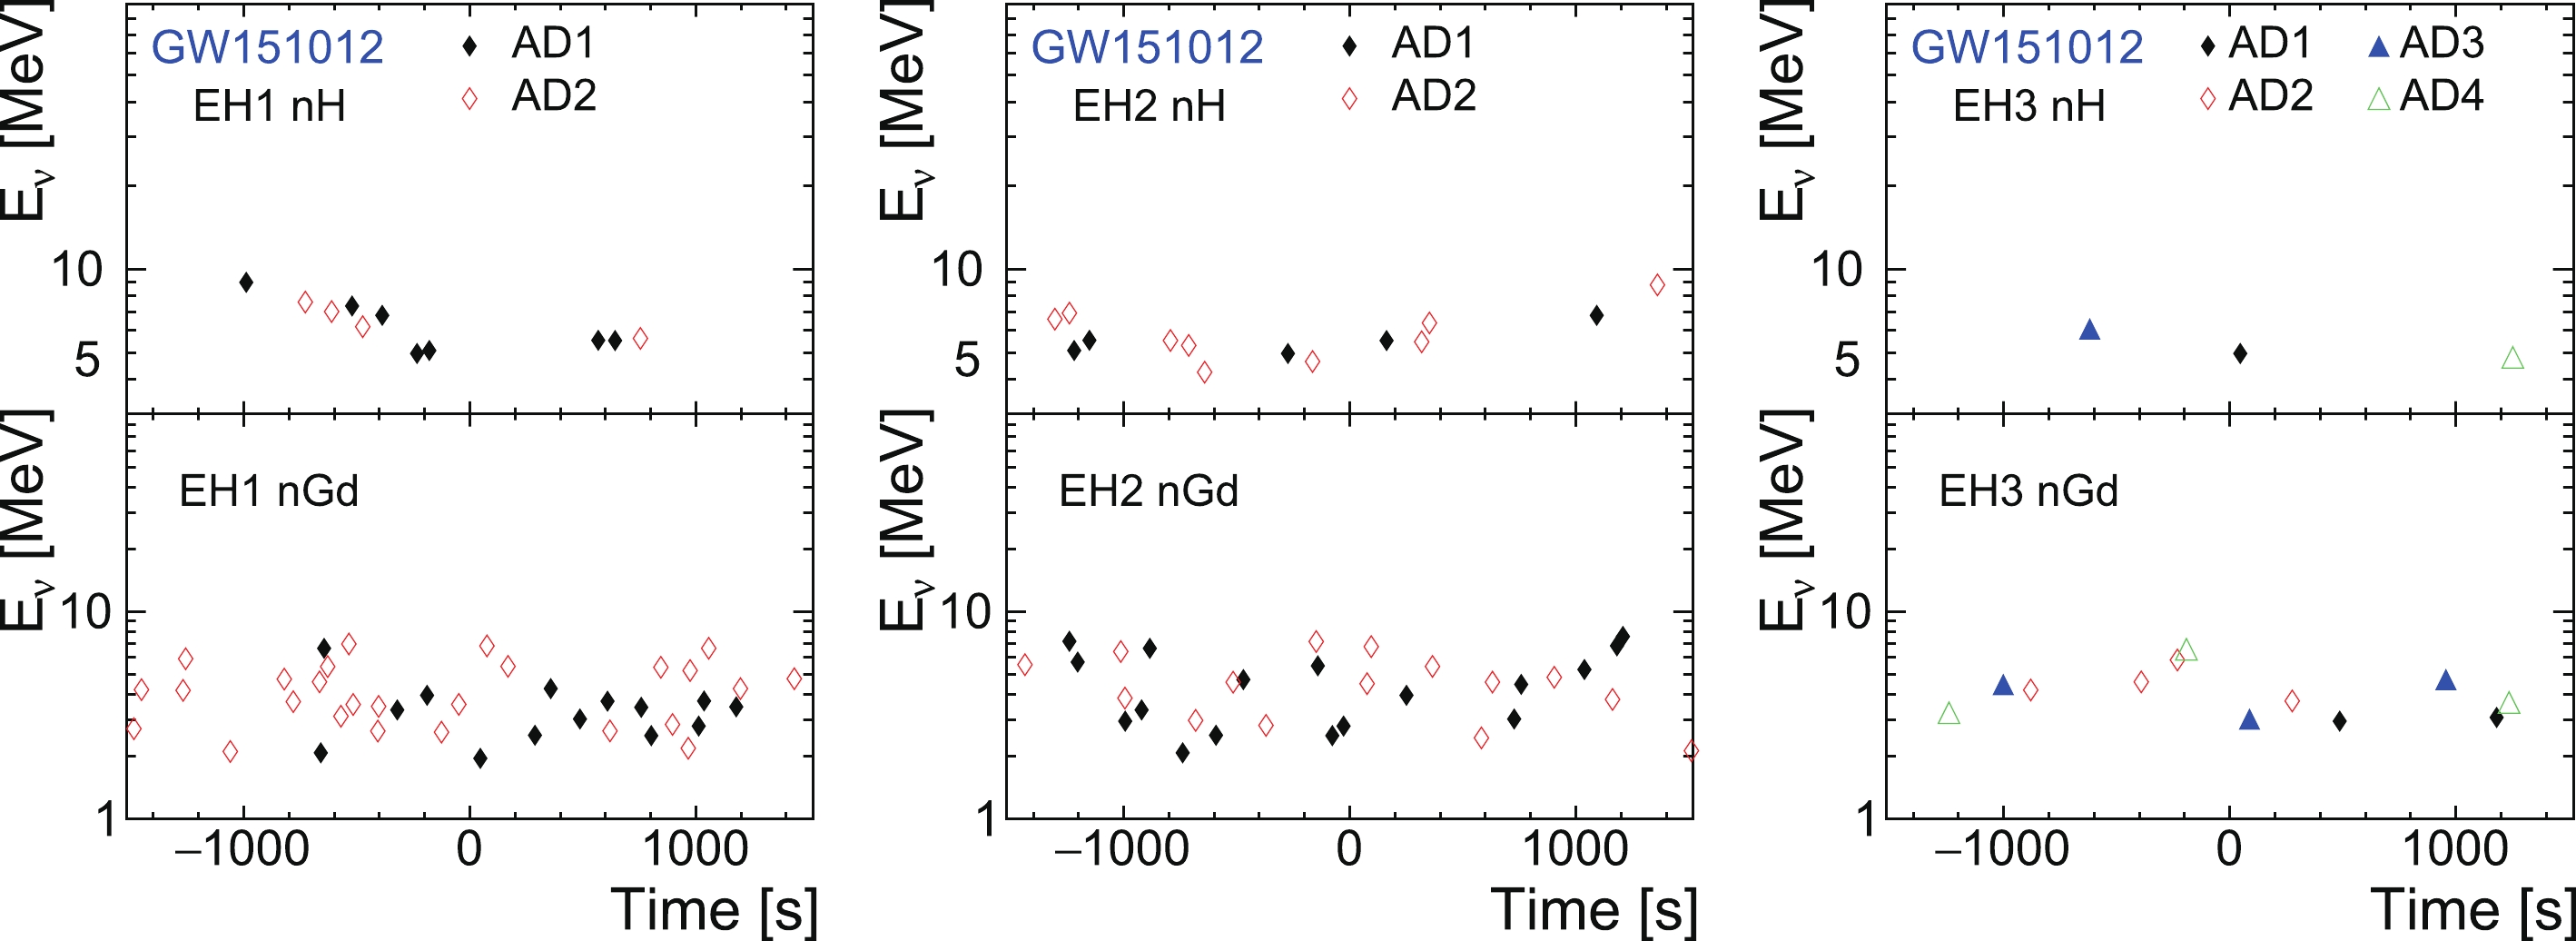
Figure 7. (color online) Neutrino energy and relative time distribution of neutrino candidates for GW151012.
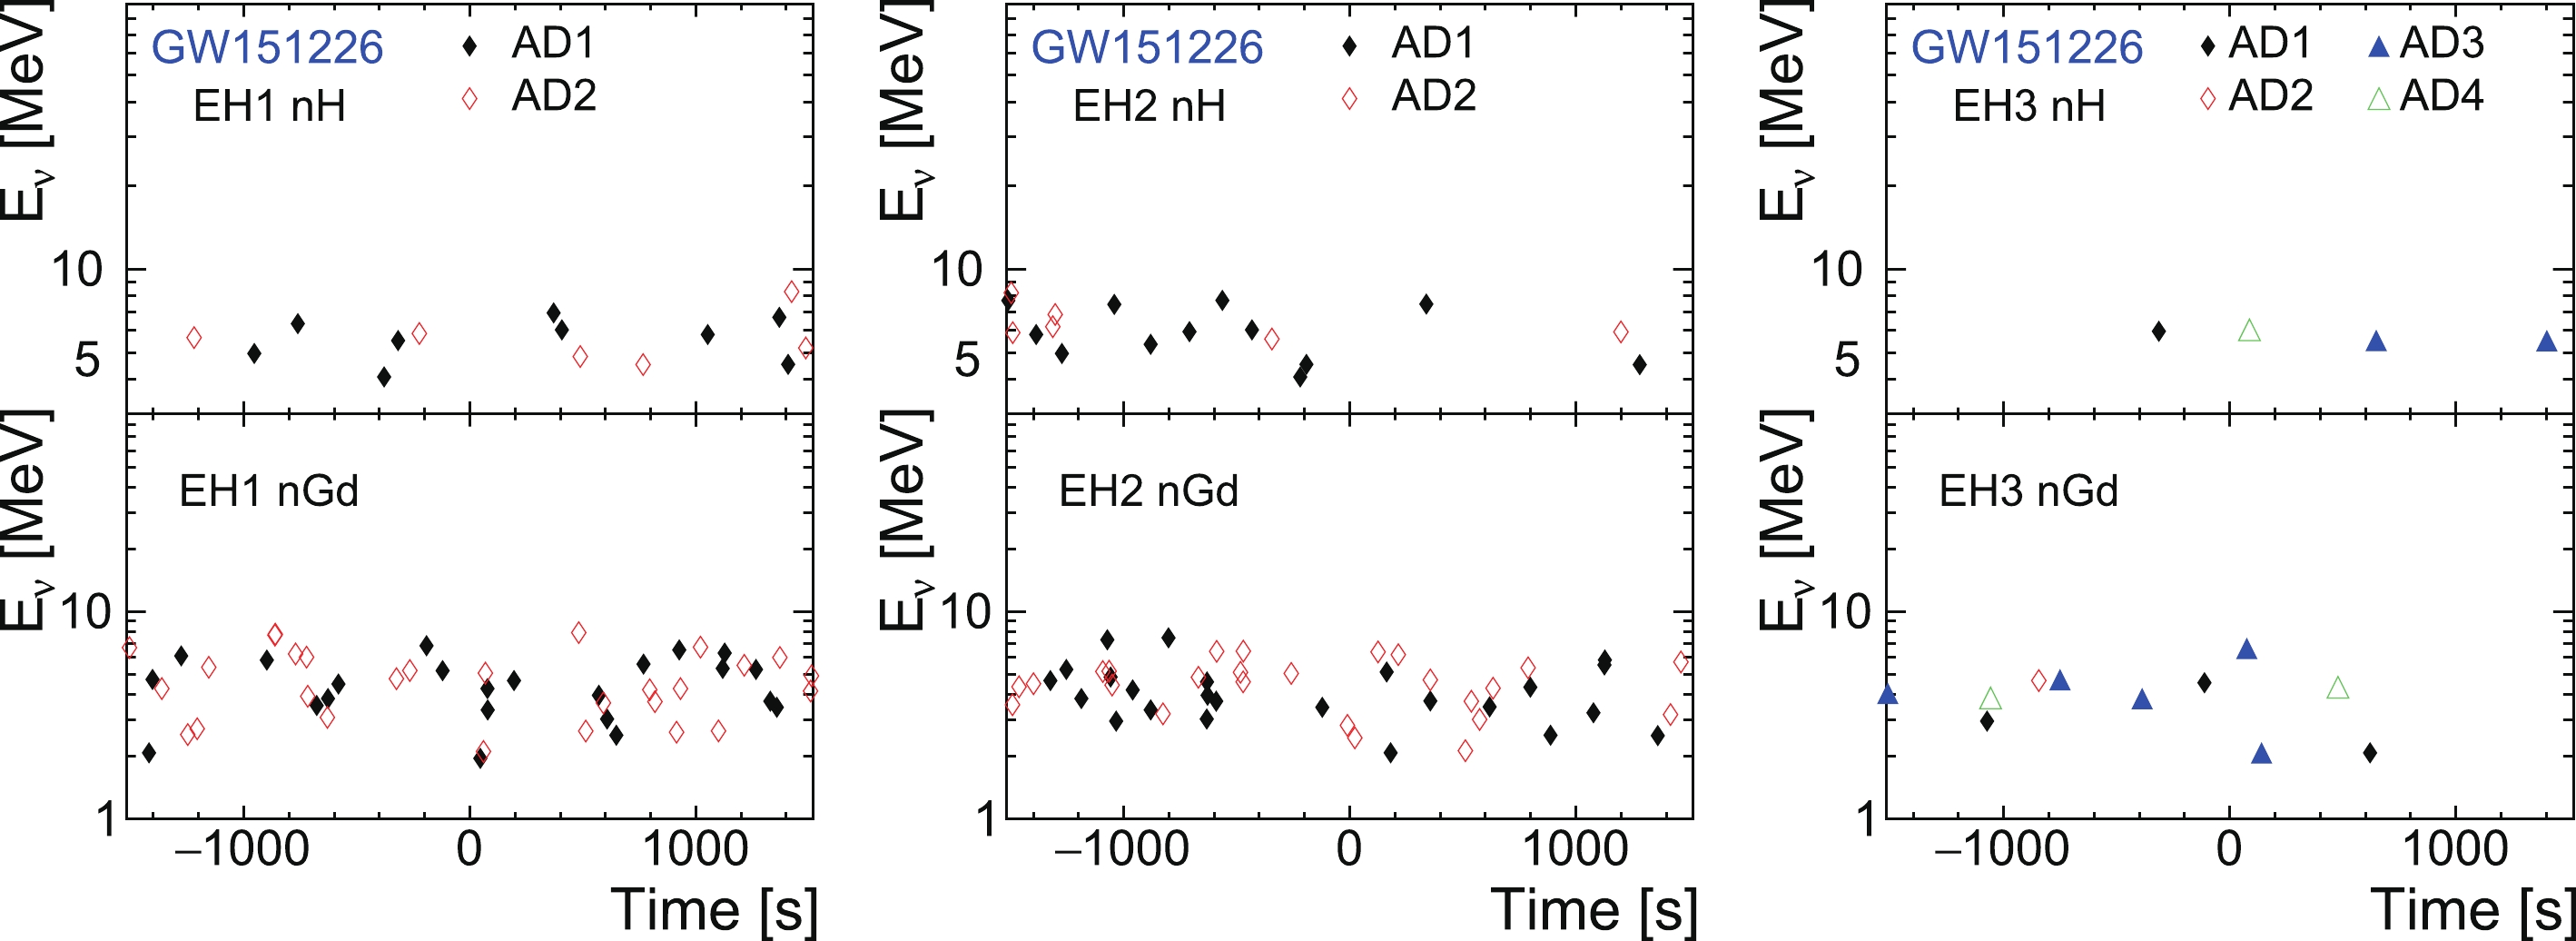
Figure 8. (color online) Neutrino energy and relative time distribution of neutrino candidates for GW151226.
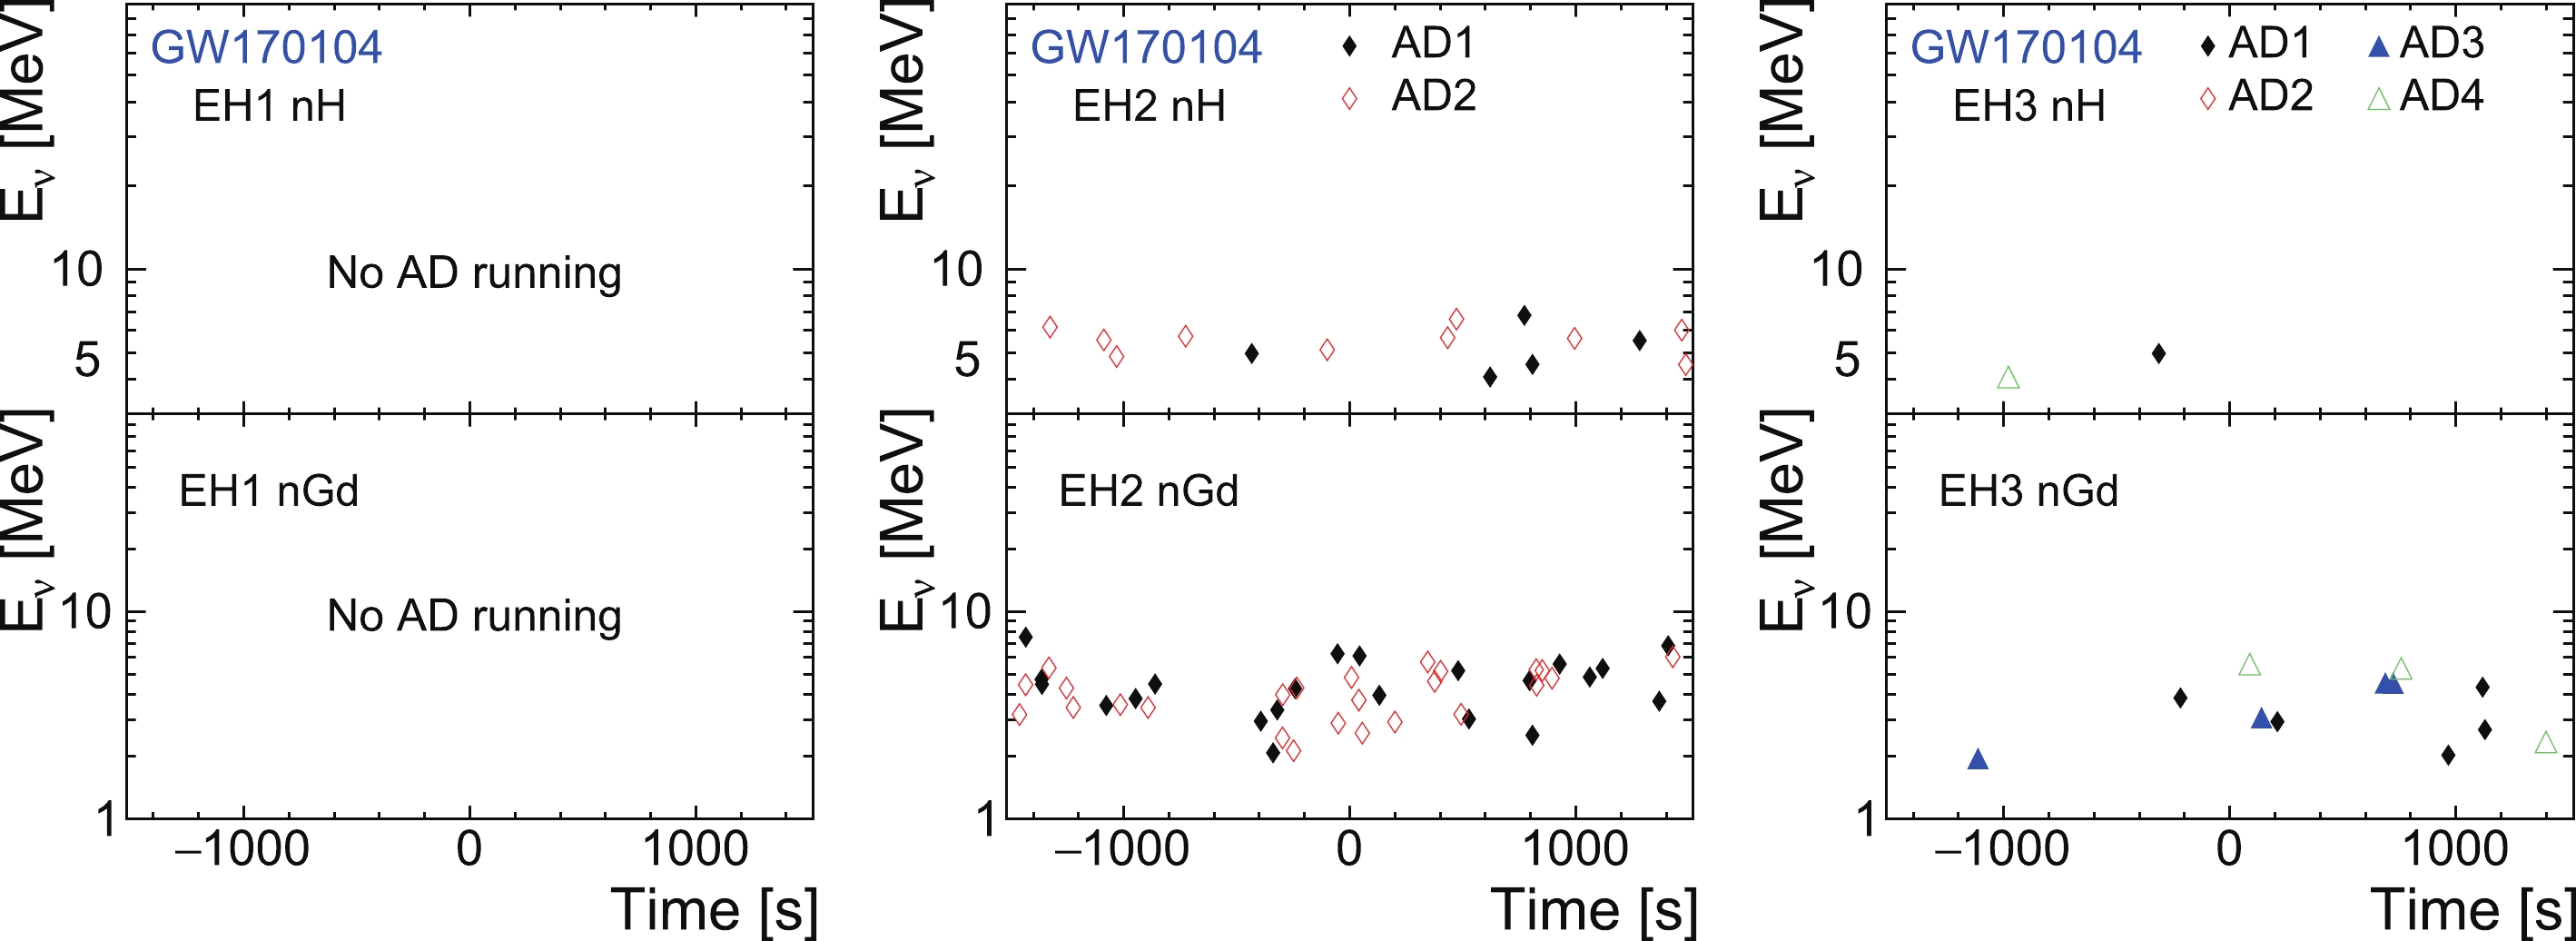
Figure 9. (color online) Neutrino energy and relative time distribution of neutrino candidates for GW170104.

Figure 10. (color online) Neutrino energy and relative time distribution of neutrino candidates for GW170608.
Search for electron-antineutrinos associated with gravitational-wave events GW150914, GW151012, GW151226, GW170104, GW170608, GW170814, and GW170817 at Daya Bay
- Received Date: 2020-06-27
- Available Online: 2021-05-15
Abstract: The establishment of a possible connection between neutrino emission and gravitational-wave (GW) bursts is important to our understanding of the physical processes that occur when black holes or neutron stars merge. In the Daya Bay experiment, using the data collected from December 2011 to August 2017, a search was performed for electron-antineutrino signals that coincided with detected GW events, including GW150914, GW151012, GW151226, GW170104, GW170608, GW170814, and GW170817. We used three time windows of ±10, ±500, and ±1000 s relative to the occurrence of the GW events and a neutrino energy range of 1.8 to 100 MeV to search for correlated neutrino candidates. The detected electron-antineutrino candidates were consistent with the expected background rates for all the three time windows. Assuming monochromatic spectra, we found upper limits (90% confidence level) of the electron-antineutrino fluence of (1.13 − 2.44)×1011 cm−2 at 5 MeV to 8.0×107 cm−2 at 100 MeV for the three time windows. Under the assumption of a Fermi-Dirac spectrum, the upper limits were found to be (5.4 − 7.0)×109 cm−2 for the three time windows.


 Abstract
 HTML
HTML Reference
 Related
 PDF
PDF





 DownLoad: