-
It is well known that fusion is an essential reaction of two colliding nuclei in addition to scattering, and fusion reactions have been studied for several decades [1]. Many fusion experiments involving weakly bound stable nuclei, such as
$ {^{6, 7}{\rm{Li}}} $ and$ {^{9}{\rm{Be}}} $ , have shown that the complete fusion (CF) cross sections at above-barrier energies are reduced by approximately 30% relative to the cross sections calculated by coupled-channel models and measured for comparable well-bound nuclear systems [2-9]. The CF suppression induced by weakly bound nuclei at above-barrier energies has been a key concept to be elucidated in fusion dynamics for several decades [10].The observed CF suppression has been widely associated with the appearance of the incomplete fusion products [7-9]. Owing to the low breakup threshold of weakly bound nuclei, parts of the breakup fragments are absorbed by the target-like nuclei to produce incomplete fusion products. This suggests that the CF suppression is caused by the breakup of weakly bound nuclei [3, 4]. The breakup mechanism of weakly bound nuclei has been determined simply through the coincidence measurements of breakup fragments performed at sub-barrier energies in several experiments [10-15]. These studies discovered the competition of different breakup channels, such as neutron-transfer breakup, proton-transfer breakup, and direct breakup. The relationships between sub-barrier breakup probabilities and the CF suppression at above-barrier energies were established. A three-dimensional classical trajectory model called PLATYPUS [12-16] was used in these studies. It was pointed out that the time-scales of the breakup mechanisms are important and that a projectile-like nucleus with a longer lifetime than the collision time-scales (
$ \sim 10^{-21} {\rm{s}} $ ) has no suppression effect on the CF [10-15]. Several studies have investigated the breakup mechanism and identified the prompt breakup process, which is sufficiently fast to affect the fusion, through coincidence measurements of the breakup fragments at sub-barrier energies [10, 12-15]. In addition, the relative probabilities for prompt sub-barrier breakup processes in a weakly bound nuclear system were obtained [13].To further investigate the breakup mechanism in reactions of weakly bound nuclei, in this paper, the coincidence measurements of breakup fragments in the reactions of
$ {^{6, 7}{\rm{Li}}} $ with$ {^{209}{\rm{Bi}}} $ at energies around and above the Coulomb barrier are described. This paper is organized as follows. The experimental details are described in Sec. II. Identifications of the breakup modes through the reaction Q values and the relative energy$ E_{\rm{rel}} $ of the breakup fragments are presented in Sec. III. The relative probabilities for the breakup processes at energies around and above the Coulomb barrier in$ {^{6, 7}{\rm{Li}}} $ +$ {^{209}{\rm{Bi}}} $ reactions are presented in Sec. IV. Finally, some concluding remarks are provided in Sec. V. -
The experiments were conducted using
$ {^{6, 7}{\rm{Li}}} $ beams provided by the HI-13 tandem accelerator at the China Institute of Atomic Energy (CIAE). The beams impinged a self-hold$ {^{209}{\rm{Bi}}} $ target with a thickness of 210$\mu$ g/cm$ ^{2} $ , and the target was tilted by 70$ ^{\circ} $ relative to the beam line to avoid a blind area on the detectors caused by the target frame. The beam energies$ E_{\rm{beam}} $ are listed in Table 1, together with the center-of-mass barrier energies$ V_{\rm{B}} $ for the two systems measured in a previous experiment [17].Beam $E_{\rm{beam}}$ /MeV

$E_{\rm{c.m.}}$ /MeV

$V_{\rm{B}}$ /MeV

$E_{\rm{c.m.}}$ /

$V_{\rm{B}}$ 

$^{6}$ Li

30.0 29.11 30.10a 0.97 40.0 38.84 1.29 47.0 45.65 1.52 $^{7}$ Li

30.0 28.96 29.70a 0.98 40.0 38.65 1.30 47.0 45.43 1.53 a The measured barrier energies from Ref. [17]. Table 1. Beam energies at which measurements were performed for the reactions of
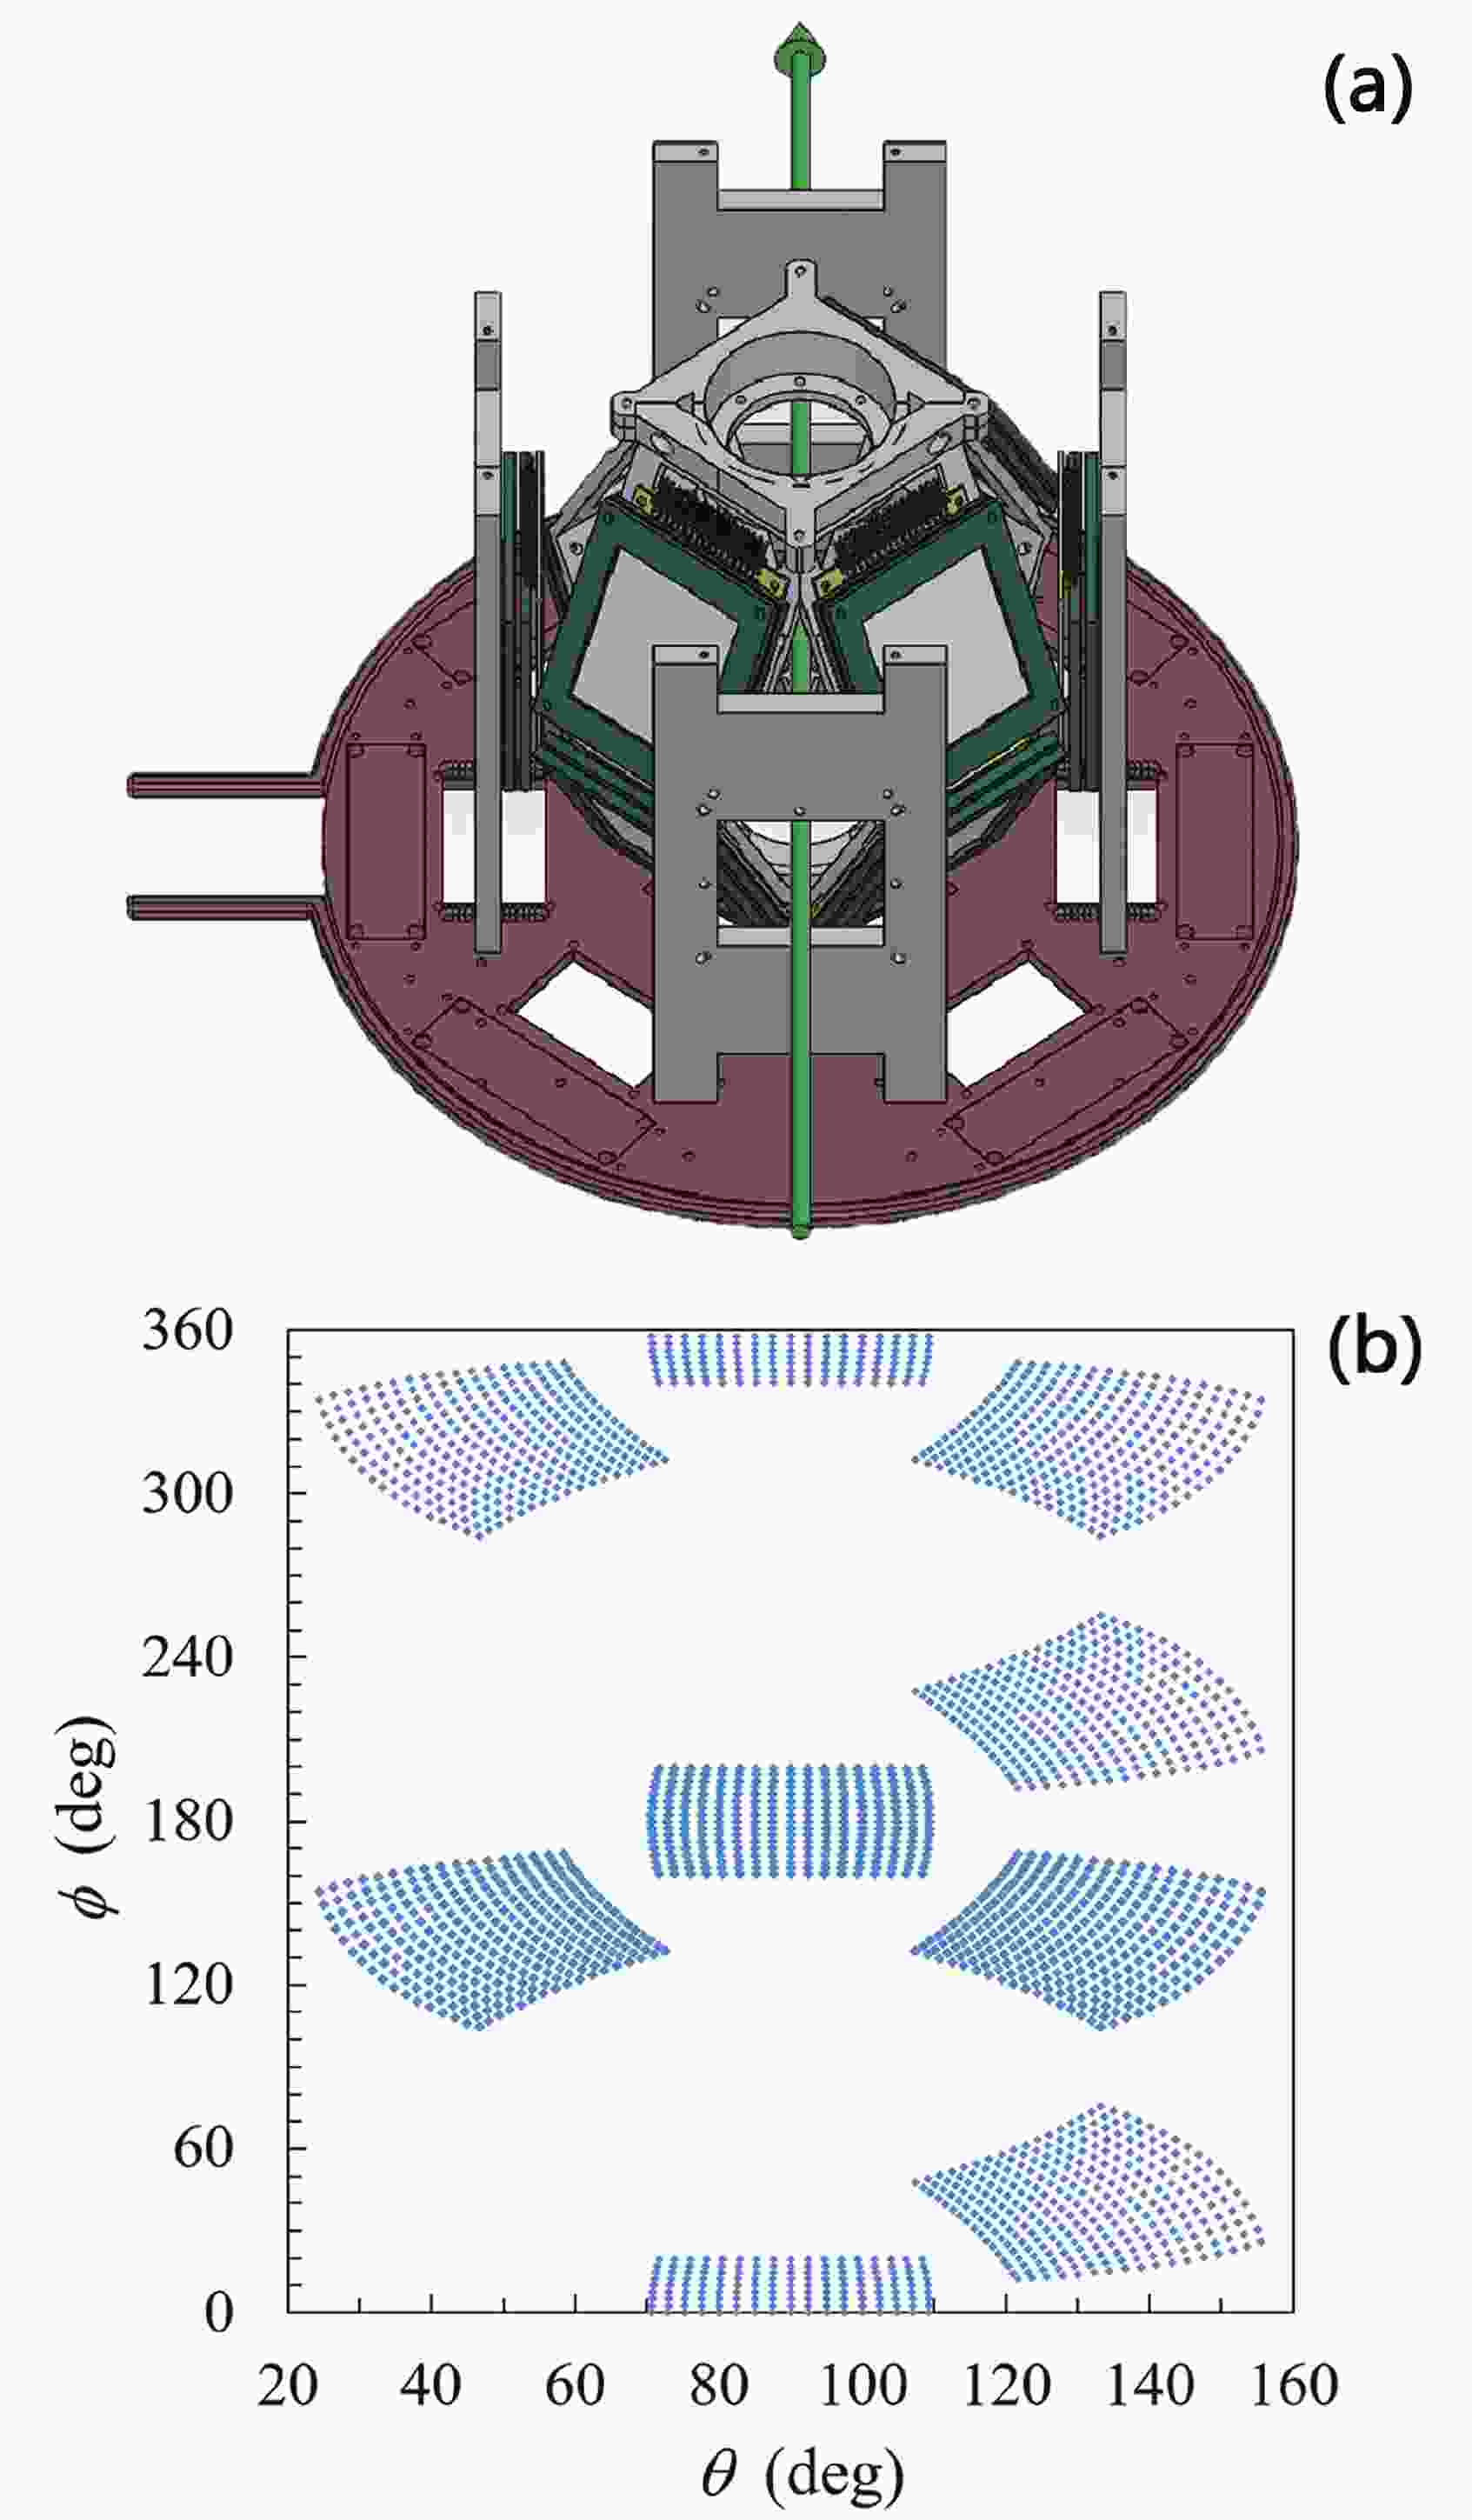
${^{6, 7}{\rm{Li}}}$ with${^{209}{\rm{Bi}}}$ .$E_{\rm{c.m.}}$ is the center-of-mass energy of the system and is calculated with consideration of the energy loss in the target.The position and energy of the charged breakup fragments in the reactions were measured using a large solid-angle covered detector array designed at CIAE [18], as shown in Fig. 1(a). The array consists of eight
$ {\Delta}E $ -E detector telescopes surrounding the target, allowing the identification of charged particles. Each$ {\Delta}E $ detector was a double-sided silicon strip detector (DSSD) with a thickness of 40$\mu$ m for backward angles and 60$\mu$ m for forward angles. The remaining detectors for each telescope were quadrant silicon detectors (QSDs) with a thickness of 1000$\mu$ m. When the energy loss of high energy light particles in the DSSD was too low, a QSD with a thickness of 300$\mu$ m was inserted between the DSSD and the 1000$\mu$ m thick QSD at forward angles. The DSSDs were divided into 16 strips for each side, which have a total active area of 50$ \times $ 50 mm$ ^{2} $ , constituting 256 pixels of 3$ \times $ 3 mm$ ^{2} $ each. In addition, the QSDs were divided into four squares, each of which has an active area of 24$ \times $ 24 mm$ ^{2} $ . A mylar foil with a thickness of 0.5$\mu$ m was installed in front of each telescope to protect the DSSD from being hit by low energy electrons.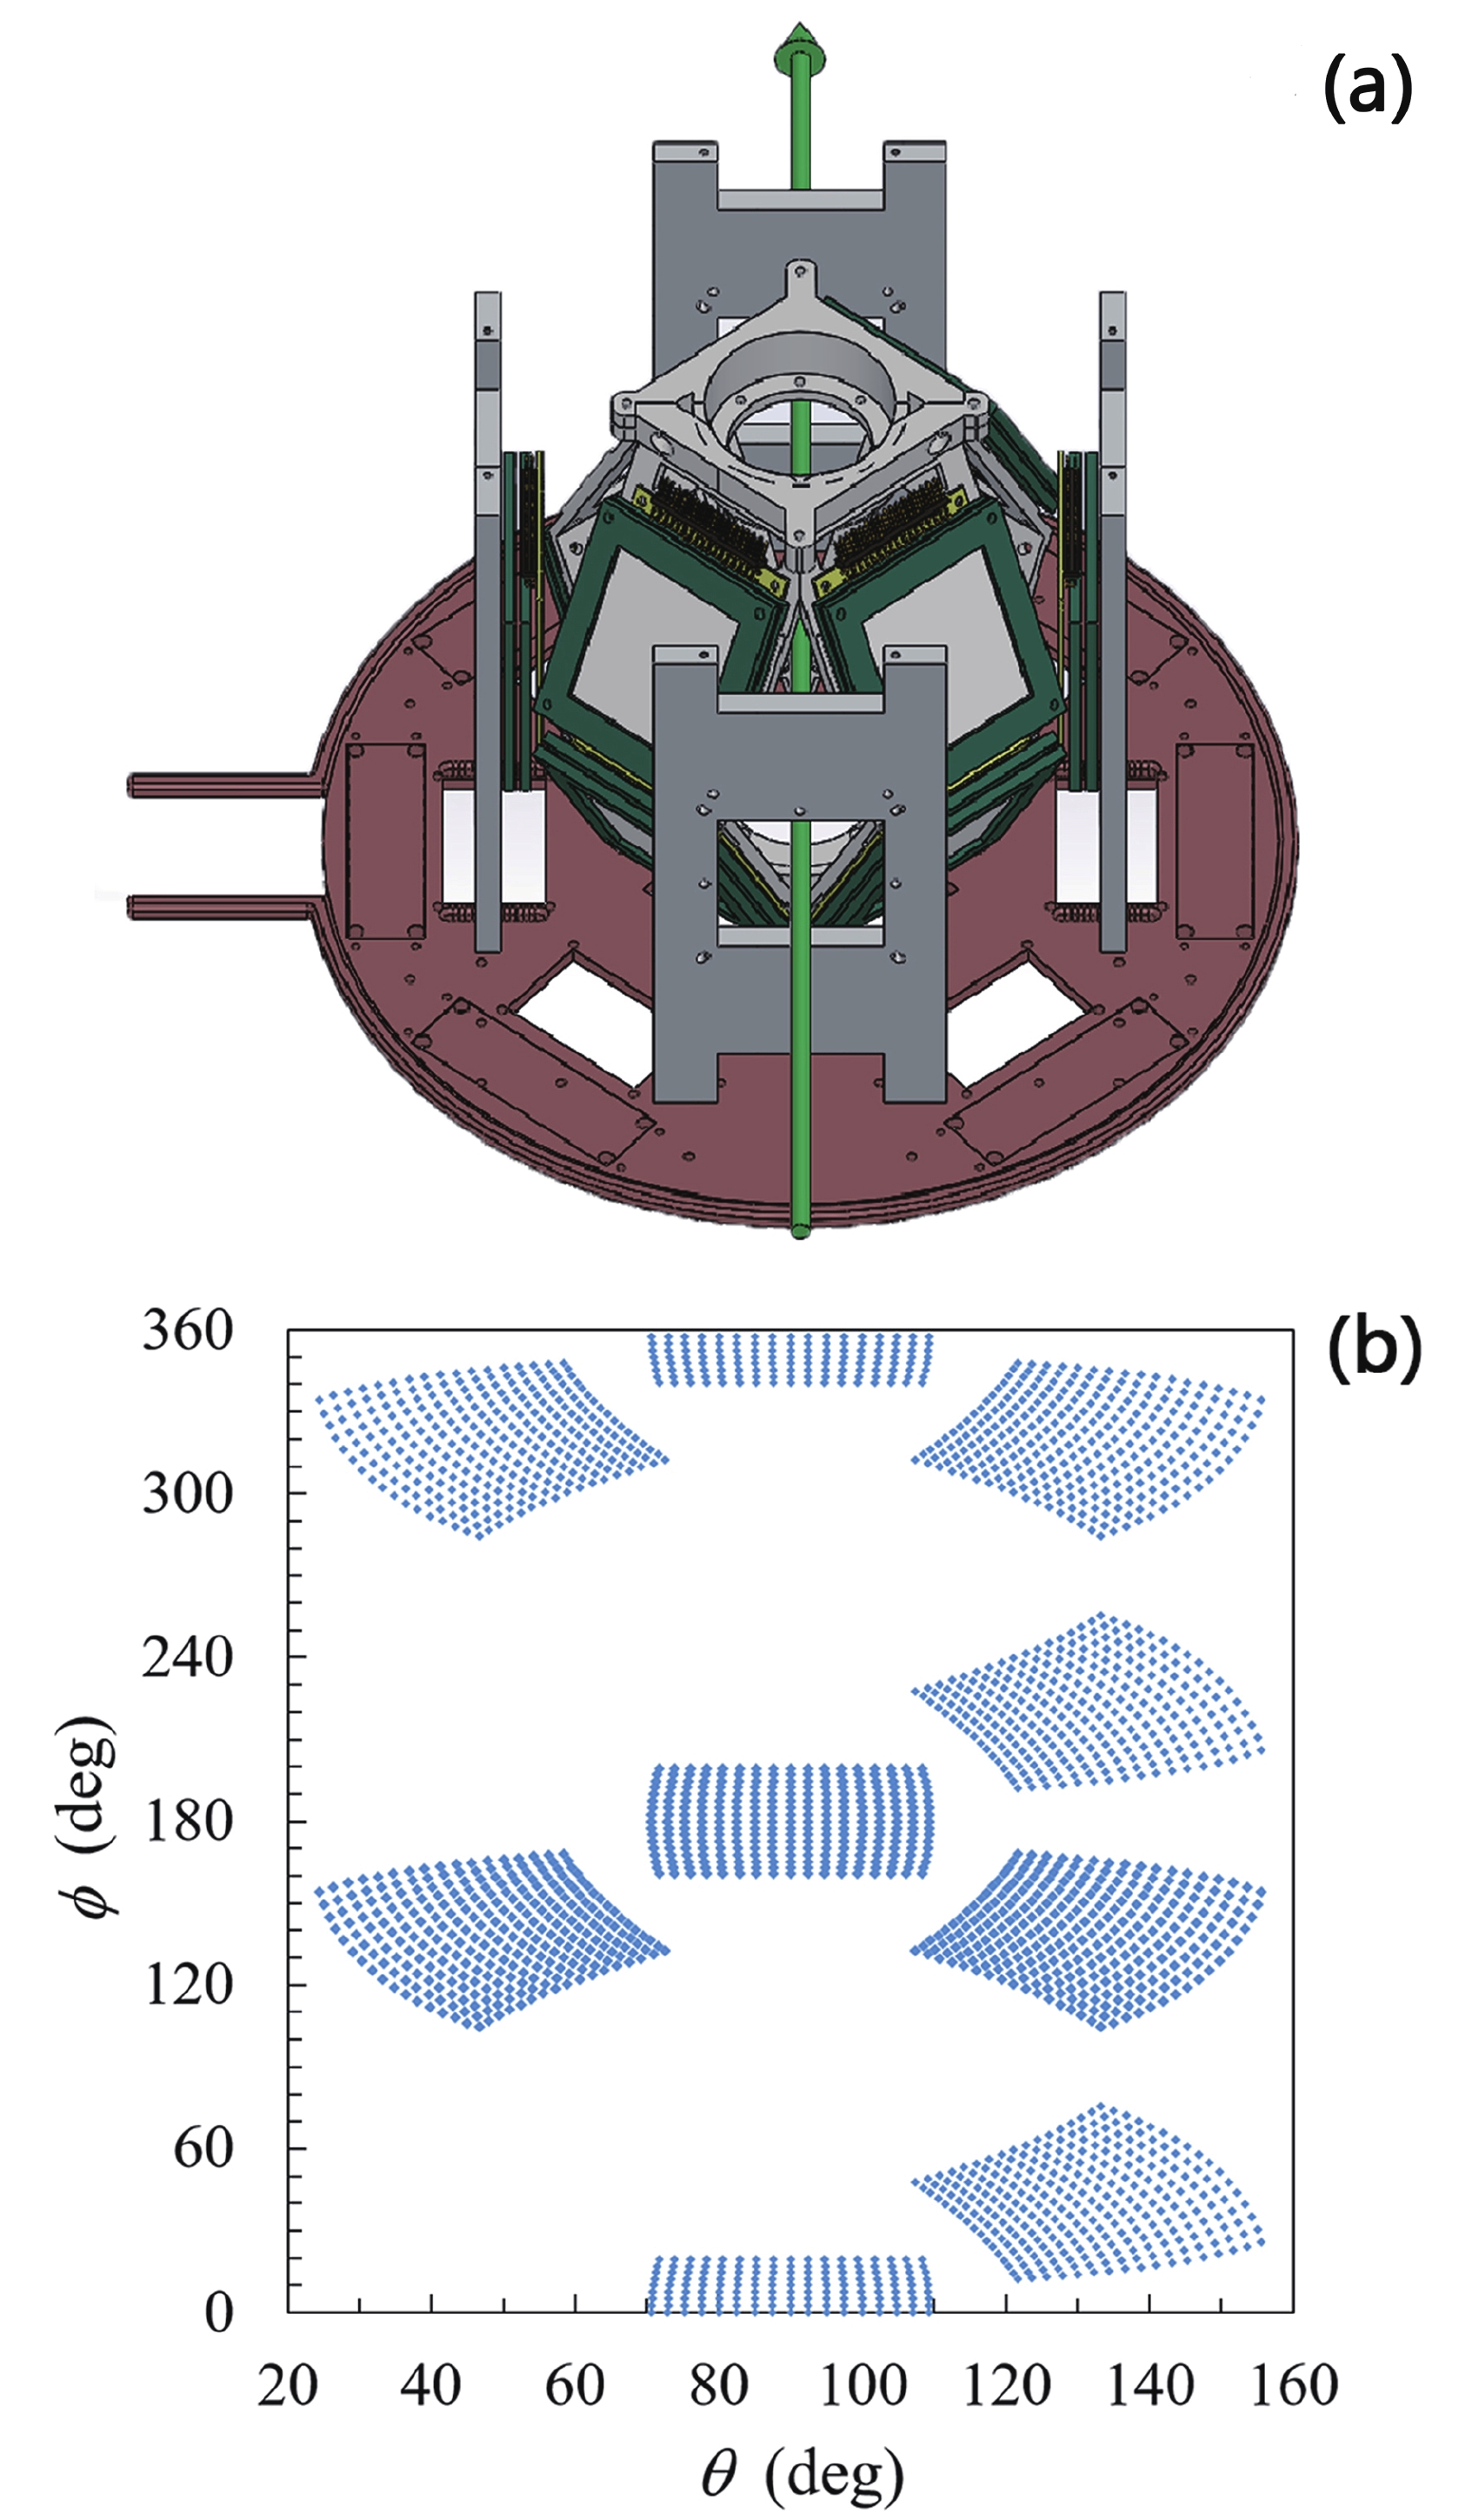
Figure 1. (color online) (a) The arrangement of silicon detector array. The arrow indicates the beam direction. The rectangle signs on the brass disk are the positions where the integrated preamplifiers [19] were installed. The array was cooled by the circulation of alcohol inside the brass disk. (b) Angular coverage of detector array. The array covers the scattering angle
$\theta$ from$ 24.31^{\circ}$ to$ 155.69^{\circ}$ and$ 301^{\circ}$ in azimuthal angle$ \phi$ . The pixel separation in each detector is exaggerated for clarity.Figure 1(b) shows the angular coverage of the array. The eight telescopes covered a scattering angle (
$ \theta $ ) of 24° to 156° and spanned 301° in azimuthal angle ($ \phi $ ), occupying 26.8% of the$ 4\pi $ solid angles. Thus, the array is sensitive to all breakup modes. As shown in the experiments and theoretical calculations [20-22], the reaction products associated with a breakup, such as$ \alpha $ particles, show peaks at backward angles at sub-barrier energies, and the peaks move to forward angles when the reaction energy increases. Therefore, the arrangement of the array was beneficial to the study of the breakup mechanism in the reaction of$ {^{6, 7}{\rm{Li}}} $ with$ {^{209}{\rm{Bi}}} $ at energies around and above the Coulomb barrier. Four silicon detectors were installed at a distance of 250 mm from the center of the target for beam monitoring. Two monitors with a diameter of 0.5 mm were mounted at ±12.5$ ^{\circ} $ in the horizontal plane, whereas two other monitors with a radius of 0.5 mm were installed at ±25$ ^{\circ} $ in the vertical plane, respectively.The position identification characteristics of the DSSDs does not allow locating the position within a pixel. The angular resolution in the center region of each telescope is approximately ±1.23
$ ^{\circ} $ at least (or ±1.05$ ^{\circ} $ ) and becomes better in the peripheral area of the telescopes within a laboratory frame. To simplify the subsequent event reconstruction, the position within the physical boundaries of the pixel was determined as the center of the pixel.Most breakup modes in reactions of
$ {^{6, 7}{\rm{Li}}} $ with$ {^{209}{\rm{Bi}}} $ involve the production of two charged fragments, such as$ {^{6}{\rm{Li}}} $ $ \to $ $ \alpha $ + d,$ {^{7}{\rm{Li}}} $ $ \to $ $ \alpha $ + t,$ {^{8}{\rm{Be}}} $ $ \to $ $ \alpha $ +$ \alpha $ , and$ {^{5}{\rm{Li}}} $ $ \to $ $ \alpha $ + p. To minimize the data collection rate during breakup measurements, the double-hit mode was selected as the trigger mode, meaning the data were recorded when at least two pixels of the whole detector array were hit by particles. -
The energy calibration of each strip of the DSSDs was performed by utilizing two
$ \alpha $ sources,$ {^{239}{\rm{Pu}}} $ and$ {^{241}{\rm{Am}}} $ with energies of 5.156 and 5.486 MeV, respectively, and the$ \alpha $ particles decayed from the products during the fusion reactions. In addition, the energy calibration for the QSDs was performed based on the deposited energies of charged particles in the QSDs, which were determined by subtracting the measured energy loss in the DSSDs from the expected energy of the particles calculated using LISE++ [23].The typical two-dimensional spectrum of
$ \Delta E $ vs. E obtained from one of the vertical strips at 91$ ^{\circ} $ in the reaction induced by$ {^{7}{\rm{Li}}} $ at$ E_{\rm{beam}} $ = 40 MeV is shown in Fig. 2(a). In the spectrum, the bands corresponding to the different particles with Z = 1 − 3 are identified clearly, and the events involving$ {^{7}{\rm{Li}}} $ are accidental coincidence events.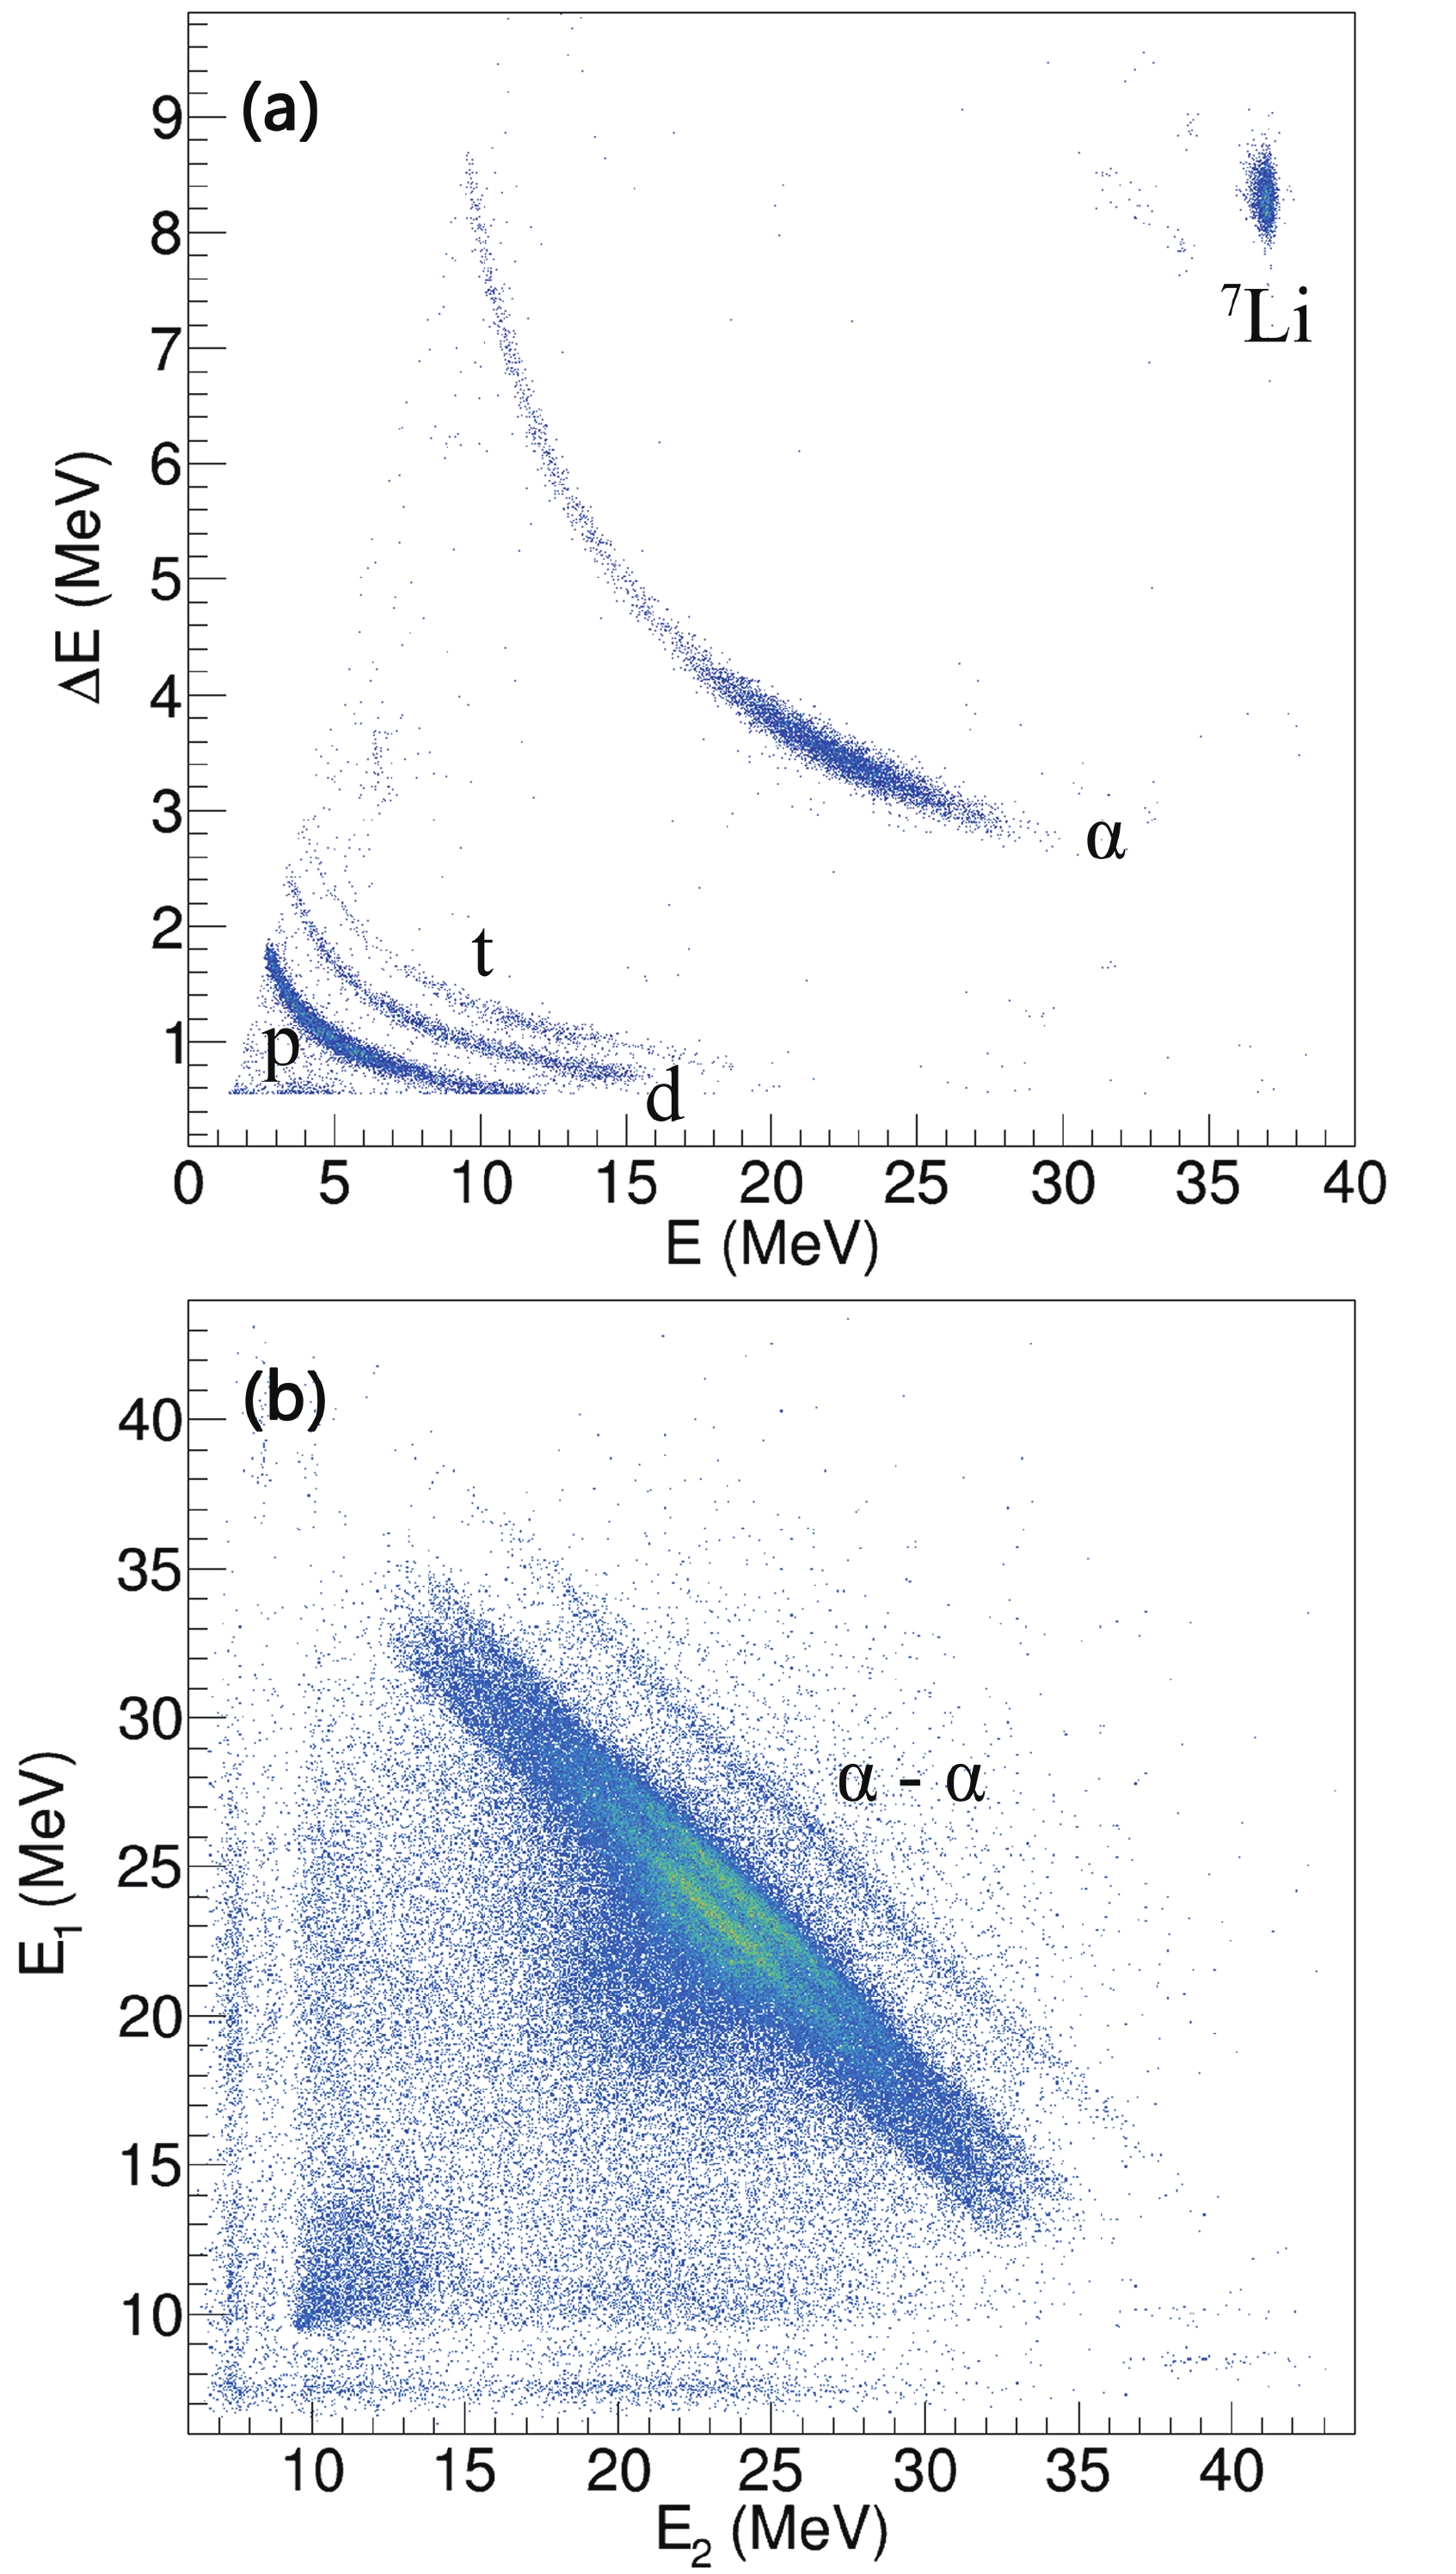
Figure 2. (color online) Two spectra measured in reaction of
${^{7}{\rm{Li}}}$ with${^{209}{\rm{Bi}}}$ at$E_{\rm{beam}}$ = 40 MeV. (a) The typical two-dimensional spectrum (energy loss$\Delta E$ versus total energy E) obtained from one vertical strip at 91$^{\circ}$ . The bands correspond to${^{7}{\rm{Li}}}$ ,$\alpha$ , proton, deuteron, and triton as labeled. (b) The two-dimensional$E_{ 1}$ vs.$E_{ 2}$ spectrum for binary coincidence events ($\alpha$ and$\alpha$ ). The bands correspond to the fragment pairs identified as the$\alpha$ +$\alpha$ breakup.To investigate the breakup mechanism in the reactions of
$ {^{6, 7}{\rm{Li}}} $ , the pure breakup events must be extracted from the raw data. In this study, the extraction of the breakup events was divided into two steps. First, two-dimensional gates were put on the particle bands of the particle identification (PID) spectra according to the breakup modes to be investigated, e.g., the bands corresponding to$ \alpha $ and deuteron were selected for the$ \alpha $ + d breakup. Second, other two-dimensional gates [13, 15] were put on the$ E_{\rm{1}} $ vs.$ E_{\rm{2}} $ spectra, where$ E_{\rm{1}} $ and$ E_{\rm{2}} $ are the kinetic energies for the coincidence particles in the reactions of$ {^{6, 7}{\rm{Li}}} $ with$ {^{209}{\rm{Bi}}} $ . As shown in Fig. 2(b), the bands corresponding to the coincidence events of$ \alpha $ and$ \alpha $ in the reaction of$ {^{7}{\rm{Li}}} $ at$ E_{\rm{beam}} $ = 40 MeV can be easily identified. Finally, the pure breakup events were extracted for further analysis. -
To determine the excitations of the residual target nuclei associated with the breakup process, such as
$ {^{208-211}{\rm{Bi}}} $ and$ {^{207,208}{\rm{Pb}}} $ , it is important to determine the Q value of each breakup event. The ground-state Q value,$ Q_{\rm{gg}} $ , of each breakup mode is generated from the following equation [13]:$ Q_{\rm{gg}} = E_{\rm{p}}+E_{\rm{recoil}}+E_{\rm{ex,p}}+E_{\rm{ex,recoil}}-E_{\rm{lab}}, $

(1) where
$ E_{\rm{p}} $ and$ E_{\rm{recoil}} $ are the final kinetic energy of the projectile-like nuclei and the recoil energy of the target-like nuclei, respectively;$ E_{\rm{ex,p}} $ and$ E_{\rm{ex,recoil}} $ are the excitation energies of the projectile-like nuclei and target-like nuclei, respectively; and$ E_{\rm{lab}} $ is the initial energy of the projectile in the laboratory frame. Owing to the breakup of projectile-like nuclei into two fragments detected during the experiment,$ E_{\rm{p}} $ is shared by the kinetic energies of the breakup fragments, and the Q value,$ Q = Q_{\rm{gg}}- $ $ E_{\rm{ex,recoil}} $ , can be written as [10, 12-15, 24]$ Q = E_{\rm{1}}+E_{\rm{2}}+E_{\rm{recoil}}-(E_{\rm{beam}}-E_{\rm{loss}}), $

(2) where
$ E_{\rm{i}} $ is the detected kinetic energy of the fragments,$ E_{\rm{loss}} $ is the energy loss in the target calculated at half-thickness, and$ E_{\rm{beam}} $ is the beam energy, all within the laboratory frame. The recoil energy$ E_{\rm{recoil}} $ is not measured directly but can be calculated from the known momenta and masses of the two fragments detected. The Q spectra show the peaks for each excited state of the target-like nucleus, whereas the excitation energy of the target-like nucleus cannot be measured by the detector array directly. The reconstructed Q spectra of all breakup modes in the reactions of$ {^{6, 7}{\rm{Li}}} $ with$ {^{209}{\rm{Bi}}} $ at$ E_{\rm{beam}} $ = 30, 40, and 47 MeV are shown in Fig. 3, respectively.
Figure 3. (color online) The Q spectra determined for the reactions of
$ {^{6, 7}{\rm{Li}}} $ with$ {^{209}{\rm{Bi}}} $ at$ E_{\rm{beam}} $ = 30, 40, and 47 MeV. The identified breakup modes in reactions of$ {^{6,7}{\rm{Li}}} $ consist of$ \alpha + p $ ,$ \alpha + d $ ,$ \alpha + t $ , and$ \alpha + \alpha $ while the$ \alpha + p $ breakup mode is unobserved in reactions induced by$ {^{7}{\rm{Li}}} $ . The vertical dashed lines indicate the expected$ Q_{\rm{gg}} $ for each breakup mode in reactions of$ {^{6}{\rm{Li}}} $ and$ {^{7}{\rm{Li}}} $ , respectively.In the reactions of
$ {^{6}{\rm{Li}}} $ , a breakup into$ \alpha + d $ is the most probable outcome, with the experimental Q value centered at the expected$ Q_{\rm{gg}} $ at$ E_{\rm{beam}} $ = 30 and 47 MeV, whereas multiple distinct peaks are contributed at$ E_{\rm{beam}} $ = 40 MeV, and the peak with the highest Q is centered at$ Q_{\rm{gg}} $ . In addition to this breakup process, the production of$ {^{5}{\rm{Li}}} $ through$ 1n $ -stripping, which breaks up into one$ \alpha $ particle and one proton, also contributes a large amount of the yield. The peak with the highest Q deviates the expected$ Q_{\rm{gg}} $ for the$ \alpha + p $ breakup but is centered at the excited-state Q value, similar to the result in Ref. [13]. The multiple peaks in the spectra corresponding to the$ \alpha + p $ breakup channel indicate that most of the target-like nucleus$ {^{210}{\rm{Bi}}} $ is populated in its excited states. The breakup of$ {^{8}{\rm{Be}}} $ into$ \alpha + \alpha $ , triggered by d-pickup, is observed in the reaction of$ {^{6}{\rm{Li}}} $ with$ {^{209}{\rm{Bi}}} $ . The$ \alpha + t $ breakup mode, triggered by the$ 1n $ -pickup of$ {^{6}{\rm{Li}}} $ to form the excited$ {^{7}{\rm{Li}}} $ , was unobserved in the previous measurements [12, 13] for$ {^{6}{\rm{Li}}} $ +$ {^{209}{\rm{Bi}}} $ . However, it is presented in this study.In addition, it is worth noting that the Q-value peaks for the
$ \alpha + d $ breakup,$ \alpha + p $ breakup after$ 1n $ -stripping, and$ \alpha + t $ breakup after$ 1n $ -pickup, overlap each other. It is difficult to distinguish the three breakup modes directly from the Q spectrum [13]. However, the gates put on the particle bands of the PID spectra are helpful for the separation. For a specific breakup mode, the gates on the PID spectra screen out the particles, which are not the products of the breakup mode from all events. For example, only events that contain two$ \alpha $ particles can be selected for the analysis of a$ {^{8}{\rm{Be}}} \to \alpha + \alpha $ breakup, and only the measured information of$ \alpha $ particles can be considered in the Q value calculation.For a breakup in the reactions of
$ {^{7}{\rm{Li}}} $ with$ {^{209}{\rm{Bi}}} $ at all bombarding energies, the most intense peak in the Q spectra corresponds to the process in which the projectile disintegrates into$ \alpha + t $ . However, the breakup triggered by a p-pickup is more probable for$ {^{7}{\rm{Li}}} $ . The breakup of the production of$ {^{8}{\rm{Be}}} $ into two$ \alpha $ particles contributes the multiple peaks in the Q spectra. These peaks correspond to the different resonant states of the target-like nucleus$ {^{208}{\rm{Pb}}} $ . The peak with the highest Q is centered at the expected$ Q_{\rm{gg}} $ for the$ \alpha + \alpha $ breakup, matching the expected Q values for a p-pickup from the target and forming the$ {^{8}{\rm{Be}}} $ . The$ \alpha + d $ breakup mode, triggered by$ 1n $ -stripping, is also observed in this study and contributes several peaks in the Q spectra. Similar to$ {^{6}{\rm{Li}}} $ , the Q-value peaks for the$ \alpha + t $ breakup and$ \alpha + d $ breakup after$ 1n $ -stripping also overlap each other in the Q spectra. -
The relative energy
$ E_{\rm{rel}} $ distributions of the two coincident fragments were used to characterize the breakup processes.$ E_{\rm{rel}} $ can be expressed in terms of the measured energies$ E_{\rm{i}} $ and the masses$ m_{\rm{i}} $ of the fragments [10, 12-15, 24]:$ E_{\rm{rel}} = \frac{m_{\rm{1}}E_{\rm{2}}+m_{\rm{2}}E_{\rm{1}}-2\sqrt{m_{\rm{1}}E_{\rm{2}}m_{\rm{2}}E_{\rm{1}}}\cos{\theta_{\rm{12}}}}{m_{\rm{1}} + m_{\rm{2}}}, $

(3) where
$ \theta_{\rm{12}} $ is the measured opening angle of the fragments within the laboratory frame and is given by [10, 24]$ \cos{\theta_{\rm{12}}} = \cos{\theta_{\rm{1}}}\cos{\theta_{\rm{2}}}+\sin{\theta_{\rm{1}}}\sin{\theta_{\rm{2}}}\cos{(\phi_{\rm{1}}-\phi_{\rm{2}})}, $

(4) where
$ \theta_{\rm{i}} $ and$ \phi_{\rm{i}} $ are the measured scattering angle and azimuthal angle of the coincident fragments, respectively.The detector efficiency for
$ E_{\rm{rel}} $ was obtained through a Monte Carlo simulation assuming that the breakup fragments were emitted isotropically in the frame of the projectile-like nucleus before it broke up. The$ E_{\rm{rel}} $ distributions with an efficiency correction in the reactions of$ {^{6, 7}{\rm{Li}}} $ with$ {^{209}{\rm{Bi}}} $ are shown in Fig. 4. The correlation of the time-scales for a breakup with the measured$ E_{\rm{rel}} $ was determined in previous studies [12, 13]. Therefore,$ E_{\rm{rel}} $ allows a classification of the breakup process into a prompt breakup or delayed breakup. For the latter one, the breakup occurs far from the target-like nucleus, and$ E_{\rm{rel}} $ equals the sum of the breakup Q value and the excitation energy of the resonant state of projectile-like nucleus, which disintegrates into two fragments. The peaks shown in the$ E_{\rm{rel}} $ spectra reflect the excited states of the projectile-like nucleus. If a breakup occurs close to the target-like nucleus, that is, a prompt breakup occurs, the Coulomb interaction between the target-like nucleus and the breakup fragments will disturb the fragment trajectories. Then,$ E_{\rm{rel}} $ no longer depends solely on the breakup energies, resulting in a smoothed$ E_{\rm{rel}} $ distribution [13].
Figure 4. (color online) Distributions of the relative energy
$ E_{\rm{rel}} $ of the coincident breakup fragments with an efficiency correction in all observed breakup modes in reactions induced by$ {^{6, 7}{\rm{Li}}} $ at$ E_{\rm{beam}} $ = 30, 40, and 47 MeV. The spectra are plotted in bins of 50 keV and up to values of$ E_{\rm{rel}} $ , where the counts reach a level of$ 10^{-3} $ of the maximum yield [13]. The sharp peaks that correspond to the 0$ ^{+} $ resonant state of$ {^{8}{\rm{Be}}} $ with$ E_{\rm{rel}} $ = 0.092 MeV are not easy to be seen and are marked in the figure. The Y-axis simply shows the relative cross sections without normalizations.For the reactions induced by
$ {^{6, 7}{\rm{Li}}} $ , the experimental$ E_{\rm{rel}} $ spectra for a$ {^{8}{\rm{Be}}} $ $ \to $ $ \alpha $ +$ \alpha $ breakup, shown in Fig. 4(a), show a sharp peak at 0.092 MeV, which corresponds to the ground-state decay of$ {^{8}{\rm{Be}}} $ , where the breakup occurs far from the target and has a width$ \Gamma $ = 5.57 eV corresponding to a lifetime of$ 1.18 \times 10^{-16} $ s. In addition, a wider peak that corresponds to the$ 2^{+} $ resonant state decay of$ {^{8}{\rm{Be}}} $ , the lifetime of which is$ 4.36 \times 10^{-22} $ s and the width is 1.513 MeV, is centered at 3.112 MeV in the$ E_{\rm{rel}} $ spectra in most cases. Because the time-scale of a prompt breakup is$ \sim 10^{-22} $ s, the decay was treated as an effectively instantaneous breakup and classified as a prompt breakup. The rest of the events without any characteristic structure should correspond to the breakup that occurs near the target-like nuclei.In the
$ E_{\rm{rel}} $ spectra shown in Fig. 4(b), corresponding to the breakup mode$ {^{6}{\rm{Li}}} $ $ \to $ $ \alpha $ + d, a sharp peak at 0.712 MeV exists in all observed cases. The peak represents the breakup from the$ 3^{+} $ resonant state of$ {^{6}{\rm{Li}}} $ with a lifetime of$ 2.74 \times 10^{-20} $ s. A doubtful peak exists in the$ E_{\rm{rel}} $ spectrum for the$ \alpha $ + d breakup in a reaction induced by$ {^{7}{\rm{Li}}} $ at$ E_{\rm{beam}} $ = 40 MeV. The peak is centered at$ \sim $ 2 MeV and corresponds to the breakup from the$ 0^{+} $ resonant state of$ {^{6}{\rm{Li}}} $ with a lifetime of$ 8.02 \times 10^{-17} $ s.For the
$ {^{7}{\rm{Li}}} $ $ \to $ $ \alpha $ + t breakup, no obvious peak is observed in the$ E_{\rm{rel}} $ spectra at$ E_{\rm{beam}} $ = 30 MeV for the reactions induced by both$ {^{6}{\rm{Li}}} $ and$ {^{7}{\rm{Li}}} $ , as shown in Fig. 4(c). At$ E_{\rm{beam}} $ = 40 and 47 MeV, a sharp peak at 2.162 MeV is observed in the$ E_{\rm{rel}} $ spectra in the rest of the observed cases. The peak corresponds to the decay of the$ 7/2^{-} $ resonant state of$ {^{7}{\rm{Li}}} $ with a lifetime of$ 7.08 \times 10^{-21} $ s. In addition, the$ E_{\rm{rel}} $ spectra for the reactions of$ {^{6}{\rm{Li}}} $ with$ {^{209}{\rm{Bi}}} $ show a slight peak at$ E_{\rm{rel}} $ $ \sim $ 5 MeV, perhaps due to the breakup from the$ 5/2^{-} $ resonant state of$ {^{7}{\rm{Li}}} $ with an excitation energy of 7.46 MeV. The state has a lifetime of$ 7.40 \times 10^{-21} $ s, which might be sufficiently long to see the projectile breakup in the asymptotic region.All
$ E_{\rm{rel}} $ spectra of the$ {^{5}{\rm{Li}}} $ $ \to $ $ \alpha $ + p breakup measured in reactions of$ {^{6, 7}{\rm{Li}}} $ with$ {^{209}{\rm{Bi}}} $ , have predominantly large$ E_{\rm{rel}} $ values. In addition, most of the$ E_{\rm{rel}} $ spectra for the$ \alpha $ + p breakup show a slight peak at$ E_{\rm{rel}} $ $ \sim $ 1.96 MeV, corresponding to the breakup from the$ 3/2^{-} $ resonant state of$ {^{5}{\rm{Li}}} $ . The state has a mean lifetime of$ 5.35 \times 10^{-22} $ s, and thus, its breakup is treated as a prompt one. -
A breakup in the reactions of
$ {^{6, 7}{\rm{Li}}} $ with$ {^{209}{\rm{Bi}}} $ consists of a direct breakup from the excitation of$ {^{6, 7}{\rm{Li}}} $ and a transfer breakup from the intermediate nuclei ($ {^{5,6,7}{\rm{Li}}} $ and$ {^{8}{\rm{Be}}} $ ) through a nucleon transfer. It is helpful for an investigation of the breakup mechanism in reactions induced by$ {^{6, 7}{\rm{Li}}} $ to obtain the relative probabilities of the observed breakup modes.For the
$ {^{6}{\rm{Li}}} $ -induced reactions shown in Fig. 5(a), the direct breakup from$ {^{6}{\rm{Li}}} $ plays a more important role than the$ \alpha $ + p breakup triggered by$ 1n $ -stripping. In addition, the other two observed breakup modes only occupy small parts of the total yields. Fig. 5(a) also shows the relative probabilities of the observed breakup modes in reactions of$ {^{7}{\rm{Li}}} $ , and the largest contribution to a breakup is clearly triggered by a p-pickup, resulting in a$ \alpha $ +$ \alpha $ breakup of the$ {^{8}{\rm{Be}}} $ projectile-like nuclei. A direct breakup from$ {^{7}{\rm{Li}}} $ also plays an important role in the reaction. Less than 30% contribution was made by the$ \alpha $ + d breakup triggered by$ 1n $ -stripping. However, whatever the breakup modes are, the delayed breakup components have no effect on CF as the projectile-like nuclei have arrived at the barrier radius and undergo CF, and only a prompt breakup can suppress the CF cross section at energies above the Coulomb barrier because the breakup may deplete the flux of intact nuclei before reaching the fusion barrier [13]. The relative probabilities for the prompt breakup are more important for an investigation into the breakup mechanism in a reaction induced by weakly bound nuclei.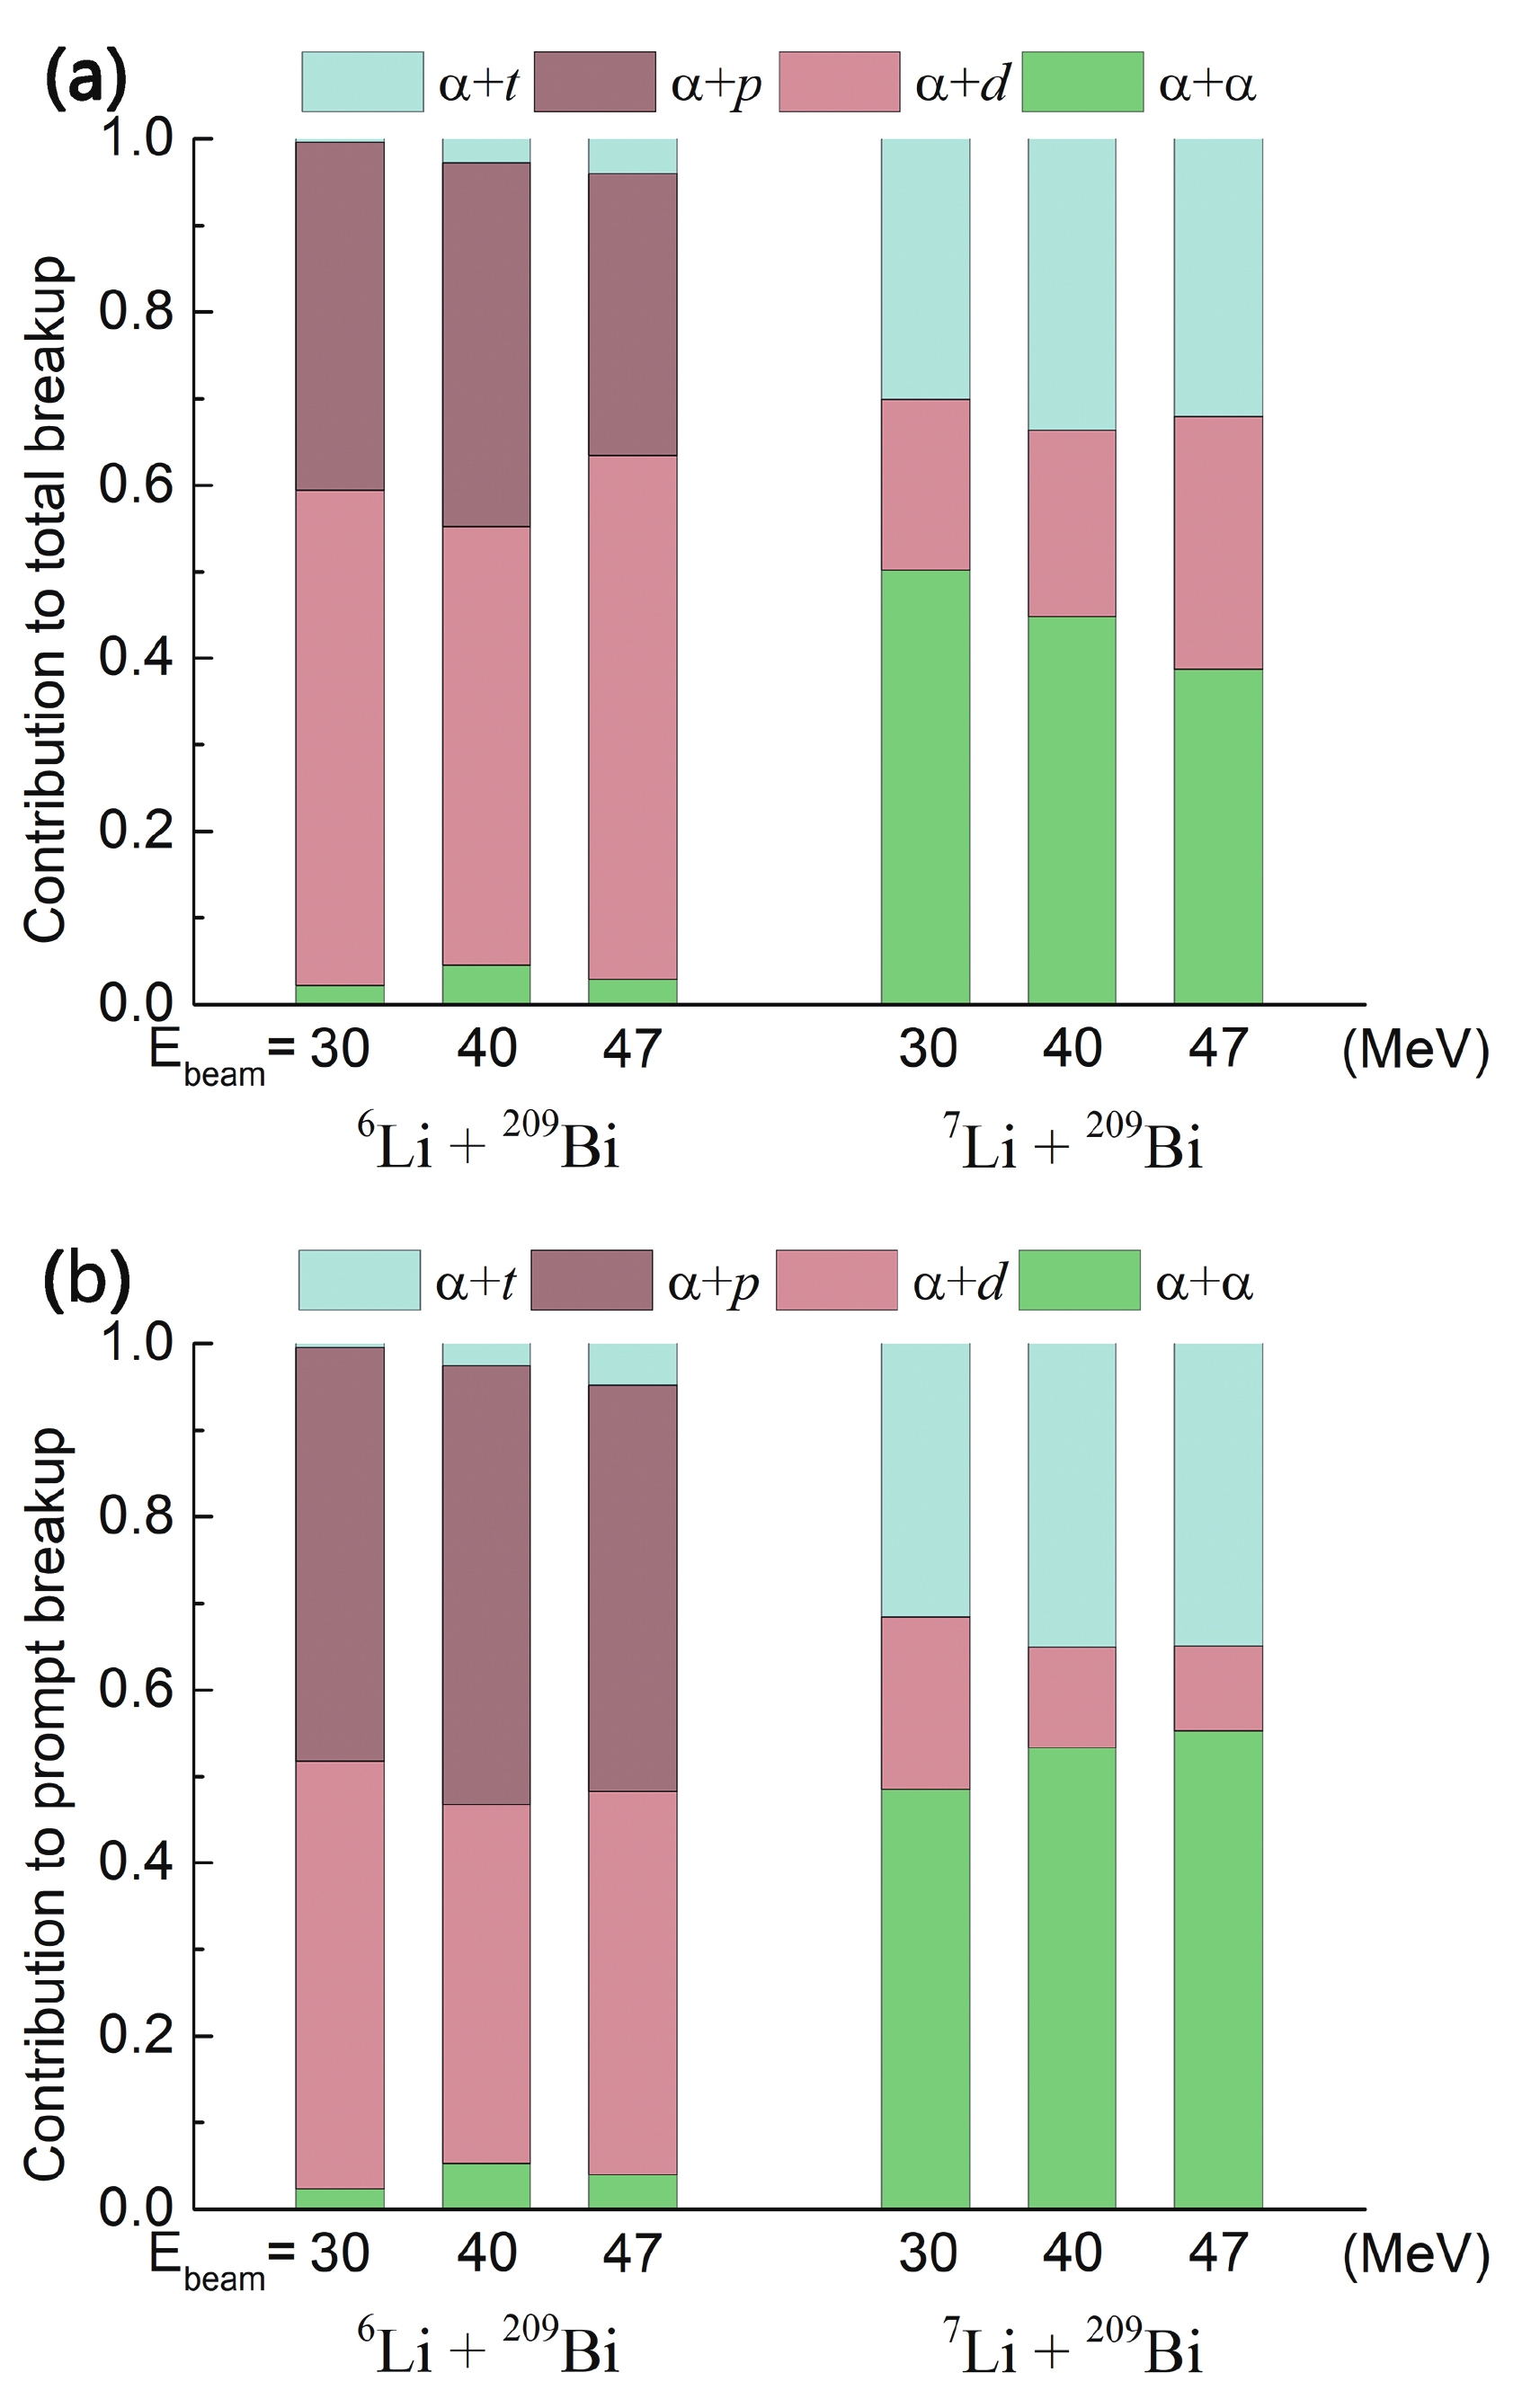
Figure 5. (color online) Relative contributions by the
$\alpha$ +$\alpha$ ,$\alpha$ + t,$\alpha$ + d, and$\alpha$ + p breakup to (a) the total breakup and (b) the total prompt breakup in the reactions of${^{6, 7}{\rm{Li}}}$ with${^{209}{\rm{Bi}}}$ at$E_{\rm{beam}}$ = 30, 40, and 47 MeV.To determine the total prompt breakup in the reactions of
$ {^{6, 7}{\rm{Li}}} $ , the prompt breakup components for the$ \alpha $ +$ \alpha $ ,$ \alpha $ + d, and$ \alpha $ + t breakup modes have been separated from the delayed breakup by subtracting the estimated delayed breakup events from the total breakup events. The procedure used to estimate the delayed breakup component for the$ \alpha $ + d breakup is shown in Fig. 6. By fitting the narrow peak in the$ E_{\rm{rel}} $ spectrum for the$ \alpha $ + d breakup with Gaussian fitting, the delayed breakup events that correspond to the area of the narrow peak can be calculated. The prompt breakup events, which correspond to the area of the coloured portion in Fig. 6, can then be calculated. This method has been applied to all$ E_{\rm{rel}} $ spectra where the narrow peaks exist.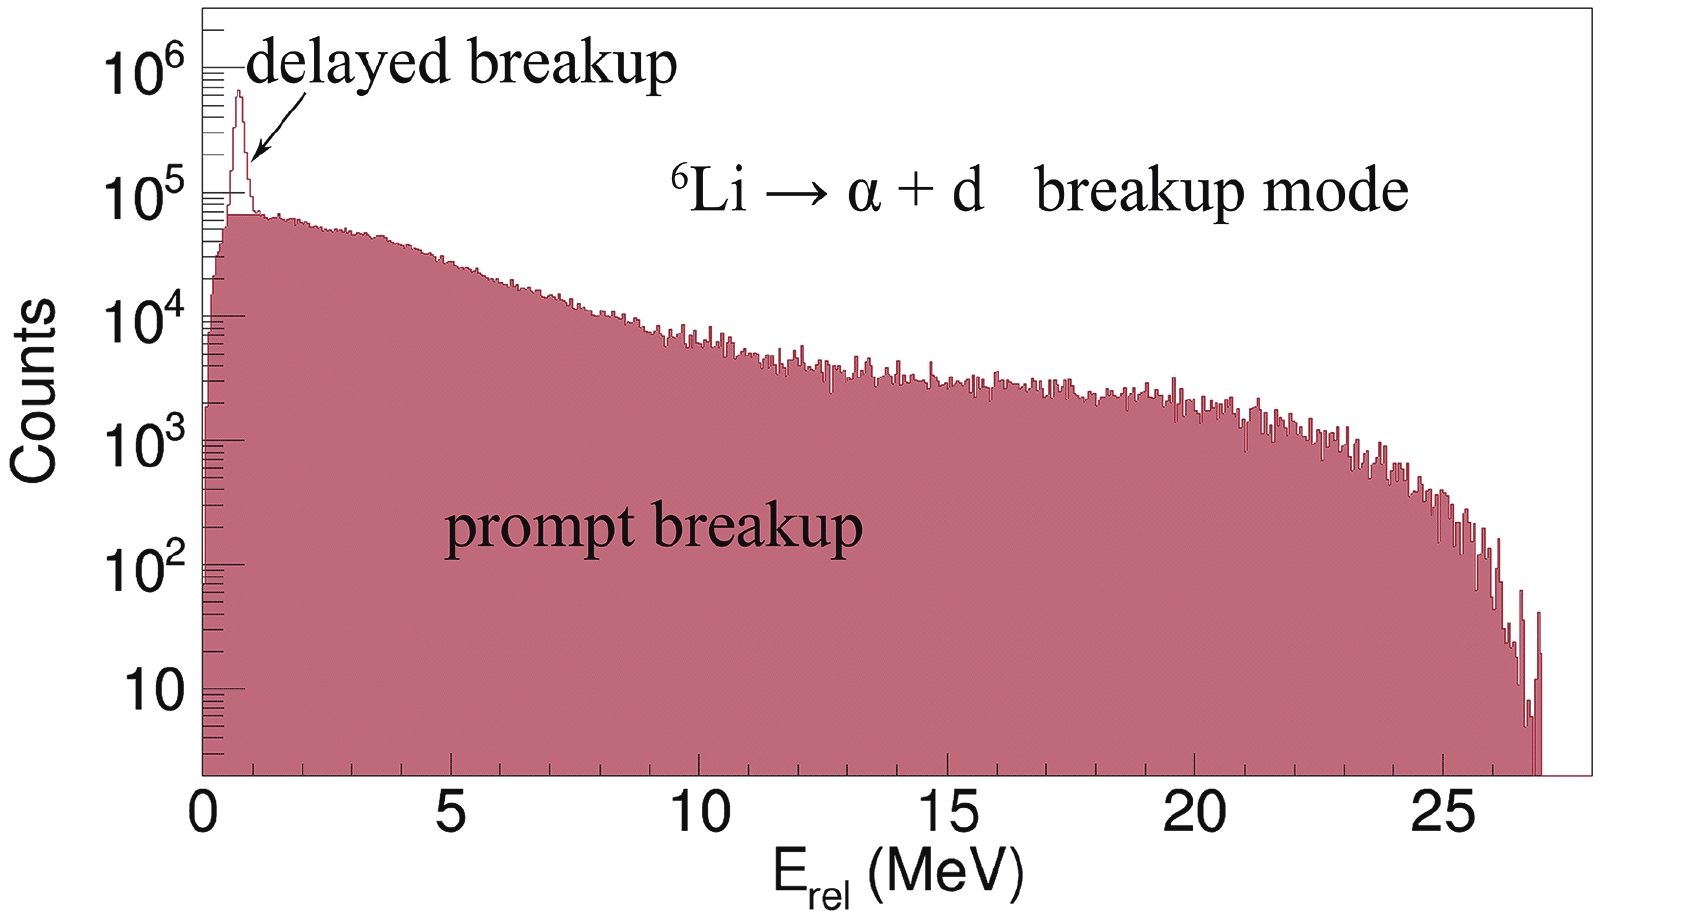
Figure 6. (color online) Separation of the prompt
$\alpha$ + d breakup components from the total breakup yields in reactions of${^{6}{\rm{Li}}}$ with${^{209}{\rm{Bi}}}$ at$E_{\rm{beam}}$ = 30 MeV based on a Gaussian fitting of the narrow peak.The relative probabilities of a prompt breakup and a delayed breakup for the different breakup modes in the reactions of
$ {^{6, 7}{\rm{Li}}} $ with$ {^{209}{\rm{Bi}}} $ at all bombarding energies are shown in Fig. 7. For the$ \alpha $ +$ \alpha $ breakup, the contribution of the delayed breakup is less than 10% in the reactions of$ {^{6, 7}{\rm{Li}}} $ . In the reactions of$ {^{6}{\rm{Li}}} $ , the delayed breakup provides no contribution to the$ \alpha $ + t breakup at$ E_{\rm{beam}} $ = 30 MeV and a larger contribution at$ E_{\rm{beam}} $ = 40 and 47 MeV. With an increase in the incident energy, the prompt direct breakup makes less contribution to the$ \alpha $ + d breakup. For reactions induced by$ {^{7}{\rm{Li}}} $ , the contribution given by the prompt breakup to the$ \alpha $ + d and$ \alpha $ + t breakups decreases when the bombarding energy increases, in contrast to that for the$ \alpha $ +$ \alpha $ breakup.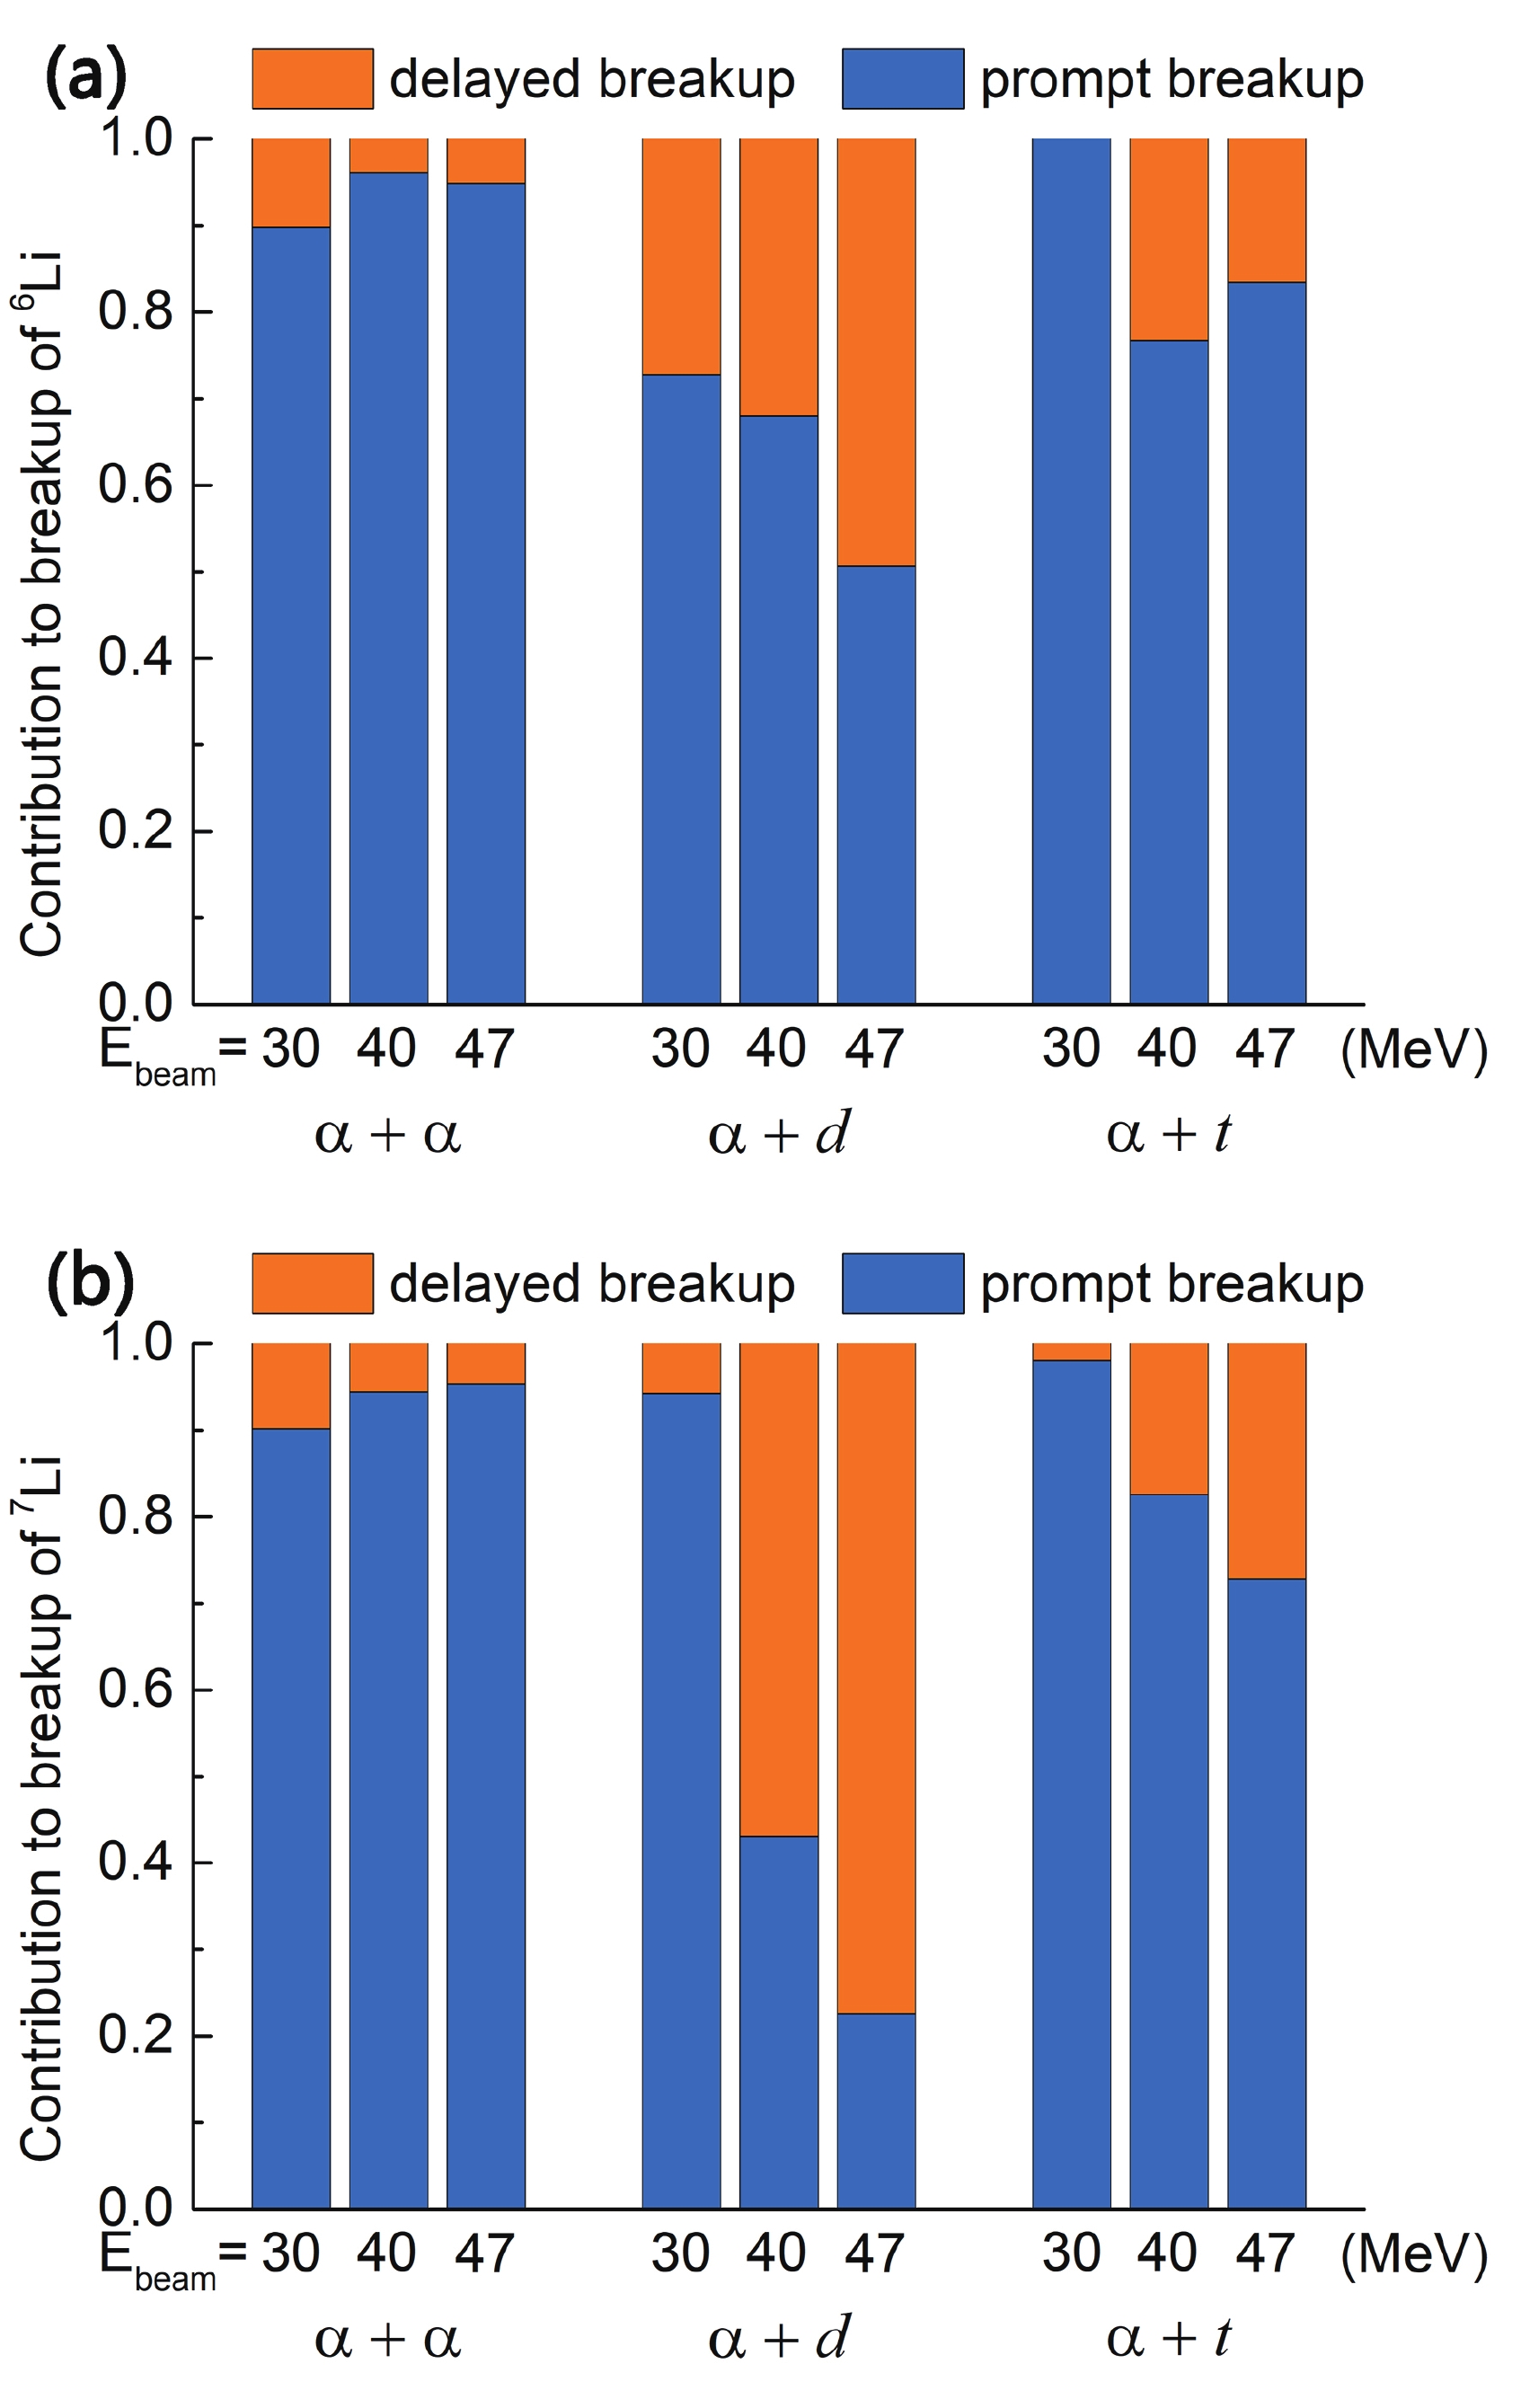
Figure 7. (color online) Relative contributions by the prompt breakup and the delayed breakup to the total breakup for the
$\alpha$ +$\alpha$ ,$\alpha$ + t, and$\alpha$ + d breakup modes of reactions of${^{6, 7}{\rm{Li}}}$ with${^{209}{\rm{Bi}}}$ at$E_{\rm{beam}}$ = 30, 40, and 47 MeV.The relative contributions to the prompt breakup in all identified breakup modes are shown in Fig 5(b). For the reactions of
$ {^{6}{\rm{Li}}} $ , less contribution is made by the$ \alpha $ + d breakup mode to the prompt breakup than the total breakup, whereas the opposite is shown for the$ \alpha $ + p breakup mode. After a comparison with the results in previous studies [12, 13], it was found that the prompt breakup triggered by$ 1n $ -stripping is predominant over a prompt direct breakup, whereas the$ \alpha $ +$ \alpha $ breakup provides little contribution to a prompt breakup at energies below and above the Coulomb barrier.In
$ {^{7}{\rm{Li}}} $ -induced reactions, owing to the large contribution from the delayed breakup in$ \alpha $ + d break mode, the$ \alpha $ + d breakup provides less contribution to the CF suppression with an increase in the bombarding energy. After a comparison with the previous results [12, 13], it was found that the$ \alpha $ + d breakup provides the largest contribution to the prompt breakup at energies around the Coulomb barrier. By contrast, the relative probability of the$ \alpha $ + t breakup is the smallest for energies around the Coulomb barrier in the reactions of$ {^{7}{\rm{Li}}} $ . Differing from both the$ \alpha $ + t and$ \alpha $ + d breakups, a prompt$ \alpha $ +$ \alpha $ breakup provides a larger contribution to a prompt breakup with an increase in the bombarding energy, at both sub-barrier energies and above-barrier energies. -
Coincidence measurements of fragments provide detailed information of the breakup modes in the reactions of
$ {^{6, 7}{\rm{Li}}} $ with$ {^{209}{\rm{Bi}}} $ at energies around and above the Coulomb barrier. Through the reaction Q values and the relative energies of the breakup fragments, a separation of the prompt and delayed breakup components is allowed, and relative probabilities of the breakup channels are obtained.Through a comparison with the results of previous studies [10, 12-15] in which the coincidence measurements were used at sub-barrier energies, some new discoveries were observed. A new breakup mode, i.e., a
$ \alpha $ + t breakup triggered by a$ 1n $ -pickup, was found in the reactions of$ {^{6}{\rm{Li}}} $ for energies around and above the Coulomb barrier. It was also found that the breakup mechanism in weakly bound nuclear systems is related to the incident energy. The relative contributions of the prompt breakup in different breakup modes change in different trends with an increase in the bombarding energy below and above the Coulomb barrier.This study facilitates an understanding of the breakup mechanism in reactions of weakly bound nuclei and promotes the prediction of the breakup effect on the complete fusion at above-barrier energies.
-
We are grateful to the staff of the China Institute of Atomic Energy for providing the stable 6,7Li beams throughout the experiments.
Relative probabilities of breakup channels in reactions of 6,7Li with 209Bi at energies around and above the Coulomb barrier
- Received Date: 2020-12-29
- Available Online: 2021-05-15
Abstract: Coincidence measurements of breakup fragments in reactions of


 Abstract
 HTML
HTML Reference
 Related
 PDF
PDF




 DownLoad: