


 Abstract
 HTML
HTML Reference
 Related
 PDF
PDF


-
Since Rutherford discovered the atomic nucleus [1], there has been an interest in studying the proton and the neutron density distributions in finite nuclei. An accurate knowledge of density distributions is crucial for understanding the fundamental properties of nuclear matter and nature of nuclear force. The proton differs from the neutron in its nature and interactions, and the difference is reflected in the distributions of protons and neutrons within the nucleus. In general, the distribution of protons differs from the distribution of neutrons, qualitatively and quantitatively, particularly in the range of very heavy and superheavy nuclei, where increasing the neutrons/protons ratio is necessary to maintain the stability of the nucleus. The difference between the neutron and proton distributions is abstracted as the difference between the neutron and proton distributions root-mean-square (rms) radii, called the "neutron skin thickness". The neutron skin thickness is fundamental for investigating certain crucial problems in modern nuclear physics and astrophysics. It was found that including the neutron skin thickness in the
$ \alpha $ -decay calculation improves the calculation of$ \alpha $ -daughter potential as well as the prediction of$ \alpha $ -decay half-lives and$ \alpha $ -preformation probability [2, 3]. Similar effects have been reported in the calculation of the$ \alpha $ -decay of neutron-deficient nuclei that have "proton skin" instead of "neutron skin" [4]. The value of neutron skin thickness is important for studying decay. Further, the changes in the neutron skin thickness from parent to daughter nuclei consistently correlate with the observed half-lives [5]. An accurate estimation of neutron and proton distributions is crucial in the study of asymmetric nuclear matter, which bridges nuclear physics and astrophysics [6-8].In the 1950s, Hofstadter pioneered electron scattering experiments [9], which provided, subsequent refinements and an accurate description of electric charge distributions of stable isotopes [10-13] and short-lived isotopes [14, 15]. The most accurate form of charge densities is provided as a model independent distribution in terms of Fourier–Bessel coefficients [10-12]. Several diffused analytical formulae may be used to represent the charge densities involving fewer parameters than numerous Fourier–Bessel coefficients. Such forms are commonly used in nuclear reaction and nuclear structure studies. For most applications, two-parameter Fermi (2pF) distributions and three-parameter Fermi (3pF) distributions are acceptable approximations for nuclear charge and matter distributions [16-18]. The 2pF and 3pF distributions are obtained from equations 1 and 2, respectively; where a is the diffuseness parameter; R is the radius of the nucleus; and w is the central depression parameter. The central density,
$ \rho_0 $ , is determined via normalization of the number of protons (Z) or neutrons (N).$ \rho(r) = \frac{\rho_0}{1+{\rm e}^{(r-R)/a}}. $

(1) $ \rho(r) = \frac{\rho_0 \left[1+w(r^2/R^2) \right] }{1+{\rm e}^{(r-R)/a}}. $

(2) Although 2pF distribution is the most widely used in studying the nuclear structure, reactions, and decay, using 3pF distribution improves the calculation of binding energy [19] and alpha decay half-life time and pre-formation probability [20]. Recent studies show that the fitting of the experimental charge distributions to 3pF distribution does not provide a significant improvement over the fitting to 2pF [17, 21]. This is because the functions could not describe the density fluctuation within the nuclear interior that appears in the experimental distributions. The recently proposed double 3pF distribution (d3pF), which allows for density fluctuation, fits the experimental charge densities with significant improvement in accuracy over other commonly used formulae [21]. The d3pF distribution, which is given by equation 3, is composed of two 3pF terms, one has a larger radius parameter to describe the tail of the density and the second has a smaller radius to describe the density fluctuation at the nucleus interior.
$ \rho(r) = \rho_0 \sum\limits_{i = 1,2} \frac{\delta_i\left[1+w_i(r^2/R_i^2) \right] }{1+{\rm e}^{(r-R_i)/a_i}}, \delta_1+\delta_2 = 1, $

(3) where
$ \delta_i $ is the weight of the two 3pF terms. This function has seven independent parameters as the density distribution should verify the normalization condition.Although the charge distributions were measured accurately, the data for neutron distributions are not sufficient. The study of neutron distributions has attracted interest because of its fundamental importance as it determines the nuclear drip lines and stability regions [22], leads to special structures and phenomena in certain isotopes [23-25], and germane to the structure of neutron stars [8, 26, 27]. There have been extensive studies to develop experiments to characterize the neutron distributions in nuclei using different techniques. The neutron distributions have been probed mostly by hadron scattering [28],
$ \alpha $ -scattering [29], nuclear pion photoproduction [30], or electroweak electron scattering [31]. Because of the complexity of the strong force, the hadronic probes require model assumptions, and the results are model-dependent. An electro-weak probe was introduced as a model-independent probe of neutron distributions [32, 33]. The probe primarily characterizes the distribution of weak charge in nuclei, which is caused by the neutrons as the weak charge of the proton is approximately 7% its value for the neutron [34]. The experimental efforts in the study of the neutron distribution extensively measure the distribution rms radii [32, 35, 36] and neutron skin thickness [32, 37]. The measured neutron distribution rms radius of 208Pb ranges from 5.6 fm to 5.94 fm [28, 38], and the neutron skin thickness ranges from 0.09 fm to 0.49 fm [28, 30, 38]. This uncertainty may originate from the limitations of the measurements and statistical and systematic errors. In an attempt to explore the density distribution, a recent coherent pion-photoproduction experiment provided the neutron density of 208Pb by fitting pion-nucleus scattering data to the 2pF distribution with$ R = 6.7 \pm 0.03 $ fm and$ a = 0.55 \pm 0.03 $ fm [30].As the experimental studies were successful in the characterization of proton density in nuclei, many theoretical approaches were developed to understand the nuclear structure, such as binding energy, deformations, proton and neutron density distributions, and exotic nuclear structures. There are different levels of theoretical calculations, from the pure fundamental ab-initio methods to the pure phenomenological methods, such as the liquid drop model. However, certain approaches with simplified potentials are proposed to address the many-particle problem, e.g., self-consistent mean-field models [39] or shell model. The most notable alternative to the self-consistent method is the semi-microscopic method [40, 41] with strutinsky shell-correction [42, 43], where the energy of a nucleus is considered to be the sum of its macroscopic and microscopic components. In addition to its simplicity, the semi-microscopic technique is successful in studying the nuclear structure [19, 20, 44-47] and
$ \alpha $ -decay [48]. The semi-microscopic approach used in this study can successfully reproduce data of the recently discovered superheavy element 294Og and other Og isotopes, whose accuracy corresponded well with the experimental data [45]. Further, it accurately predicts the masses and deformations for heavy and superheavy nuclei similar to the prevalent microscopic and semi-microscopic models [19, 46, 47]. -
In this study, the total energy is evaluated in the framework of the semi-microscopic approach reported in [19, 46]. In this method, the macroscopic component of the total energy is considered by the energy density functional, with the Skyrme force, SkM*, as a function of the nucleon densities,
$ \rho_i $ , and kinetic energy densities,$ \tau_i $ , [49] in the form,$ {\cal{H}}({{r}}) = \frac{\hbar^2}{2m}[\tau_p ({{r}})+\tau_n ({{r}})]+{\cal{H}}_{\rm{Sk}}({{r}})+{\cal{H}}_{\rm{Coul}}( {{r}}), $

(4) where
$ {\cal{H}}_{\rm Sk}(r) $ is the nuclear energy density and$ {\cal{H}}_{\rm Coul}(r) $ is the coulomb energy density. The macroscopic component of the total energy, E, is given by the volume integral of the total energy density.$ E = \int{ {\cal{H}} {\rm d}{ r}}. $

The microscopic contribution is considered using Strutinsky's shell and the pairing correction method. The shell-correction energy is calculated as the difference between the sum of occupied energy levels obtained from the Woods–Saxon single particle Hamiltonian and the corresponding sum obtained using the Strutinsky's smoothing procedure [42, 50]. The Barden-Cooper-Scheffer (BCS) approach is used to calculate the residual pairing correction energy, as reported in [51].
To consider the finer details of the experimental proton density, we use the model independent Fourier–Bessel expansion [10-12] given by,
$ \rho (r) = \left\{ {\begin{array}{*{20}{c}} {\displaystyle\sum\nolimits_v {{a_v}} {j_0}(v\pi r/R)}, &{r \leqslant R}\\ 0, &{r > R} \end{array}}\ , \right.$

(5) where
$ j_0 $ is the zero-order spherical Bessel function, and$ a_v $ and R are Fourier–Bessel coefficients deduced from the experiments and obtained from data compilation [11]. The 2pF, 3pF, and d3pF distributions, as obtained from equations 1, 2 and 3, respectively, are used to parameterize the neutron density distribution for calculating the total energy. -
In this study, the binding energy of 208Pb is calculated assuming that the proton density distribution is constrained to its experimental distribution. The neutron density distribution is considered in the form of parameterized analytical distributions. A semi-microscopic model based on energy density functional with the Skyrme force, Strutinsky's shell, and pairing correction is used to calculate the total energy surface of the 208Pb nucleus in a multidimensional space,
$ E(R_1,a_1,w_1, R_2,a_2,w_2,\delta_2 ) $ . The seven variables of the total energy surface in the procedure, used in this study, are based on the d3pF formula. The differential evolution method, proposed by Storn and Price [52], is used to minimize the total energy in the multidimensional space, and then, obtain the ground state binding energy and neutron density distribution parameters. The differential evolution method provides an efficient adaptive scheme for global optimization over continuous spaces, and it was used with the semi-microscopic approach to study the nuclear structure of 230Th [53] and 288-308Og isotopes [45]. All the degrees of freedom of the total energy are set to vary, but certain variables must be switched-off to obtain the different density distributions. In case of the 2pF density distribution, the first two parameters are free and the remaining are set to zero, i.e., the minimization procedure considers$ E(R,a,0,0,0,0,0) $ total energy surface. In case of the 3pF density distribution, the first three parameters are free and the remaining are set to zero, i.e., the minimization procedure considers$ E(R,a,w,0,0,0,0) $ total energy surface. In case of the d3pF density distribution, all the seven variables are free.Currently, there are numerous parameterizations of the Skyrme force, which may affect the inferred binding energy and/or neutron density distribution. The effect of the Skyrme force has been evaluated in previous nuclear structure studies, and the results indicated that the force used has a slight influence on the value of the calculated binding energy, while the inferred nuclear deformation is not affected [47, 53]. To select one Skyrme force for this study, previous studies were reviewed, and SKM* was selected because its results correspond well with the experimental values. For example, Terasaki and Engel [54] found that the SKM* works better than SLY4 in the prediction of single-particle vibrational states calculated using the self-consistent method with a quasiparticle random-phase approximation. Ismail et al. [47] determined that the binding energies calculated by the semi-microscopic approach with the SKM* force show a small rms deviation from the experimental values when compared with the results of SLy4 and SkP. Further, two previous studies reported the nuclear density of 208Pb using the semi-microscopic approach with the SKM* force, but without restricting the proton density distribution [19, 47]. Hence, the efficiency of the proposed improvements can be compared and evaluated without considering the effect of the Skyrme force in the calculation.
In case of the 2pF distribution, the parameters considered in the minimization are the radius parameter, R, and diffuseness parameter, a. The minimum total energy of -1623.28 MeV is obtained at
$ R = 6.85 $ fm and$ a = 0.85 $ fm.In case of the 3pF distribution, the minimization is performed with respect to R, a, and w. The minimum total energy of -1635.53 MeV is obtained at$ R = 7.1 $ fm,$ a = 0.48 $ fm. and$ w = -0.27.$ As a result of increasing the degrees of freedom of minimization from 2 to 3, the nucleus gains extra binding energy of$ 3.25 $ MeV. The neutron density distribution of 208Pb is not constant near the nucleus center, but it is raised. Hence, considering the central depression parameter, w, adds to the binding energy of 208Pb. For other nuclei whose distributions are constant near the center, the effect of w would be less significant. For light nuclei and ultra-heavy nuclei, the significance of the central depression parameter would be high as their ground states are centrally raised and centrally depressed, respectively [19]. In case of the d3pF, the minimum total energy is$ -1636.66 $ MeV and obtained at$ R_1 = 6.77 $ fm,$ a_1 = 0.56 $ fm,$ w_1 = -0.02 $ ,$ R_2 = 2.12 $ fm,$ a_2 = 0.47 $ fm,$ w_1 = -2.49,$ and$ \delta_2 = -0.047 $ . Increasing the degrees of freedom of the minimization from 3 to 7 adds$ 1.09 $ MeV to the binding energy of 208Pb, i.e., approximately$ 1/3 $ the gain in the binding energy was due to the increase in the degrees of freedom from 2 to 3. Although the improvement in binding energy owing to the seven parameters is relatively small, the shape of the density is improved strongly. The d3pF distribution allows for central depression and fluctuations in the nuclear interior. Moreover, a comparison between the results of the three distribution formulae indicates that considering more parameters would not significantly increase the calculated binding energy.The values of the parameters corresponding to the minimum binding energy of 208Pb are presented in Table 1in addition to the values of the rms radius of neutrons distribution, neutron skin thickness, and total energy. Comparing the calculated total energy values corresponding to 2pF, 3pF and d3pF distributions with the experimental total energy, we observed that the difference between the calculated energy and experimental value decreases with an increase in the number of parameters. A smallest difference of 0.19 MeV is obtained in the case of d3pF. For 2pF and 3pF distributions, the calculated binding energy is smaller than the experimental binding energy by 4.15 MeV and 0.9 MeV, respectively. For d3pF, the calculated binding energy is greater than the experimental binding energy by 0.19 MeV. The experimental results of neutron distribution probing experiments include the values of rms radius, neutron skin thickness, or an interpolated fit to an analytical formula. The 2pF distribution parameters extracted from the coherent pion-photoproduction experiment, shown in Table 1, may provide a good description for the tail of the density, but not for the detailed distribution near the center. Comparing the values of the radius parameters of the three distributions considered in this study with the experimental value, it can be observed that the d3pF distribution corresponds well the experimental value, followed by 2pF and 3pF. Similarly, the values of the diffuseness parameters for the d3pF and 2pF distributions correspond well with the experimental value, while the 2pF distribution shows less diffuseness. For this comparison, we consider the
$ R_1 $ and$ a_1 $ parameters for the d3pF formula, which describe the tail of the distribution.2pF 3pF d3pF Experimental values 1 2 R (fm) 6.85 7.10 6.77 2.12 6.70±0.03 [30] a (fm) 0.52 0.48 0.56 0.47 0.55±0.03 [30] w −0.27 −0.02 −2.49 $\delta$ 

1.047 −0.047 rms R (fm) 5.647 5.616 5.623 $5.78_{-0.18}^{+0.16}$ [38]

$5.653_{-0.029}^{+0.026}$ [28]

Neutron skin thickness (fm) 0.144 0.113 0.120 $0.15_{-0.06}^{+0.04}$ [30]

$0.33_{-0.18}^{+0.16}$ [38]

$0.211_{-0.063}^{+0.045}$ [28]

Total energy (MeV) −1632.28 −1635.53 −1636.62 −1636.43 [55] Difference between the experimental values (MeV) −4.15 −0.9 +0.19 Table 1. Values of the minimum total energy and corresponding density distribution parameters, neutron distribution rms radii, and neutron skin thickness for the 2pF, 3pF, and d3pF formulae. The experimental values are presented for comparison.
The experimental data of the rms radius and neutron skin thickness show relatively large uncertainty. The experimental data demonstrate that the rms radius of 208Pb is between 5.6 fm and 5.94 fm [28, 38] and neutron skin thickness is between 0.09 fm and 0.49 fm [28, 30, 38]. The calculated values of the rms radius and neutron skin thickness from the three resulting distributions are within these ranges, but generally exhibit lower values than the mean values of the experimental results. Particularly, the resulting rms radius and neutron skin thickness considering the 2pF neutron distribution are greater than the corresponding values in case of d3pF and followed by 3pF. The experimental values, shown in Table 1, are obtained from the pion-photoproduction [30], parity violation experiment conducted at the Jefferson lab (PREX) [38], and proton elastic scattering [28]. The experiments conducted with electromagnetic probes have clearer theoretical basis than the strongly interacting probes, and have the advantages of probing the full nuclear volume and disturbing the ground state of the target nucleus less . The experimental results are listed in Table 1 in ascending order according to the mass of the probing particle. In the pion-photoproduction experiment, the incident particles are photons, while in the PREX parity violation experiment, electrons are employed. The values of the neutron skin thickness calculated in this study correspond well with the data extracted from the pion-photoproduction experiment. Although the calculated values are less than the mean value, all the values are within the error range of the experimental results. The neutron skin thickness extracted from parity-violation and proton elastic scattering experiments are considerably high relative to those deduced by the pion-photoproduction and values calculated in this study. The values of the rms radius calculated in this study correspond with the values derived from the parity violation and proton elastic scattering experiments.
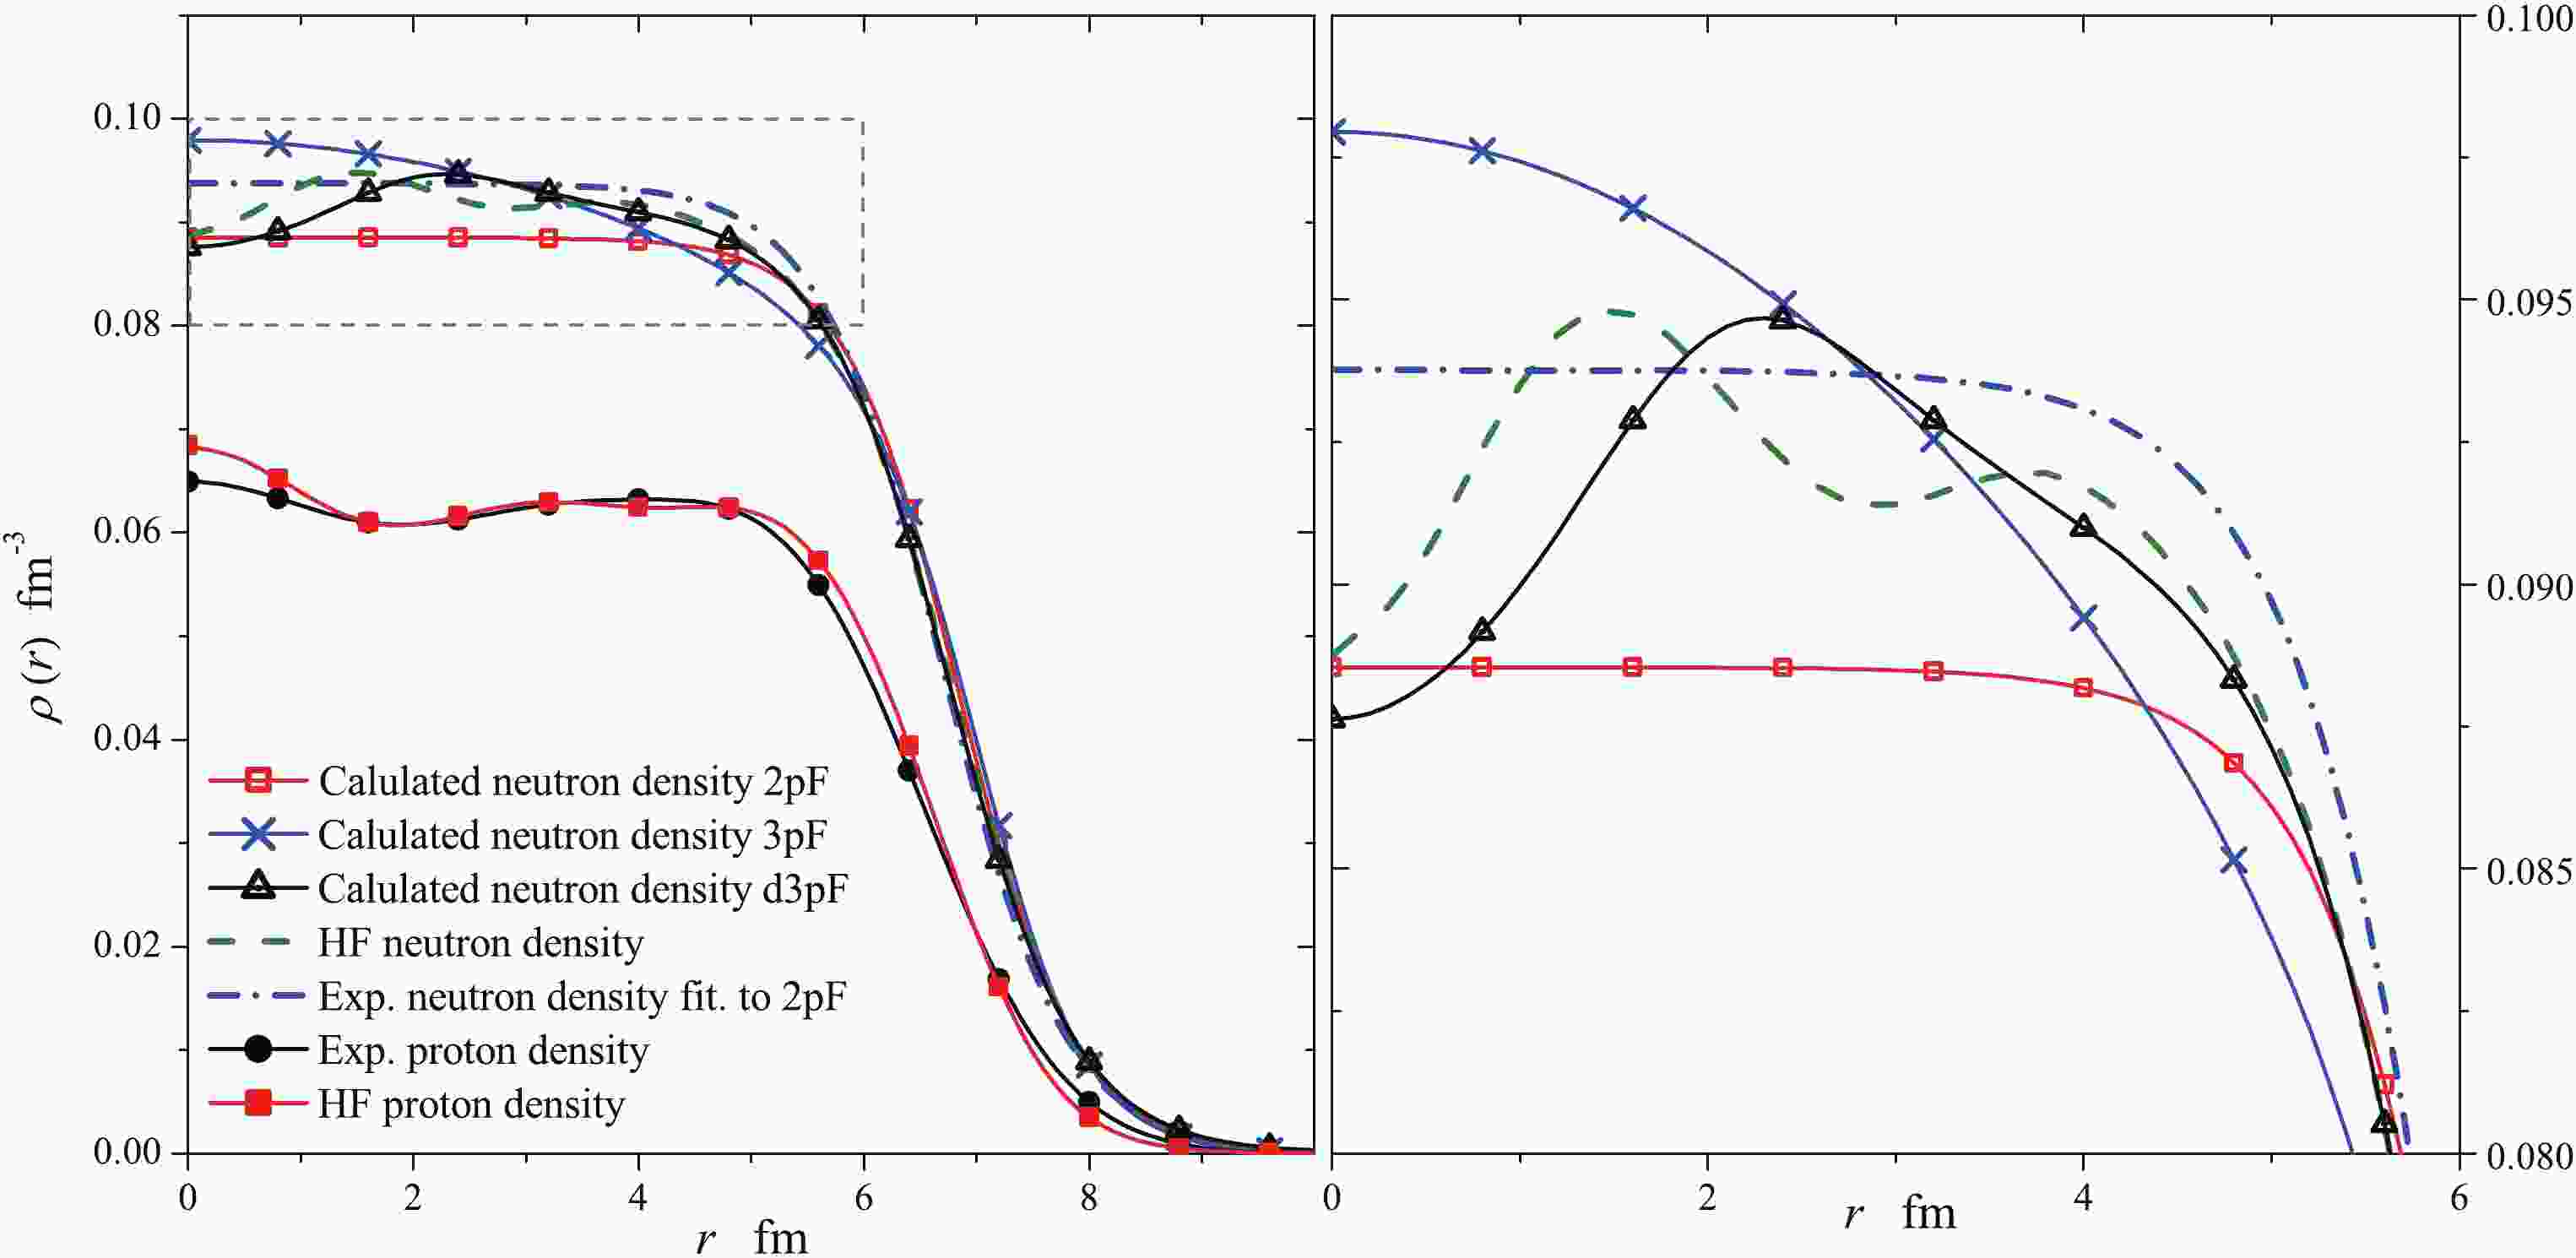
Figure 1 shows a comparison between the calculated neutron densities obtained from the total energy minimization and the neutron density obtained from the self-consistent Hartree–Fock (HF) calculation [56] for the 208Pb nucleus. HF density is considered for this comparison as HF calculation can reproduce the experimental proton density, as shown in Fig. 1. Moreover, there is no available model independent experimental data for the neutron density distribution of the 208Pb nucleus. The 2pF density is flat and almost constant around the center, while the 3pF density is raised at the center, and decreases continuously and smoothly for the whole profile. The maximum density for the 2pF and 3pF density distributions is obtained at the center of the nucleus. The d3pF shows fluctuations around the center with a maximum density at
$ r \approx 2.3 $ fm. The three density distributions demonstrate smooth tails with similar values for radii greater than$ 6 $ fm. The HF density demonstrate fluctuations around the center and maximum density at$ r \approx 1.4 $ fm.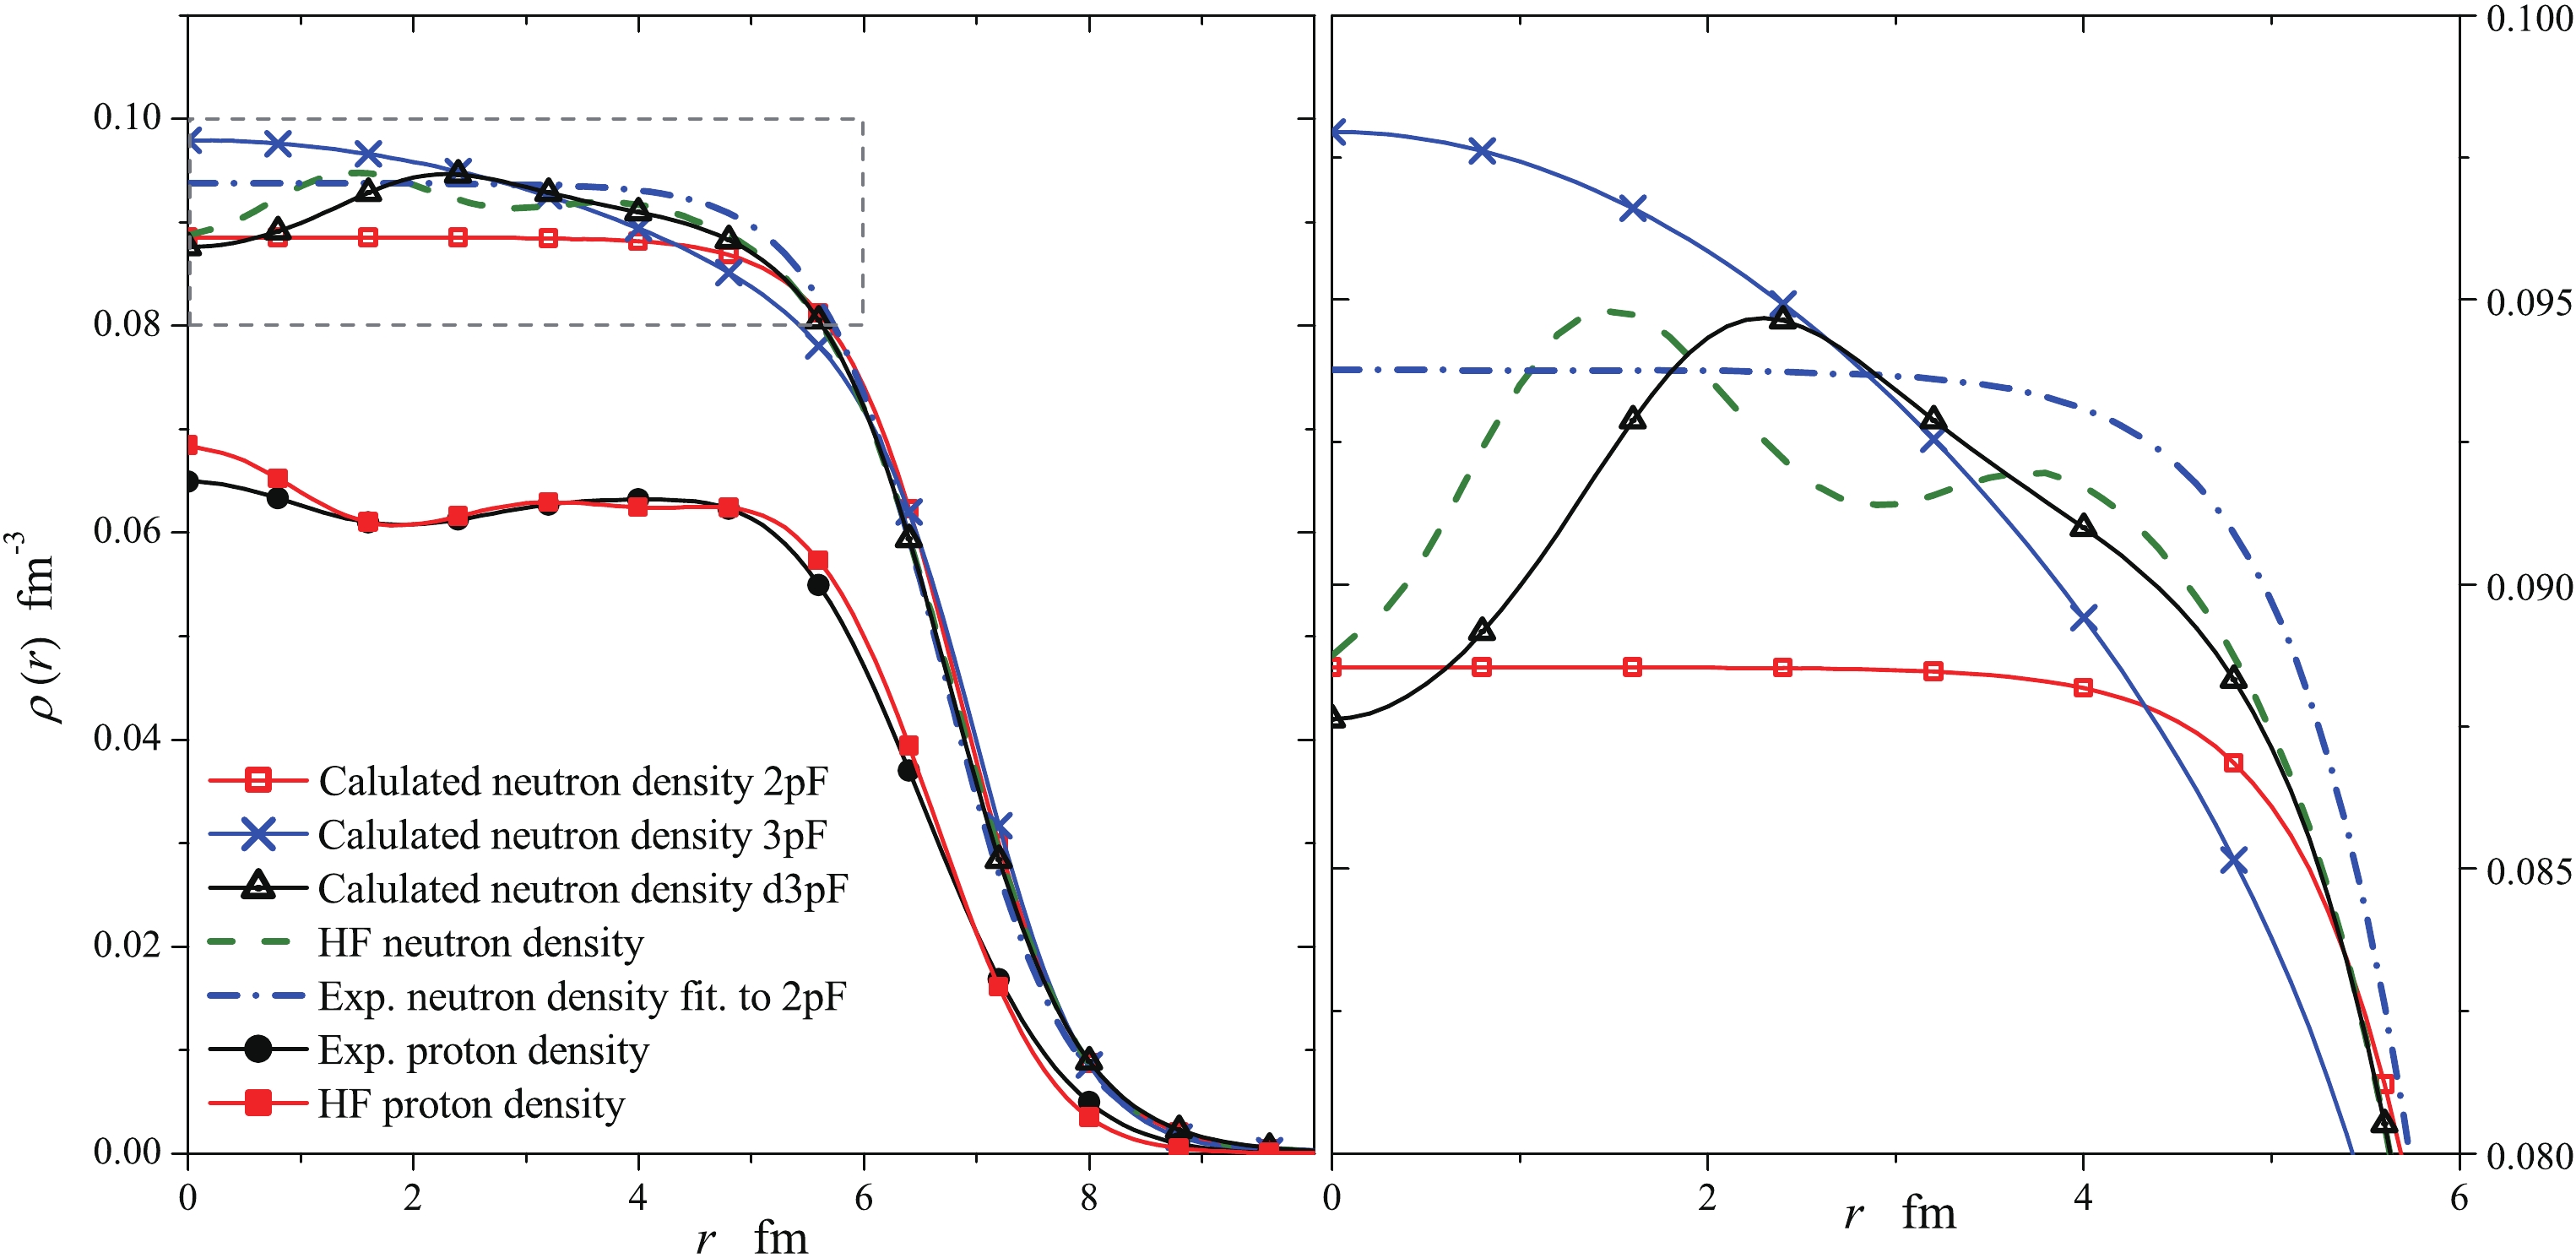
Figure 1. (color online) Experimental proton density [11] and calculated neutron density distributions of 208Pb. The proton and neutron density distributions based on the self-consistent HF calculation [56] and 2pF distribution based on the pion-photoproduction experiment [30] are shown for comparison.
For a precise comparison, the differences between the calculated neutron densities and corresponding HF density were calculated. Fig. 2 shows the distribution of the differences for the 2pF, 3pF, and d3pF formulae against the distance from the nuclear center. At the center, the 2pF distribution shows the smallest absolute difference, while the 3pF distribution shows the highest absolute difference. The range of difference, in fm−3, between the 2pF and HF densities is
$ -0.0063:0.0028 $ , and that between the 3pF and HF densities is$ -0.0036:0.0092 $ . In the case of d3pF, the difference range is almost symmetric near zero and has the smallest length. The distribution of differences can be better understood through statistical analysis because it reflects abstract information from all the data points, and not solely from the characteristic points. Table 2 lists certain statistical parameters for the differences between the calculated and HF densities based on the data generated for r values up to$ 12.0 $ fm in regular intervals of$ 0.1 $ fm. The maximum and minimum differences show the extreme values of difference for each dataset, which can be observed from Fig. 1.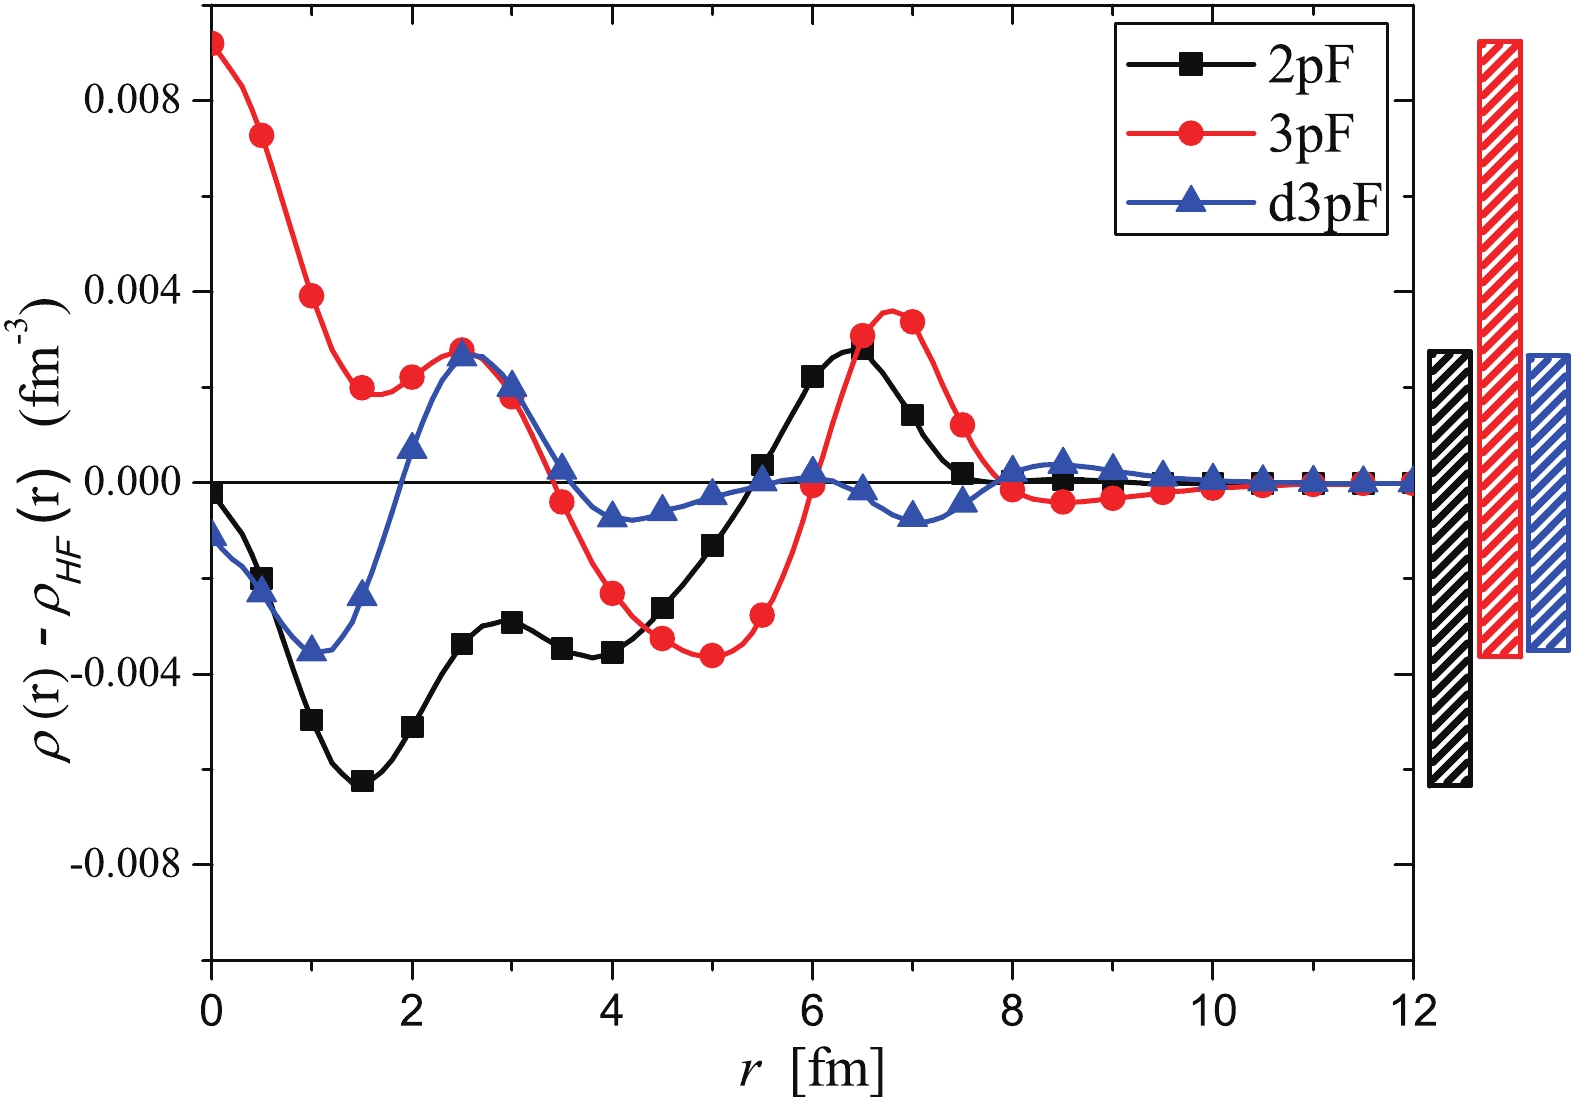
Figure 2. (color online) Differences between the calculated and HF neutron density distributions. The three bars on the right represent the difference between the highest and lowest values corresponding to the 2pF, 3pF, and d3pF distributions, respectively, from left to right.
Minimum Maximum Mean Sum Sum of squares 2pF −6.27E-3 2.81E-3 −1.20E-3 −0.14518 8.09E-4 3pF −3.63E-3 9.20E-3 7.82E-4 0.09457 9.77E-4 d3pF −3.54E-3 2.67E-3 −2.25E-4 −0.02726 1.90E-4 Table 2. Minimum, maximum, mean, sum, and sum of squares of the differences between the neutron densities calculated using the 2pF, 3pF, and d3pF formulae and corresponding HF density.
However, the extreme values cannot indicate the average or total difference between the HF distribution and other distributions. The mean difference for the 2pF density is
$ -1.20 \times 10^{-3} $ fm−3, indicating that it predicts lower density rather than the HF density for most of the data points. For 3pF, the mean difference is$ 7.82 \times 10^{-3} $ fm−3, which indicates that it predicts higher density rather than the HF density for most of the data points. The magnitude of mean difference for the 3pF distribution is 6 times greater than that of 2pF, which indicates that the density predicted by the 3pF formula is, on an average, farther from the HF density when compared with the density predicted by the 2pF formula. The mean difference for the d3pF density is$ -2.25 \times 10^{-4} $ fm−3, which is closer to zero than the other two densities. Thus, the d3pF formula predicts a neutron density close to the HF density, in terms of value and shape, better than 2pF and 3pF. The sum of the differences for each dataset demonstrates the distribution of the data points on either sides of the zero difference. The closer the sum of the differences is to zero, the more symmetric the distribution about zero. The values of the sum of the differences indicate that the differences in the d3pF distribution are more symmetric about zero than the other two distributions.The sum of the differences cannot indicate whether the difference values are, in total, large or small. To estimate the total difference, the amount of dispersion about the zero difference can be assessed by calculating the differences sum of squares. The differences sum of squares reflects the total absolute difference regardless of the direction. The values of the differences sum of squares for 2pF, 3pF, and d3pF are
$ 8.09 \times 10^{-4} $ ,$ 9.77 \times 10^{-4},$ and$ 1.90 \times 10^{-4} $ , respectively. Hence, the d3pF density shows the lowest dispersion about the HF density, followed by 2pF and 3pF, respectively. Although the 3pF formula enhances the calculation of the total energy compared with that of the 2pF, the 2pF formula demonstrates a better distribution for the 208Pb nucleus compared with that of the HF density. The d3pF formula outperformed the other two formulae in estimating the total energy and inferring a better density distribution. -
In this study, the neutron density distribution of the 208Pb nucleus is investigated assuming that the proton density distribution is constrained to its experimental distribution. The total energy surface in a seven dimensional space is calculated in the framework of a semi-microscopic approach based on the Skyrme interaction and Strutinsky's shell and pairing corrections. The neutron density distribution is considered in the form of 2pF, 3pF, and d3pF parameterized distributions. The ground state binding energy and neutron density distribution parameters are obtained from the energy surface for the three distributions considered in the study. As the number of degrees of freedom in the density formula increases, the calculated total energy decreases. The difference between the total energies calculated considering the 2pF and 3pF formulae is
$ 3.25 $ MeV, while the difference between the total energies calculated considering the 3pF and d3pF formulae is$ 1.09 $ MeV. Although the added energy owing to the d3pF formula in relatively small, it is significant because it allows for a central fluctuation.Comparing the three results with the experimental total energy, we determined that the difference between the calculated energy and experimental value decreases with an increase in the number of parameters. The smallest difference of 0.19 MeV is obtained in the case of d3pF.The calculated values of the rms radius correspond with the experimental values of the parity-violation and proton scattering experiments, while the neutron skin thickness values were smaller than the experimental values. The inferred d3pF neutron density distribution agrees with the pion-photoproduction experiment in the neutron skin thickness and diffused component of the distribution. A comprehensive comparison of the calculated neutron densities with the HF density showed that replacing 2pF with 3pF does not improve the overall density distribution predicted for the 208Pb nucleus. However, it improves the calculated total energy. Considering the d3pF density improves the calculated total energy and neutron density distribution.
The main objective of this study was to propose the use of reliable experimental findings to guide the results of theoretical calculations. The same principle can be applied to other theoretical models from the simplest to the most complex. Applying this principle on the semi-microscopic approach in this study fairly improved the neutron density of the 208Pb nucleus and ground state total energy. The approach of constricting to experimental values may yield more promising results with other models, but the proposed approach needs to be extensively studied to investigate its significance.
Investigation of neutron density distribution of 208Pb nucleus when the proton density is constrained to its experimental distribution
- Received Date: 2020-02-24
- Accepted Date: 2020-04-16
- Available Online: 2020-08-01
Abstract: In this study, two novel improvements for the theoretical calculation of neutron distributions are presented. First, the available experimental proton distributions are used as a constraint rather than inferred from the calculation. Second, the recently proposed distribution formula, d3pF, is used for the neutron density, which is more detailed than the usual shapes, for the first time in a nuclear structure calculation. A semi-microscopic approach for binding energy calculation is considered in this study. However, the proposed improvements can be introduced to any other approach. The ground state binding energy and neutron density distribution of 208Pb nucleus are calculated by optimizing the binding energy considering three different distribution formulae. The implementation of the proposed improvements leads to qualitative and quantitative improvements in the calculation of the binding energy and neutron density distribution. The calculated binding energy agrees with the experimental value, and the calculated neutron density exhibits fluctuations within the nuclear interior, which corresponds with the predictions of self-consistent approaches.


 DownLoad: