


 Abstract
 HTML
HTML Reference
 Related
 PDF
PDF


-
The quark model [1,2] predicts the existence of multiplets of baryon and meson states. Baryons containing two charm quarks and a light quark provide a unique system for testing the low-energy limit of quantum chromodynamics (QCD). The production of doubly charmed baryons at hadron colliders can be treated as two independent processes: production of a
$cc$ diquark followed by the hadronisation of the diquark into a baryon [3-9]. The production cross-section of doubly charmed baryons in proton-proton collisions at a centre-of-mass energy$\sqrt{s} = 13\;{\rm{TeV}}$ is predicted to be in the range 60–1800 nb [3-9], which is between$10^{-4}$ and$10^{-3}$ times that of the total charm production [4].A doubly charmed baryon was first reported by the SELEX collaboration [10,11]. They found that 20% of their
$\varLambda _c^ +$ yield originated from$\varXi _{cc}^ +$ decays, which is several orders of magnitude higher than theoretical prediction [4]. However, this signal has not been confirmed by searches performed at the FOCUS [12], BaBar [13], Belle [14], and LHCb [15,16] experiments. Recently, the LHCb collaboration observed a peak in the$\varLambda _c^ + {K^ - }{\pi ^ + }{\pi ^ + }$ mass spectrum at a mass of$3621.40 \pm 0.78\;{\rm{MeV}}/{c^2}$ [17], consistent with expectations for the$\varXi _{cc}^ {++}$ baryon. The$\varXi _{cc}^ {++}$ lifetime was measured to be$0.256^{+0.024}_{-0.022}\; ({\rm{stat}}) \;\pm 0.014$ $ \;({\rm{syst}})\;{\rm{ps}}$ [18], indicating that it decays through the weak interaction. A new decay mode,$\varXi _{cc}^{ + + } \to \varXi _c^ + {\pi ^ + }$ , was observed by the LHCb collaboration [19], and the measured$\varXi _{cc}^ {++}$ mass was found to be consistent with that measured using$\varXi _{cc}^{ + + } \to \varLambda _c^ + {K^ - }{\pi ^ + }{\pi ^ + }$ decays. The$\varXi _{cc}^{ + + } \to {D^ + }p{K^ - }{\pi ^ + }$ decay has been searched for, but no signal was found [20].This paper presents a measurement of
$\varXi _{cc}^{ + + }$ production in$pp$ collisions at a centre-of-mass energy of$\sqrt{s}=13\;{\rm{TeV}}$ , following the same analysis strategy as that used in Refs. [15,17,18]. The$\varXi _{cc}^ {++}$ production cross-section,$\sigma \left( {\varXi _{cc}^{ + + }} \right)$ , times the branching fraction of the$\varXi _{cc}^{ + + } \to \varLambda _c^ + {K^ - }{\pi ^ + }{\pi ^ + }$ decay, is measured relative to the prompt$\varLambda _c^ +$ production cross-section,$\sigma \left( {\varLambda _c^ + } \right)$ , in the transverse momentum range$4<{p_{\rm{T}}}<15\;{\rm{GeV}}/ c$ and the rapidity range$2.0<y<4.5$ . The data used correspond to an integrated luminosity of$1.7\;{\rm{f}}{{\rm{b}}^{ - 1}}$ collected by the LHCb experiment in 2016. The$\varLambda _c^ +$ baryon is reconstructed via the$\varLambda_{c}^{+} \rightarrow p K^{-} \pi^{+}$ decay. The inclusion of the charge-conjugate decay processes is implied throughout this paper. The production rate ratio is defined as,$ R \equiv \frac{{\sigma \left( {\varXi _{cc}^{ + + }} \right) \times {\cal B}\left( {\varXi _{cc}^{ + + } \to \varLambda _c^ + {K^ - }{\pi ^ + }{\pi ^ + }} \right)}}{{\sigma \left( {\varLambda _c^ + } \right)}} = \frac{{{N_{{\rm{sig}}}}}}{{{N_{{\rm{norm}}}}}}\frac{{{\varepsilon _{{\rm{norm}}}}}}{{{\varepsilon _{{\rm{sig}}}}}}, $

(1) where “sig” and “norm” refer to the signal (
$\varXi _{cc}^{ + + }$ ) and normalisation$\left( {\varLambda _c^ + } \right)$ modes, N is the signal yield and$\varepsilon$ is the total efficiency to reconstruct and select these decays. -
The LHCb detector [21,22] is a single-arm forward spectrometer covering the pseudorapidity range
$2<\eta <5$ , designed for the study of particles containing b or c quarks. The detector includes a high-precision tracking system consisting of a silicon-strip vertex detector surrounding the$pp$ interaction region [23], a large-area silicon-strip detector located upstream of a dipole magnet with a bending power of about 4 Tm, and three stations of silicon-strip detectors and straw drift tubes [24] placed downstream of the magnet. The tracking system provides a measurement of the momentum, p, of charged particles with a relative uncertainty that varies from 0.5% at low momentum to 1.0% at$200\;{\rm GeV}/c$ . The minimum distance of a track to a primary vertex, the impact parameter, is measured with a resolution of$(15+29/{p_{\rm{T}}})$ µm, where${p_{\rm{T}}}$ is expressed in${\rm GeV}/c $ . Different types of charged hadrons are distinguished using information from two ring-imaging Cherenkov detectors [25]. Photons, electrons and hadrons are identified by a calorimeter system consisting of scintillating-pad (SPD) and preshower detectors, an electromagnetic and a hadronic calorimeter. Muons are identified by a system composed of alternating layers of iron and multiwire proportional chambers [26]. The online event selection is performed by a trigger [27], which consists of a hardware stage, based on information from the calorimeters and muon systems [28,29], followed by a software stage, which applies a full event reconstruction incorporating near-real-time alignment and calibration of the detector [30]. The output of the reconstruction performed in the software trigger [31] is used as input to the present analysis.Simulated samples are required to develop the candidate selection and to estimate the efficiency of the detector acceptance and the imposed selection requirements. Simulated
$pp$ collisions are generated using Pythia [32] with a specific LHCb configuration [33]. A dedicated package, GenXicc2.0 [34], is used to simulate the$\varXi _{cc}^{ + + }$ baryon production. Decays of unstable particles are described by EvtGen [35], in which final-state radiation is generated using Photos [36]. The interaction of the generated particles with the detector, and its response, are simulated using the Geant4 toolkit [37] as described in Ref. [38]. -
The
$\varLambda _c^ + \to p{K^ - }{\pi ^ + }$ candidate is reconstructed through three charged particles identified as p,${K^ - }$ and${\pi ^ + }$ hadrons, which form a common vertex and do not originate from any primary vertex (PV) in the event. The decay vertex of the$\varLambda _c^ +$ candidate is required to be displaced from any PV by requiring its proper decay time to be greater than 0.15 ps, corresponding to about 1.5 times the$\varLambda _c^ +$ decay time resolution [39]. Each$\varLambda _c^ +$ candidate with mass in the range 2270-2306${\rm{MeV }}/c^2 $ is then combined with three additional particles to form a$\varXi _{cc}^{ + + }$ candidate. The three particles must form a common vertex with the$\varLambda _c^ +$ candidate and have hadron-identification information consistent with them being two${\pi ^ + }$ mesons and one${K^ - }$ meson. The$\varLambda _c^ +$ decay vertex is required to be downstream of the$\varXi _{cc}^{ + + }$ vertex. Additionally, the$\varXi _{cc}^ {++}$ candidates must have${p_{\rm{T}}} > 4 \;{\rm GeV}/c $ and originate from a PV.The combinatorial background is suppressed using two multivariate classifiers based on a boosted decision tree algorithm [40]. One classifier is optimised to select
$\varLambda _c^ +$ candidates irrespective of their origin, and the other is optimised to select$\varXi _{cc}^ {++}$ candidates. While both classifiers are applied to the signal channel, only the first is applied to the normalisation decay channel. The first classifier is trained with$\varLambda _c^ +$ signal in the simulated$\varXi _{cc}^ {++}$ sample and background candidates in the$\varLambda _c^ +$ mass sideband. The second classifier is trained using data candidates in the$\varLambda _c^ +$ and$\varXi _{cc}^ {++}$ signal mass region, where wrong-sign (WS)$\varLambda _c^ + {K^ - }{\pi ^ + }{\pi ^ - }$ combinations are used as proxy for the background. The first multivariate classifier is trained with the following variables: the$\chi^2$ of the$\varLambda _c^ +$ vertex fit; the largest distance of closest approach among the decay products; the scalar sum of the${p_{\rm{T}}}$ and the smallest${p_{\rm{T}}}$ of the three decay products of the$\varLambda _c^ +$ candidate; the smallest and largest$\chi _{{\rm{IP}}}^2$ of the decay products of the$\varLambda _c^ +$ candidate with respect to its PV. Here,$\chi _{{\rm{IP}}}^2$ is defined as the difference in$\chi^2$ of the PV fit with and without the particle in question. The PV of any single particle is defined to be that with respect to which the particle has the smallest$\chi _{{\rm{IP}}}^2$ . The second multivariate classifier is trained with the following variables: the$\chi _{{\rm{IP}}}^2$ of the$\varXi _{cc}^{ + + }$ candidate to its PV; the angle between the$\varXi _{cc}^{ + + }$ momentum and the direction from the PV to the$\varXi _{cc}^{ + + }$ decay vertex; the logarithm of the$\chi^2$ of the$\varXi _{cc}^ {++}$ flight distance between the$\varXi _{cc}^ {++}$ decay vertex and the PV; the vertex fit${\chi ^2}$ of the$\varXi _{cc}^{ + + }$ candidate; the${\chi ^2}$ of a kinematic refit [41] that requires the$\varXi _{cc}^{ + + }$ candidate to originate from a PV; the scalar sum of the${p_{\rm{T}}}$ and the smallest${p_{\rm{T}}}$ of the six final state tracks of the$\varXi _{cc}^{ + + }$ candidate. Here the flight distance$\chi^2$ is defined as the change in$\chi^2$ of the$\varXi _{cc}^ {++}$ decay vertex if it is constrained to coincide with the PV. Candidates retained for analysis must have two classifier responses exceeding thresholds chosen by performing a two-dimensional maximisation of the figure of merit$\varepsilon/(5/2+\sqrt{B})$ [42]. Here$\varepsilon$ and B are the estimated signal efficiency determined from signal simulation and background yield under the signal peak, respectively. The background is estimated from the WS sample. The same threshold of the first classifier, optimised for the signal mode, is applied to the normalisation mode.Finally, the
$\varXi _{cc}^{ + + }$ and$\varLambda _c^ +$ candidates are required to have their transverse momentum and rapidity in the fiducial ranges of 4-15${\rm GeV}/c $ and 2.0-4.5, respectively. After the multivariate selection is applied, events may still contain more than one$\varXi _{cc}^ {++}$ candidate in the signal region. Candidates made of duplicate tracks are removed by requiring all pairs of tracks with the same charge to have an opening angle larger than$0.5 \;{\rm{ mrad }}$ . Duplicate candidates, which are due to the interchange between identical particles from the$\varLambda _c^ +$ decay or directly from the$\varXi _{cc}^{ + + }$ decay (e.g., the${K^ - }$ particle from the$\varXi _{cc}^{ + + }$ decay and the${K^ - }$ particle from the$\varLambda _c^ +$ decay), can cause peaking structures in the$\varXi _{cc}^ {++}$ invariant mass distribution. In this case, one of the candidates is chosen at random to be retained and the others are discarded. The systematic uncertainty associated with this procedure is negligible. -
After the full selection is applied, the data sets are further filtered into two disjoint subsamples using information from the hardware trigger. The first contains candidates that are triggered by at least one of the
$\varLambda _c^ +$ decay products with high transverse energy deposited in the calorimeters, referred to as Triggered On Signal (TOS). The second consists of the events that are exclusively triggered by particles unrelated to the signal decay products; these events can, for example, be triggered by the decay products of the charmed hadrons produced together with the signal baryon, referred to as exclusively Triggered Independently of Signal (exTIS).To determine the
$\varXi _{cc}^ {++}$ baryon signal yields, an unbinned extended maximum-likelihood fit is performed simultaneously to the$\varLambda _c^ + {K^ - }{\pi ^ + }{\pi ^ + }$ invariant-mass spectra in the interval 3470-3770${\rm{MeV}}/c^2 $ of the two trigger categories. The mass distribution of the signal is described by the sum of a Gaussian function and a modified Gaussian function with power-law tails on both sides of the function [43] with a common peak position. The tail parameters and the relative fraction of the two Gaussian functions for the signal model are determined from simulation, while the common peak position and the mass resolution are allowed to vary in the fit. The background is described by a second-order Chebyshev polynomial. Fig. 1 shows the$\varLambda _c^ + {K^ - }{\pi ^ + }{\pi ^ + }$ invariant-mass distribution in data together with the fit results for the two trigger categories. The fit returns a mass of$3621.34 \pm 0.74 \;{\rm{MeV}}/ c^2 $ , and a mass resolution of$7.1 \pm 1.3 \;{\rm{MeV}}/c^2 $ , where the uncertainties are statistical only.
Figure 1. (color online) Invariant-mass distributions of
$\varXi _{cc}^{ + + }$ candidates (a) triggered by TOS and (b) triggered by exTIS, with fit results shown.The determination of the prompt
$\varLambda _c^ +$ baryon yields, which are contaminated by$\varLambda _c^ +$ candidates produced in b-hadron decays, is done in two steps [44]. First, a binned extended maximum-likelihood fit to the$m(pK^-{\pi ^ + })$ invariant-mass distribution in the interval 2220-2360${\rm{MeV}}/{c^2}$ is performed to determine the total number of$\varLambda _c^ +$ candidates. Then a binned extended maximum-likelihood fit to the background-subtracted${\log _{10}}\left( {\chi _{{\rm{IP}}}^2\left( {\varLambda _c^ + } \right)} \right)$ distribution is performed to separate the prompt$\varLambda _c^ +$ component from that originated in b-hadron decays. The mass distribution of$\varLambda _c^ +$ candidates is described by a sum of a Gaussian function and a modified Gaussian function with power-law tails on both sides with a common peak position. The background mass distribution is described by a first-order Chebyshev polynomial. The${\log _{10}}\left( {\chi _{{\rm{IP}}}^2\left( {\varLambda _c^ + } \right)} \right)$ distribution, after subtracting the combinatorial background using the sPlot technique [45], is described by two Bukin functions [46]. All the parameters except the peak position and resolution of the functions are derived from a fit to simulated signal. Figs. 2 and 3 show the$p K^- {\pi ^ + }$ invariant-mass distribution and${\log _{10}}\left( {\chi _{{\rm{IP}}}^2\left( {\varLambda _c^ + } \right)} \right)$ distributions in data together with the fit results for the two trigger categories. The signal yields for both the signal and the normalisation modes are presented in Table 1.Category $N_{\rm{sig}}$ 

$N_{\rm{norm} } \;[10^{3}]$ 

TOS $116 \pm 23$ 

$8764 \pm 6$ 

exTIS $210 \pm 29$ 

$13889 \pm 8$ 

Table 1. Yields of the signal and normalisation modes.
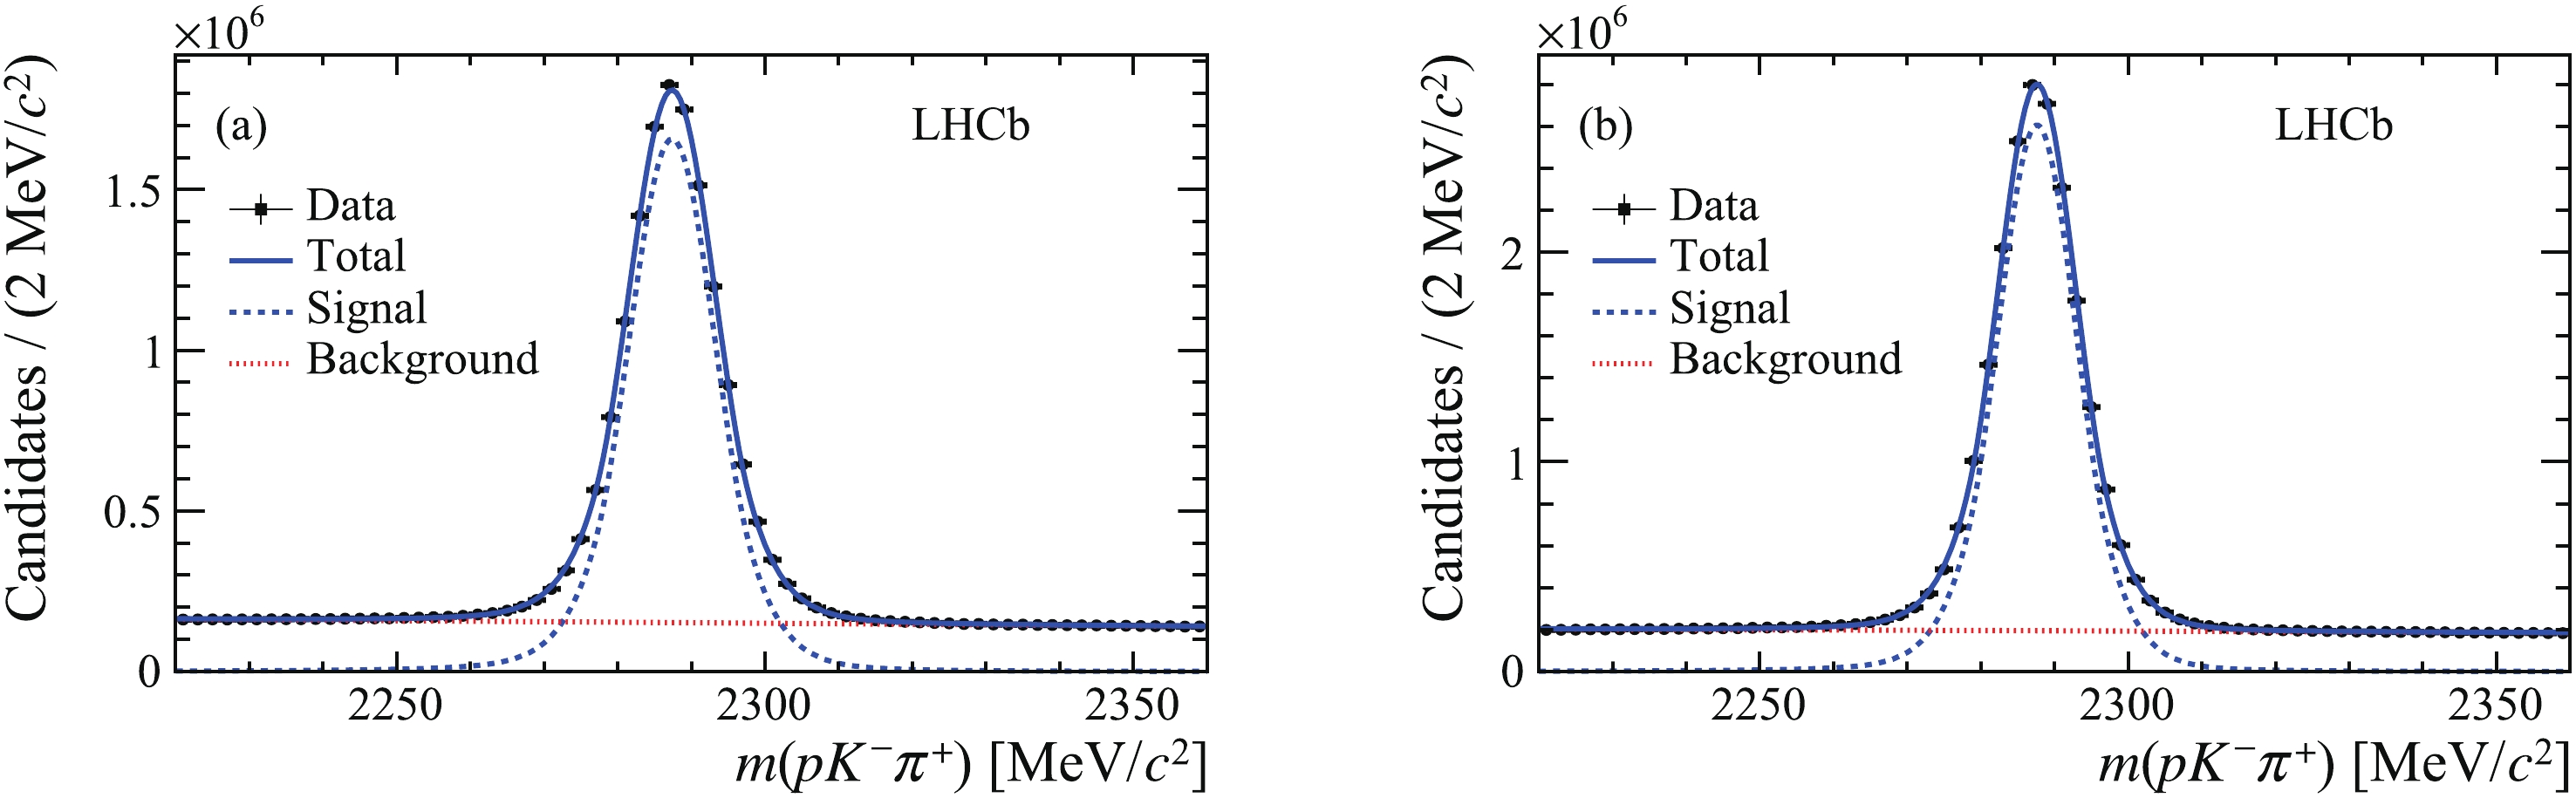
Figure 2. (color online) Invariant-mass distributions of
$\varLambda _c^ +$ candidates (a) triggered by TOS and (b) triggered by exTIS, with fit results shown.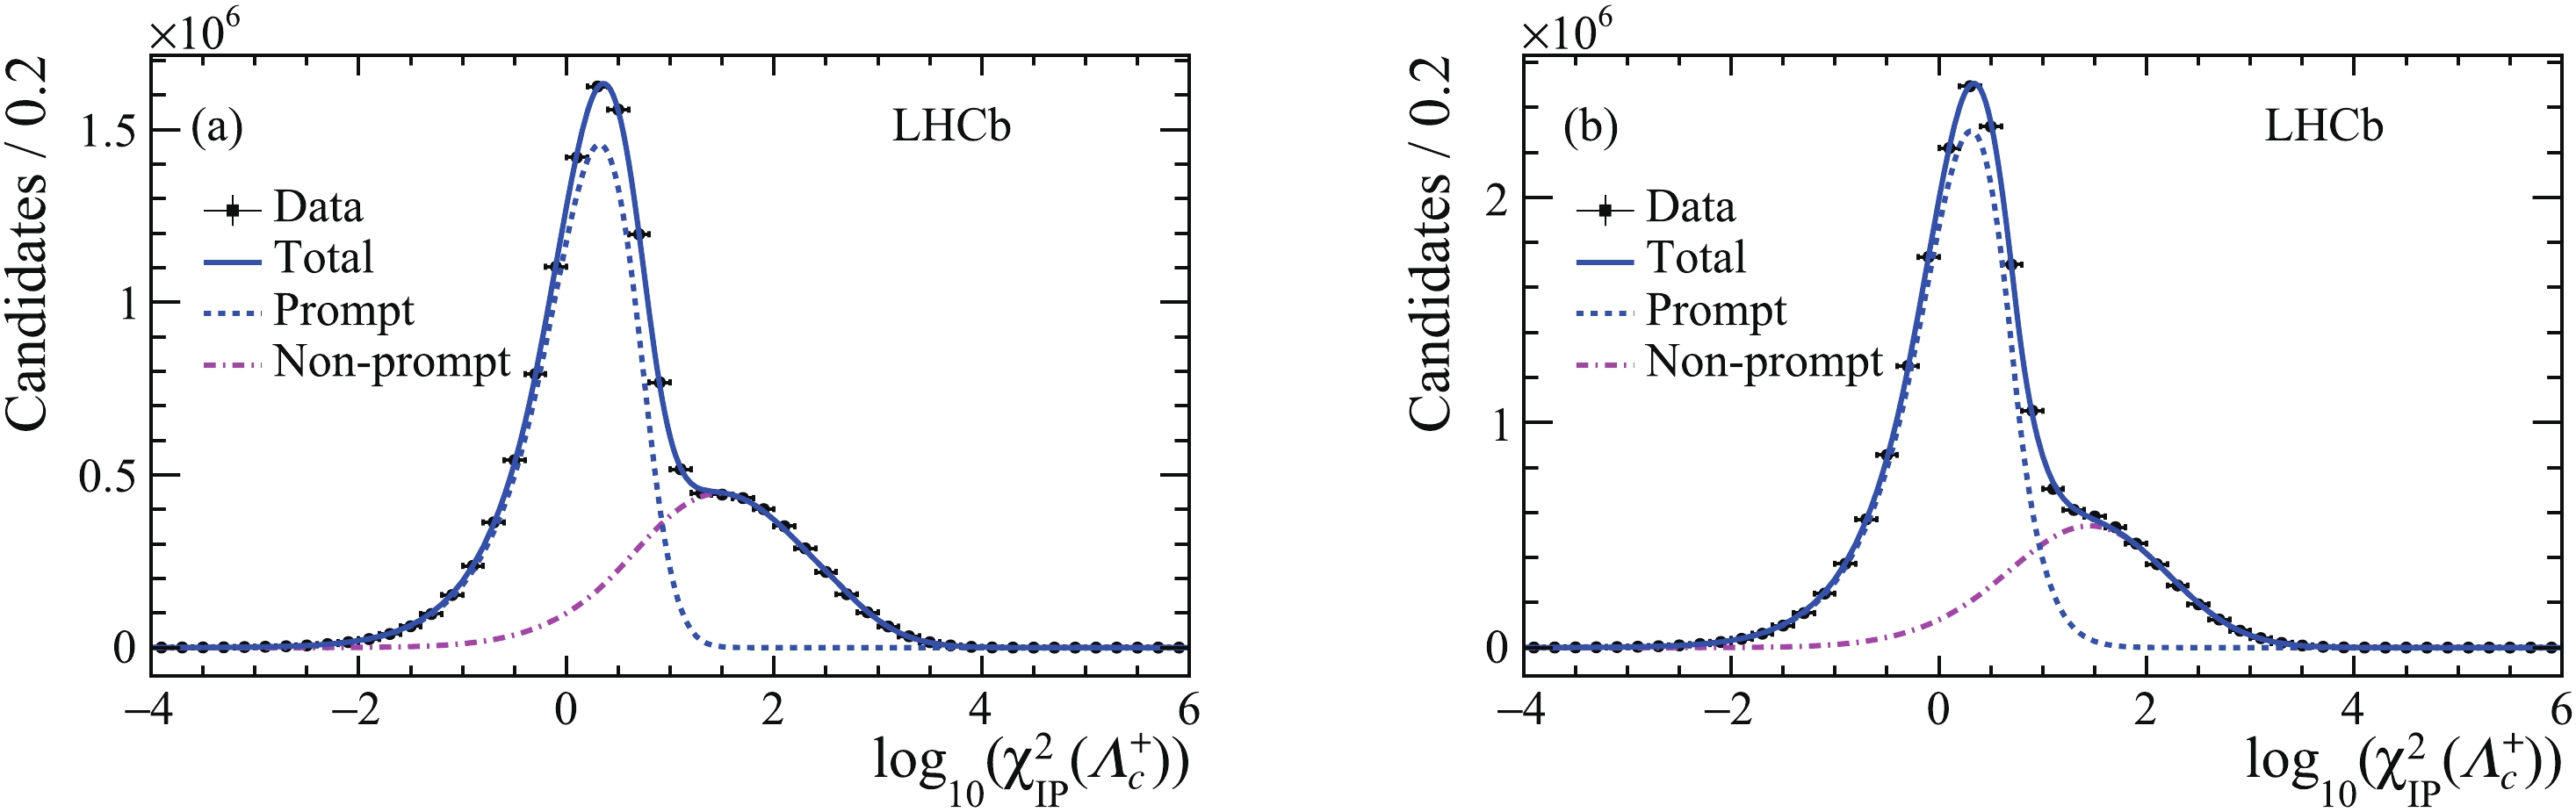
Figure 3. (color online) Distributions of
${\log _{10}}\left( {\chi _{{\rm{IP}}}^2\left( {\varLambda _c^ + } \right)} \right)$ for background-subtracted candidates (a) triggered by TOS and (b) triggered by exTIS, with fit results shown. -
For each trigger category and for both the signal and the normalisation channels, the total efficiencies are computed as products of the detector geometrical acceptance and of the efficiencies related to particle reconstruction, event selection, particle identification and trigger. All the efficiencies are calculated using simulation that is corrected using data. For both the signal and the normalisation modes, the kinematic distributions in simulation samples, including the transverse momentum and rapidity of the
$\varXi _{cc}^ {++}$ and$\varLambda _c^ +$ baryons and the event multiplicity, are weighted to match those in the corresponding data. The efficiencies are calculated under three lifetime$\left( {\tau _{\varXi _{cc}^{ + + }}} \right)$ hypotheses: the central value of the measured lifetime, and the lifetime increased or decreased by its measured uncertainty [18]. The dependence of the efficiency on the$\varXi _{cc}^{ + + }$ baryon lifetime is almost linear, with the efficiency ratio varying by 25% from the lower lifetime to the higher one. The resonant structures of the$\varLambda _c^ + \to p{K^ - }{\pi ^ + }$ decay are also weighted based on the background-subtracted data, as the simulation samples do not model well the structure seen in the data. The tracking efficiency is corrected with control data samples, as described in Ref. [47]. The particle-identification efficiency is corrected in bins of particle momentum, pseudorapidity and event multiplicity, using the results of a tag-and-probe method applied to calibration samples [48]. The efficiency ratios of the normalisation mode to the signal mode are presented in Table 2.Category $\varepsilon_{\rm{norm}}/\varepsilon_{\rm{sig}}$ 

$\tau_{\varXi _{cc}^{ + + }} = 0.230\;{\rm{ps}}$ 

$\tau_{\varXi _{cc}^{ + + }} = 0.256\;{\rm{ps}}$ 

$\tau_{\varXi _{cc}^{ + + }}= 0.284\;{\rm{ps}}$ 

TOS $22.00 \pm 1.09$ 

$19.50 \pm 1.71$ 

$17.50 \pm 1.50$ 

exTIS $16.64 \pm 1.30$ 

$14.56 \pm 1.06$ 

$12.95 \pm 0.80$ 

Table 2. Ratios of the normalisation and signal efficiencies.
-
The sources of systematic uncertainties affecting the measurement of the production ratio include the choice of the fit model and the evaluation of the total efficiency. The uncertainties are summarised in Table 3.
Source TOS [%] exTIS [%] Simulation sample size 8.8 7.3 Fit model 5.4 5.3 Hardware trigger 9.0 6.3 Tracking 3.4 3.4 Particle identification 5.5 5.4 Kinematic correction 7.3 6.0 Sum in quadrature 16.8 14.1 Table 3. Relative systematic uncertainties on the production ratio measurement for the two trigger categories.
For both the signal and normalisation modes, the uncertainties due to the choice of the particular fit model are estimated by using alternative functions where the signal is described by a sum of two Gaussian functions with a common peak position and the background is described by a second-order polynomial function. The difference in the ratio of signal yields between the two fits is assigned as systematic uncertainty. Additional effects coming from the
${\log _{10}}\left( {\chi _{{\rm{IP}}}^2\left( {\varLambda _c^ + } \right)} \right)$ fit are tested with alternative functions where the parameters used to describe the nonprompt signal are determined from a$\varLambda _b^0$ baryon data sample. The effect from the background subtraction is studied using the shape determined with the candidates in the$\varLambda _c^ +$ baryon mass sidebands.The limited size of the simulation samples leads to systematic uncertainties on the efficiencies. The systematic uncertainty due to the trigger selection efficiency is estimated with a tag-and-probe method exploiting a sample of events that are also triggered by particles unrelated to the signal candidate [27]. Due to the small sample size of the signal channel in data, two different control samples are used. The first sample comprises
$\varLambda _b^0 \to \varLambda _c^ + \pi^ -\pi^+ \pi^-$ decays, which are topologically similar to the$\varXi _{cc}^{ + + } \to \varLambda _c^ + {K^ - }{\pi ^ + }{\pi ^ + }$ decay. The second sample comprises$B_c^ + \to J/\psi {\pi ^ + }$ decays. This decay does not have the same topology but shares another feature with the signal: there should be at least two other heavy-flavour particles (b- or c-hadrons) produced in the same event that can be responsible for the trigger decision. The hardware trigger efficiencies of the$\varLambda _b^0$ ,$B_c^ +$ decay channels and prompt$\varLambda _c^ +$ channel, are measured using the tag-and-probe method. Similar selections to those applied to the signal channel are applied to both the data and simulation for the control samples. The efficiency ratio of the$\varLambda _b^0$ ,$B_c^ +$ decays to the$\varLambda _c^ +$ decays is estimated and the difference of the ratio in data and in simulation is assigned as a systematic uncertainty. The transverse-energy threshold in the calorimeter hardware trigger varied during data taking, and this variation is not fully described by the simulation. The threshold used in the simulated samples is higher than that applied to some data. To investigate the influence of this difference, the same hardware trigger requirement used in the simulation is applied to the data. The measurement is repeated and the change in the measured production ratio is taken as a systematic uncertainty.The systematic uncertainty related to the tracking efficiency includes three effects. First, the tracking efficiency depends on the detector occupancy, which is not well described by simulation. The distribution of the number of SPD hits in simulated samples is weighted to match that in data and an uncertainty of 0.8% per track is assigned to account for remaining difference in multiplicity between data and simulation [47]. Secondly, the uncertainty due to the finite size of the control samples is propagated to the final systematic uncertainty using a large number of pseudoexperiments. Finally, an uncertainty is assigned to the track reconstruction efficiency due to uncertainties on the material budget of the detector and on the modelling of hadronic interaction with the detector material.
The systematic uncertainty related to the particle-identification efficiency includes three effects. The effect from the limited size of calibration samples is evaluated with a large number of pseudoexperiments. Effects of binning in momentum, pseudorapidity and event multiplicity is evaluated by increasing or decreasing the bin sizes by a factor of two. In this estimation, the effects of the correlations between tracks on the particle identification performance are taken into account using simulated samples.
The uncertainties on the weights used for the correction of the kinematic distributions of the simulation samples are propagated as a systematic uncertainty on the production ratio.
-
The production-rate ratio is calculated for the TOS and the exTIS categories of events for three different
$\varXi _{cc}^ {++}$ lifetime scenarios using Eq. (1). The separate ratios in the TOS and exTIS categories are presented in Table 4 and are found to be consistent. The combination of the trigger categories, using the Best Linear Unbiased Estimate method [49] is also reported. In the combination, the systematic uncertainties coming from the simulation sample size and hardware trigger are assumed to be uncorrelated, while the other systematic uncertainties are considered to be 100% correlated.Category $R\; [10^{-4}]$ 

$\tau_{\varXi _{cc}^{ + + }} = 0.230\;{\rm{ps}}$ 

$\tau_{\varXi _{cc}^{ + + }} = 0.256\;{\rm{ps}}$ 

$\tau_{\varXi _{cc}^{ + + }} = 0.284\;{\rm{ps}}$ 

TOS $2.90 \pm 0.57 \pm 0.49$ 

$2.57 \pm 0.51 \pm 0.43$ 

$2.31 \pm 0.46 \pm 0.39$ 

exTIS $2.41 \pm 0.35 \pm 0.34$ 

$2.11 \pm 0.31 \pm 0.30$ 

$1.88 \pm 0.27 \pm 0.27$ 

Combined $2.53 \pm 0.30 \pm 0.33$ 

$2.22 \pm 0.27 \pm 0.29$ 

$1.98 \pm 0.23 \pm 0.26$ 

Table 4. Production rate ratio results for three different
$\varXi _{cc}^ {++}$ lifetime hypotheses. The first uncertainty is statistical and the second is systematic. -
A first measurement of the
$\varXi _{cc}^ {++}$ production cross-section relative to that of$\varLambda _c^ +$ baryons is presented. The ratio of$\varXi _{cc}^ {++}$ production cross-section times the branching fraction of the$\varXi _{cc}^{ + + } \to \varLambda _c^ + {K^ - }{\pi ^ + }{\pi ^ + }$ decay relative to the prompt$\varLambda _c^ +$ production cross-section in the kinematic region$4 <{p_{\rm T}}<15\;{\rm GeV}/c $ and$2.0<y<4.5$ is measured to be$(2.22\pm 0.27 \pm 0.29)\times 10^{-4}$ , assuming the central value of the$\varXi _{cc}^ {++}$ lifetime measured in Ref. [18], where the first uncertainty is statistical and the second systematic. This is the first measurement of the production of the doubly charmed baryons in$pp$ collisions and will deepen our understanding on their production mechanism.We thank Chao-Hsi Chang, Cai-Dian Lü, Xing-Gang Wu, and Fu-Sheng Yu for the discussions on the production and decays of double-heavy-flavour baryons. We express our gratitude to our colleagues in the CERN accelerator departments for the excellent performance of the LHC. We thank the technical and administrative staff at the LHCb institutes.
Measurement of ${{\varXi_{cc}^{++}}}$ production in pp collisions at ${\sqrt{ s}=13}$ TeV
- Received Date: 2019-10-25
- Available Online: 2020-02-01
Abstract: The production of


 DownLoad: