


 Abstract
 HTML
HTML Reference
 Related
 PDF
PDF


-
Integrated luminosity (L) is a basic quantity in high energy physics experiments. It reflects the size of the data sample, which is crucial to most of the physics studies in collider-based experiments. It is also the bridge between the number of produced events (N) and the cross section (σ) of any physics process:
$ N = L \cdot \sigma . $

(1) According to this relationship, with the integrated luminosity one can calculate the number of produced events from a known cross section or measure the cross section from a determined number of produced events. The precise measurement of integrated luminosity is thus fundamental to estimating experimental yields accurately and testing theoretical models precisely.
This paper presents a measurement of the integrated luminosity of the first
$ e^+e^- $ collision data sample collected with the Belle II detector [1]. The Belle II experiment runs at the SuperKEKB accelerator at the High Energy Accelerator Research Organization (KEK) in Tsukuba, Japan. Belle II [2] is a next-generation B-factory experiment [3]. It is the successor to the Belle experiment [4] and plans to record a dataset of 50 ab−1, which is about 50 times the Belle dataset. With these data, Belle II aims to search for physics beyond the Standard Model and further study CP violation in the flavor sector, and precisely measure all parameters of the Cabibbo-Kobayashi-Maskawa "unitarity triangle" [2]. The experiment will also study properties of the strong interaction in hadron physics.Operation of the SuperKEKB accelerator and the Belle II detector can be divided into three phases: Phase 1, from February to June 2016; Phase 2, from April to July 2018; and Phase 3, from March 2019 onwards. The data sample under study in this work was recorded during Phase 2. During this phase, the beams of electrons and positrons collided at the center-of-mass (CM) energy of the
$ \varUpsilon \left( {4{\rm{S}}} \right) $ resonance, with a peak instantaneous luminosity of$ 5.55 \times 10^{33} \;{\rm cm} ^{-2} {\rm s} ^{-1} $ , and the data sample was collected with a nearly complete Belle II detector. (The full vertex detector was not yet installed; see the next section for the detector description.) In the earlier Phase 1, the beams were circulated but not collided in the accelerator's storage rings for beam-line conditioning, accelerator performance tuning, and beam background studies [5]. In current and future Phase 3 running, copious data samples of beam-collision events are recorded for the comprehensive physics program of Belle II. The luminosity measurement of the collision data in Phase 2 is necessary for physics measurements with this data, and is valuable preparation for future measurements in Phase 3.In
$ e^+e^- $ collision experiments, the integrated luminosity is mainly measured according to Eq. (1) with the following two well-known quantum electrodynamics processes: Bhabha scattering$ e^+e^- $ $ \to $ $ e^+e^- $ (nγ) and digamma production$ e^+e^- \to \gamma\gamma $ (nγ) [6–11]. Here, nγ in the Bhabha process involves both the initial-state and final-state radiation photons, while nγ in the digamma process only refers to the initial-state radiation photons. These two processes have large production rates, accurate theoretical predictions for the cross sections, and simple event topologies that can be simulated precisely and selected with essentially no background contamination. These three features reduce the statistical and systematic uncertainties, making the Bhabha and digamma processes ideal for integrated luminosity measurements. In this work, we perform two independent measurements with these two processes; the separate measurements cross-check our methodology. -
The Belle II detector records the signals of the final state particles produced in
$ e^+e^- $ collisions to study the decays of B mesons, charmed particles, τ leptons, and$ \varUpsilon(n{\rm S}) $ ($ n = 1,2\cdots6 $ ) resonances as well as the production of new states of matter. It operates at the SuperKEKB accelerator, which is the upgraded version of the KEKB accelerator, a 3-km-circumference asymmetric-energy electron-positron collider with two storage rings: one for the electron beam, and the other for the positron beam. The two beams in SuperKEKB collide at a crossing angle of 83 mrad, larger than the crossing angle of 22 mrad in KEKB. Similar to KEKB, SuperKEKB is designed to work in the energy region from$ \varUpsilon \left( {1{\rm{S}}} \right) $ to$ \varUpsilon \left( {6{\rm{S}}} \right) $ and to operate mainly at the$ \varUpsilon \left( {4{\rm{S}}} \right) $ . The instantaneous luminosity goal of SuperKEKB is$ 8 \times 10^{35} \;{\rm cm} ^{-2} {\rm s} ^{-1} $ , which is about 40 times higher than that of KEKB. Notably, due to the asymmetric energies and acollinear orbits of the electron and positron beams, the coordinate system of the laboratory frame is significantly different from that of the CM frame. In particular, in the laboratory frame the z axis is along the bisector of the angle between the direction of the electron beam and the reverse direction of the positron beam, while in the CM frame the z axis is along the direction of the electron beam. Specifically, the z axis in the CM frame points at the same direction as the unit vector (0.1505, 0, 0.9886) in the laboratory frame.The Belle II detector surrounds the interaction point (IP), which is within a 1-cm radius beam pipe. It has a cylindrical structure aligned centrally to the z axis in the laboratory frame and consists of several nested sub-detectors and a superconducting solenoidal magnet. Six layers of vertex detectors (VXD), including two inner layers of silicon pixel detectors surrounded by four layers of silicon strip detectors, are designed to accurately reconstruct the decay vertices of B mesons and other short-lived particles. During Phase 2, only a small fraction of the VXD sensors were installed for diagnostic purposes, and the remainder of the VXD volume was instrumented with specialized radiation detectors for beam background measurements [12]. A small-cell, helium-based (50% He, 50%
$ {\rm C}_2{\rm H}_6 $ ) central drift chamber (CDC) is used to precisely measure the trajectories, momenta, and ionization energy losses of charged particles. A particle identification system, including an imaging time-of-propagation (TOP) detector in the barrel region and an aerogel ring imaging Cherenkov detector in the forward endcap region, is used to identify charged particles. An electromagnetic calorimeter (ECL), composed of 8736 CsI(Tl) crystals arranged in a barrel and two endcaps, detects photons and provides discrimination of electrons from hadrons — in particular, pions. The closely-packed crystals are designed with a tower structure pointing to the IP, but are tilted by$ 2.5^{\circ} $ in θ and ϕ from the radial line to the IP to avoid the possibility that a photon (or electron) could travel along an inter-crystal gap without showering. A superconducting solenoid magnet provides a 1.5 T magnetic field for the measurement of the momenta of charged particles. The$ K_L^0 $ and muon detector is a "sandwich" of alternating layers of 4.7-cm-thick iron plates and 4.4-cm-thick active detector elements. The latter consists of scintillator strips read out by silicon photomultipliers in the endcap and innermost barrel layers, and glass-electrode resistive plate chambers in the outer barrel layers. This detector is used for the identification of high momentum muons and the detection of$ K_L^0 $ mesons. The Belle II detector is described in detail elsewhere [1].In Bhabha and digamma events, the final-state particles are electrons, positrons, and photons; thus the sub-detectors most vital for the measurements are the VXD, CDC, and ECL. Since the VXD acceptance was quite limited and the CDC tracking efficiency was relatively low in Phase 2, luminosity measurements using ECL information alone are presented in this paper. To avoid the uninstrumented gaps between the ECL barrel and endcap regions where the material model in the Monte Carlo (MC) simulation was not well-defined, only information from the ECL barrel region is used in the measurements.
-
To determine detection efficiencies, five million Bhabha events and one million digamma events were simulated at the peak energy of the
$ \varUpsilon \left( {4{\rm{S}}} \right) $ resonance with a CM beam energy spread of 5 MeV [13] using the BABAYAGA@NLO [14-17] generator. The MC samples were generated in the polar angle range$ 35^{\circ} -145 ^{\circ} $ in the CM frame, somewhat broader than the acceptance of the ECL barrel region, to avoid spurious edge effects. Along with the generation of the samples, the theoretical cross sections of Bhabha and digamma processes ($ \sigma_{\rm ee} $ and$ \sigma_{{\rm{\gamma}}{\rm{\gamma}}} $ ) were evaluated using the same generator with the same input parameters. The cross sections were calculated to be$ \sigma_{\rm ee} = 17.37 $ nb and$ \sigma_{{\rm{\gamma}}{\rm{\gamma}}} = 1.833 $ nb with a claimed precision of 0.1% [14-17].To estimate background levels, the following MC samples were also produced at the peak energy of the
$ \varUpsilon \left( {4{\rm{S}}} \right) $ resonance: one million$ \mu^+\mu^- $ events with the BABAYAGA@NLO generator; one million two-photon events in the$ e^{+}e^{-}e^{+}e^{-} $ final state with the AAFH [18–20] generator; 50-$ {\rm{fb}}^{-1} $ -equivalent of$ B^{+}B^{-} $ and$ B^0\bar{B^0} $ events decayed with EVTGEN 1.3 [21] for exclusive modes and PYTHIA 8.2 [22] for inclusive modes; 50-$ {\rm{fb}}^{-1} $ -equivalent of$ c\bar{c} $ ,$ s\bar{s} $ ,$ u\bar{u} $ , and$ d\bar{d} $ events produced with KKMC 4.15 [23, 24] and decayed with EVTGEN 1.3 and PYTHIA 8.2; and 50-$ {\rm{fb}} ^{-1} $ -equivalent of$ \tau^+\tau^- $ events also produced with KKMC 4.15 but decayed with TAUOLA [25].In order to simulate the interaction of final-state particles with the detector, the generated MC samples were used as input for a GEANT4-based MC simulation program [26], which includes the geometric description and response of the detector. In the simulation, beam backgrounds, such as those arising from the Touschek effect and beam-gas interactions, were overlaid on the
$ e^+e^- $ collision events. The beam backgrounds were first simulated with dedicated accelerator-design software [27], and then processed by GEANT4 to handle the interactions of the primary beam-background particles with the accelerator and detector material [28]. Notably, a complete simulation of the material in the VXD region, including the cables, electronics, and support structure, was not yet available at this early stage of the experiment. The unsimulated material is conservatively estimated to be 20% of the simulated material, and its impact on the measured luminosities is discussed in Section 6.Both the data and MC samples were reconstructed and analyzed with the Belle II analysis software framework, basf2 [29].
-
To determine the integrated luminosity of the data sample, we first select the signals, namely Bhabha and digamma events. For this purpose, we require that candidate events have at least two ECL clusters, and we subsequently identify the two clusters with the largest energies in the CM frame. Because the ECL energies for the electrons and positrons of Bhabha events, and the photons of digamma events, tend to be distributed near half the CM energy, the higher energy of the two clusters in the CM frame is required to be less than 5.82 GeV, and the lower energy of the pair is required to be greater than 2 GeV. To guarantee that the two clusters are well reconstructed within the ECL barrel region, their polar angles, i.e. those of the position vectors of the cluster centers (similar definition applies to their azimuthal angles), in the laboratory frame are required to be in the range
$ 37.8^{\circ} $ –$ 120.5^{\circ} $ . Since the final-state particles in Bhabha and digamma events are back to back, the acollinearity of the two clusters in polar angle, namely the absolute difference between$ 180^{\circ} $ and the sum of the two polar angles in the CM frame, is required to be less than$ 5^{\circ} $ . Because of the deflection of electrons and positrons in the magnetic field, the acollinearity of the two clusters in azimuthal angle, namely the absolute difference between$ 180^{\circ} $ and the absolute difference of the two azimuthal angles in the CM frame, which peaks around$ 8^{\circ} $ , is required to be in the range$ 2.5^{\circ} $ –$ 13^{\circ} $ for Bhabha events. Since photons are not affected by the magnetic field, the acollinearity in azimuthal angle in the CM frame is required to be less than$ 2.5^{\circ} $ to select digamma events. Because the requirements on azimuthal acollinearity do not fully separate Bhabha and digamma events, we refer to the measurements made from each selection as the Bhabha-dominant or digamma-dominant, respectively. In summary, the selection criteria are as follows. The common requirements for the two measurements are● 2 GeV
$ <{\rm E}_{\rm cm}^{\rm max2}<{\rm E}_{\rm cm}^{\rm max1}< $ 5.82 GeV,●
$ 37.8^{\circ}<\theta_{\rm lab}^{{\rm max}1} $ ,$ \theta_{\rm lab}^{{\rm max}2}<120.5^{\circ} $ , and●
$ |\theta_{\rm cm}^{\rm max1}+\theta_{\rm cm}^{\rm max2}-180^\circ|<5^{\circ} $ .Bhabha-dominant events are further selected with
●
$ 2.5^{\circ}<||\phi_{\rm cm}^{\rm max1}-\phi_{\rm cm}^{\rm max2}|-180^\circ|<13^{\circ} $ ,and digamma-dominant events are further selected with
●
$ ||\phi_{\rm cm}^{\rm max1}-\phi_{\rm cm}^{\rm max2}|-180^\circ|<2.5^{\circ} $ .Here, E, θ, and ϕ denote the energy, polar angle, and azimuthal angle of a cluster. The subscript cm (lab) denotes the CM (laboratory) frame, and the superscript max1 (max2) identifies the cluster with the largest (second-largest) energy.
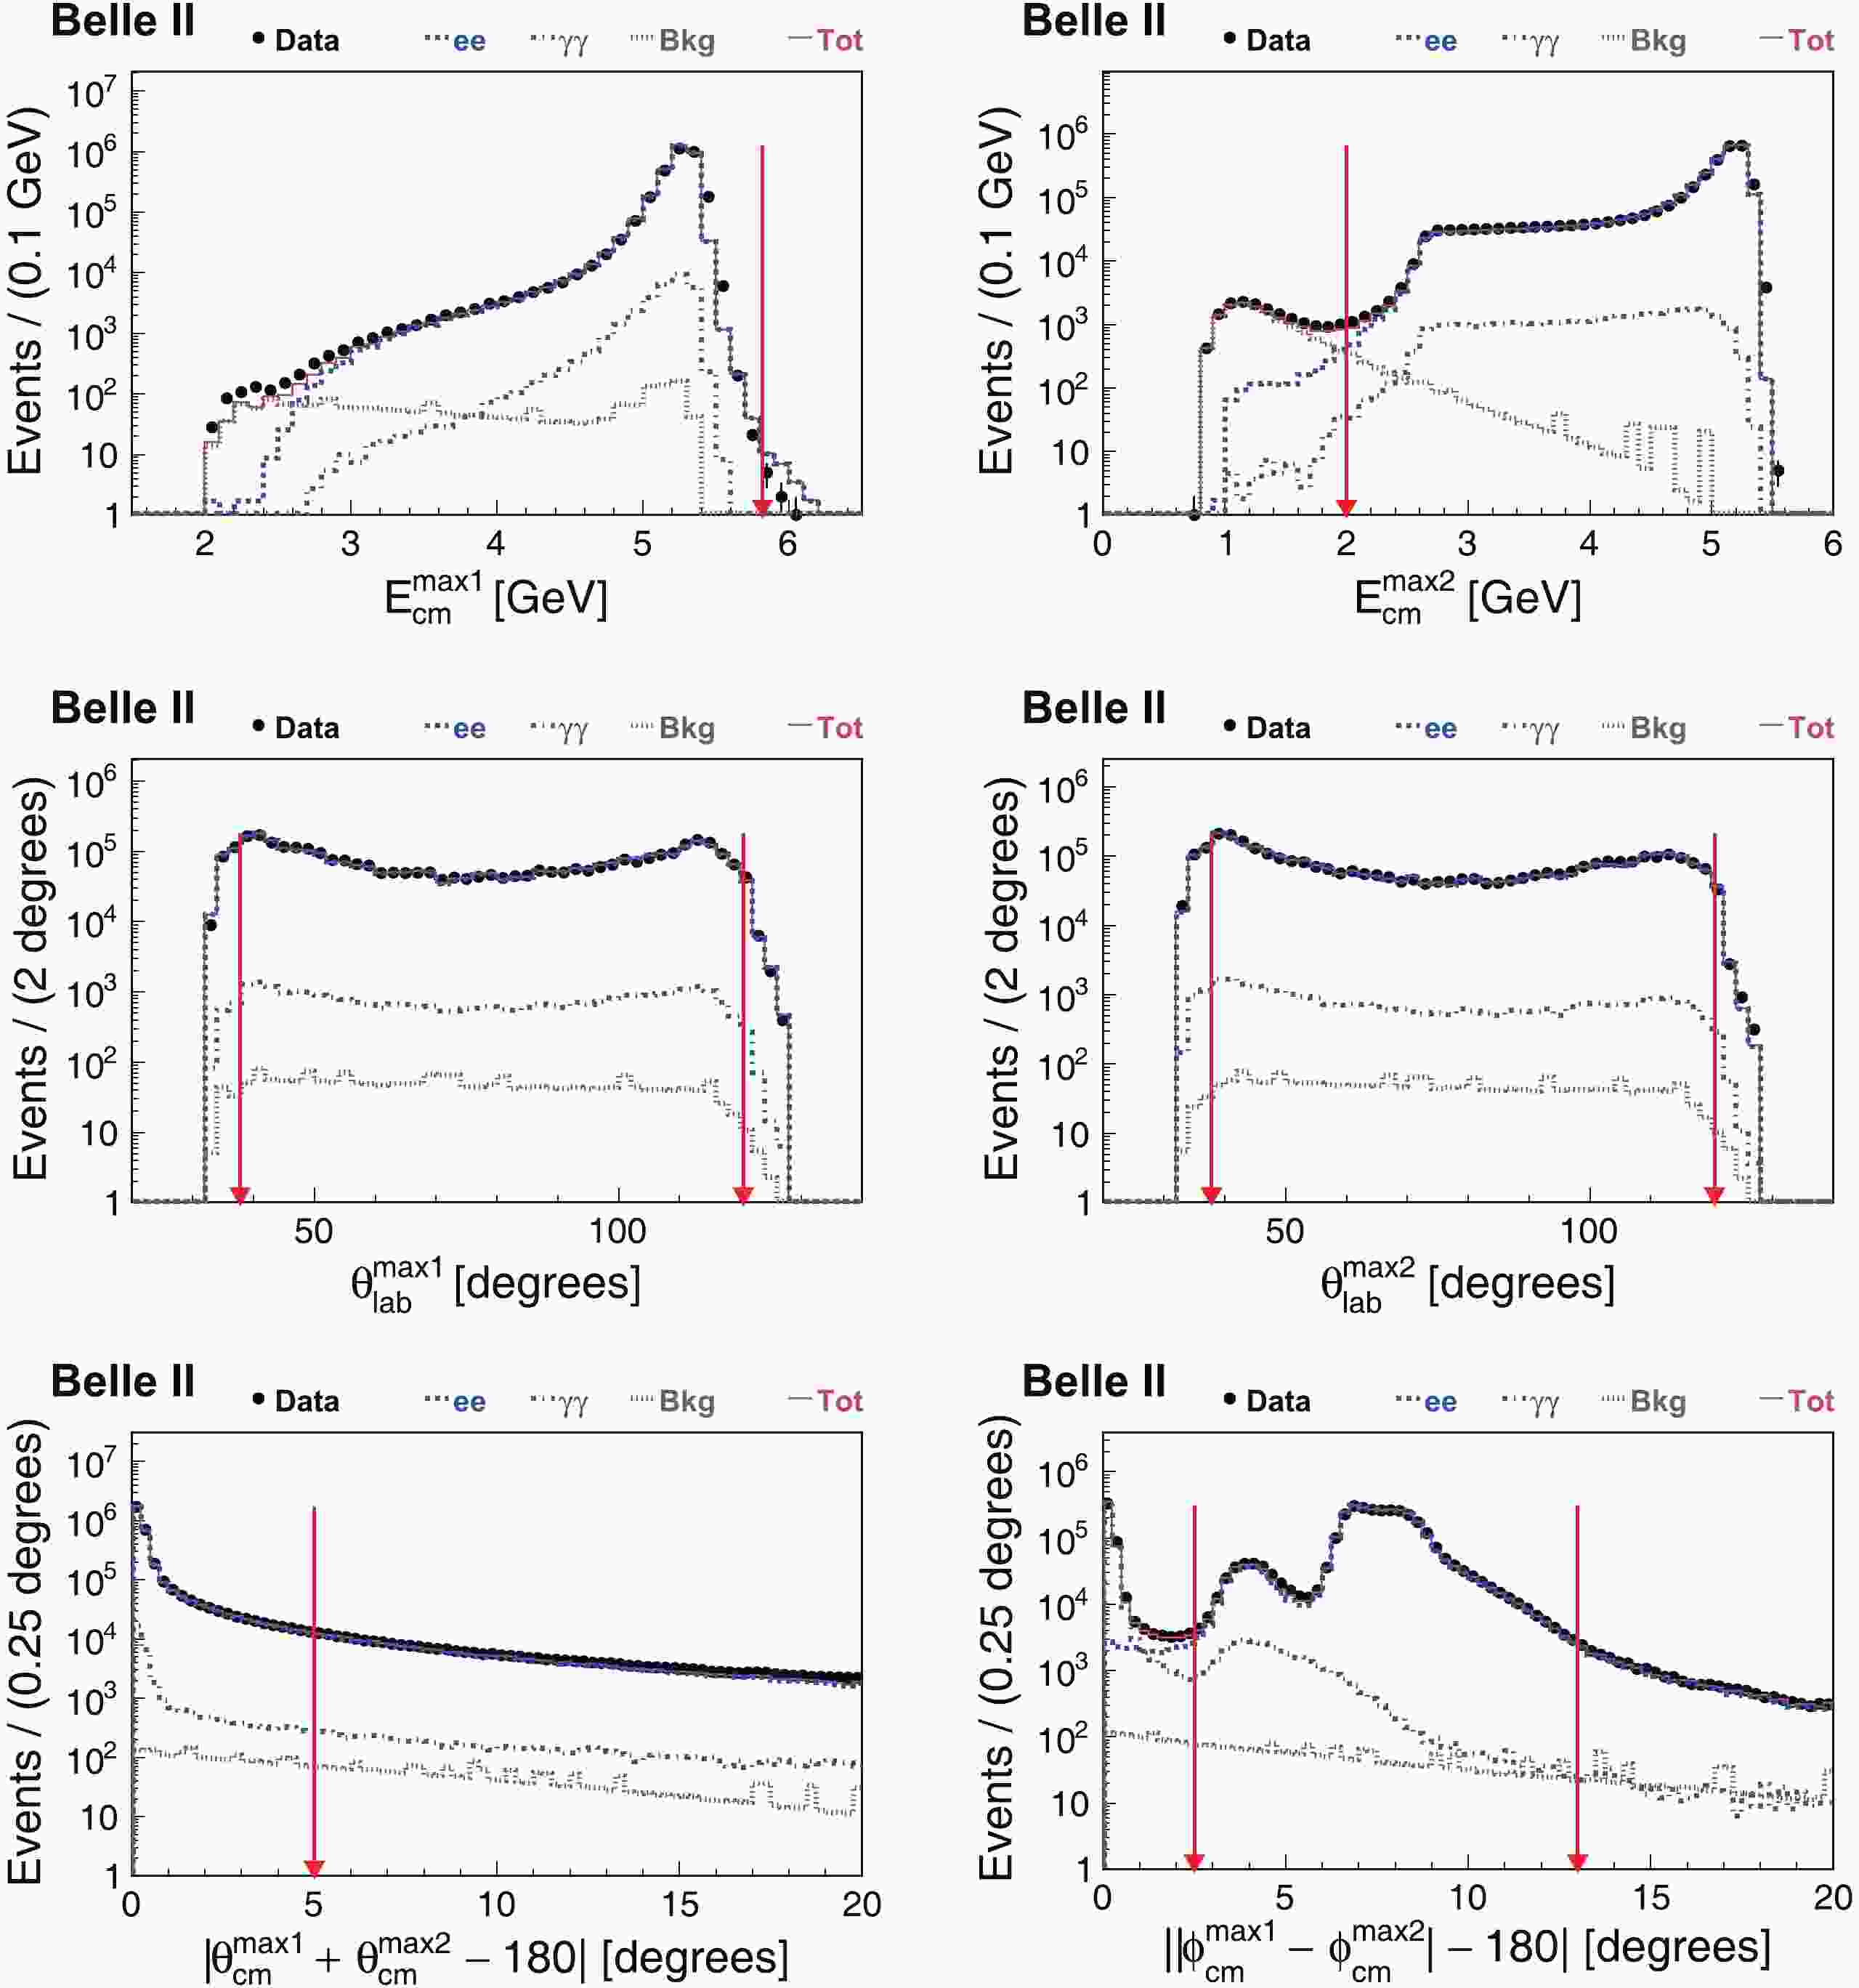
The criteria presented above are chosen on the basis of the distributions in Figs. 1 and 2, which demonstrate the close agreement of the distributions between the data and MC samples for Bhabha-dominant and digamma-dominant measurements, respectively. Each plot in the figures shows one quantity in the selection criteria and is drawn with the requirements on all other quantities applied. For example, the top-left plot in Fig. 1 shows the
$ {\rm E}_{\rm cm}^{\rm max1} $ distribution for events that satisfy the requirements on$ {\rm E}_{\rm cm}^{\rm max2} $ ,$ \theta_{\rm lab}^{{\rm max}1} $ ,$ \theta_{\rm lab}^{{\rm max}2} $ ,$ |\theta_{\rm cm}^{\rm max1}+\theta_{\rm cm}^{\rm max2}-180^\circ| $ , and$ ||\phi_{\rm cm}^{\rm max1}-\phi_{\rm cm}^{\rm max2}|-180^\circ| $ . In the figures, the luminosities of the MC samples are first normalized to a common reference luminosity and then normalized as a whole to the number of events in the data sample in each plot.
Figure 1. (color online) Comparisons of the distributions of Bhabha-dominant signal candidates between the data and MC samples. Each plot in the figure shows one quantity in the selection criteria and is drawn with the requirements on all other quantities applied. In the legend, "Data" represents the data sample, while "ee", "
$\gamma\gamma$ ", "Bkg", and "Tot" denote the Bhabha, digamma, background ($\mu^+\mu^-$ ,$e^{+}e^{-}e^{+}e^{-}$ ,$B^{+}B^{-}$ ,$B^0\bar{B^0}$ ,$c\bar{c}$ ,$s\bar{s}$ ,$u\bar{u}$ ,$d\bar{d}$ , and$\tau^+\tau^-$ ), and total MC samples, respectively. The vertical arrows indicate the regions of the selected events.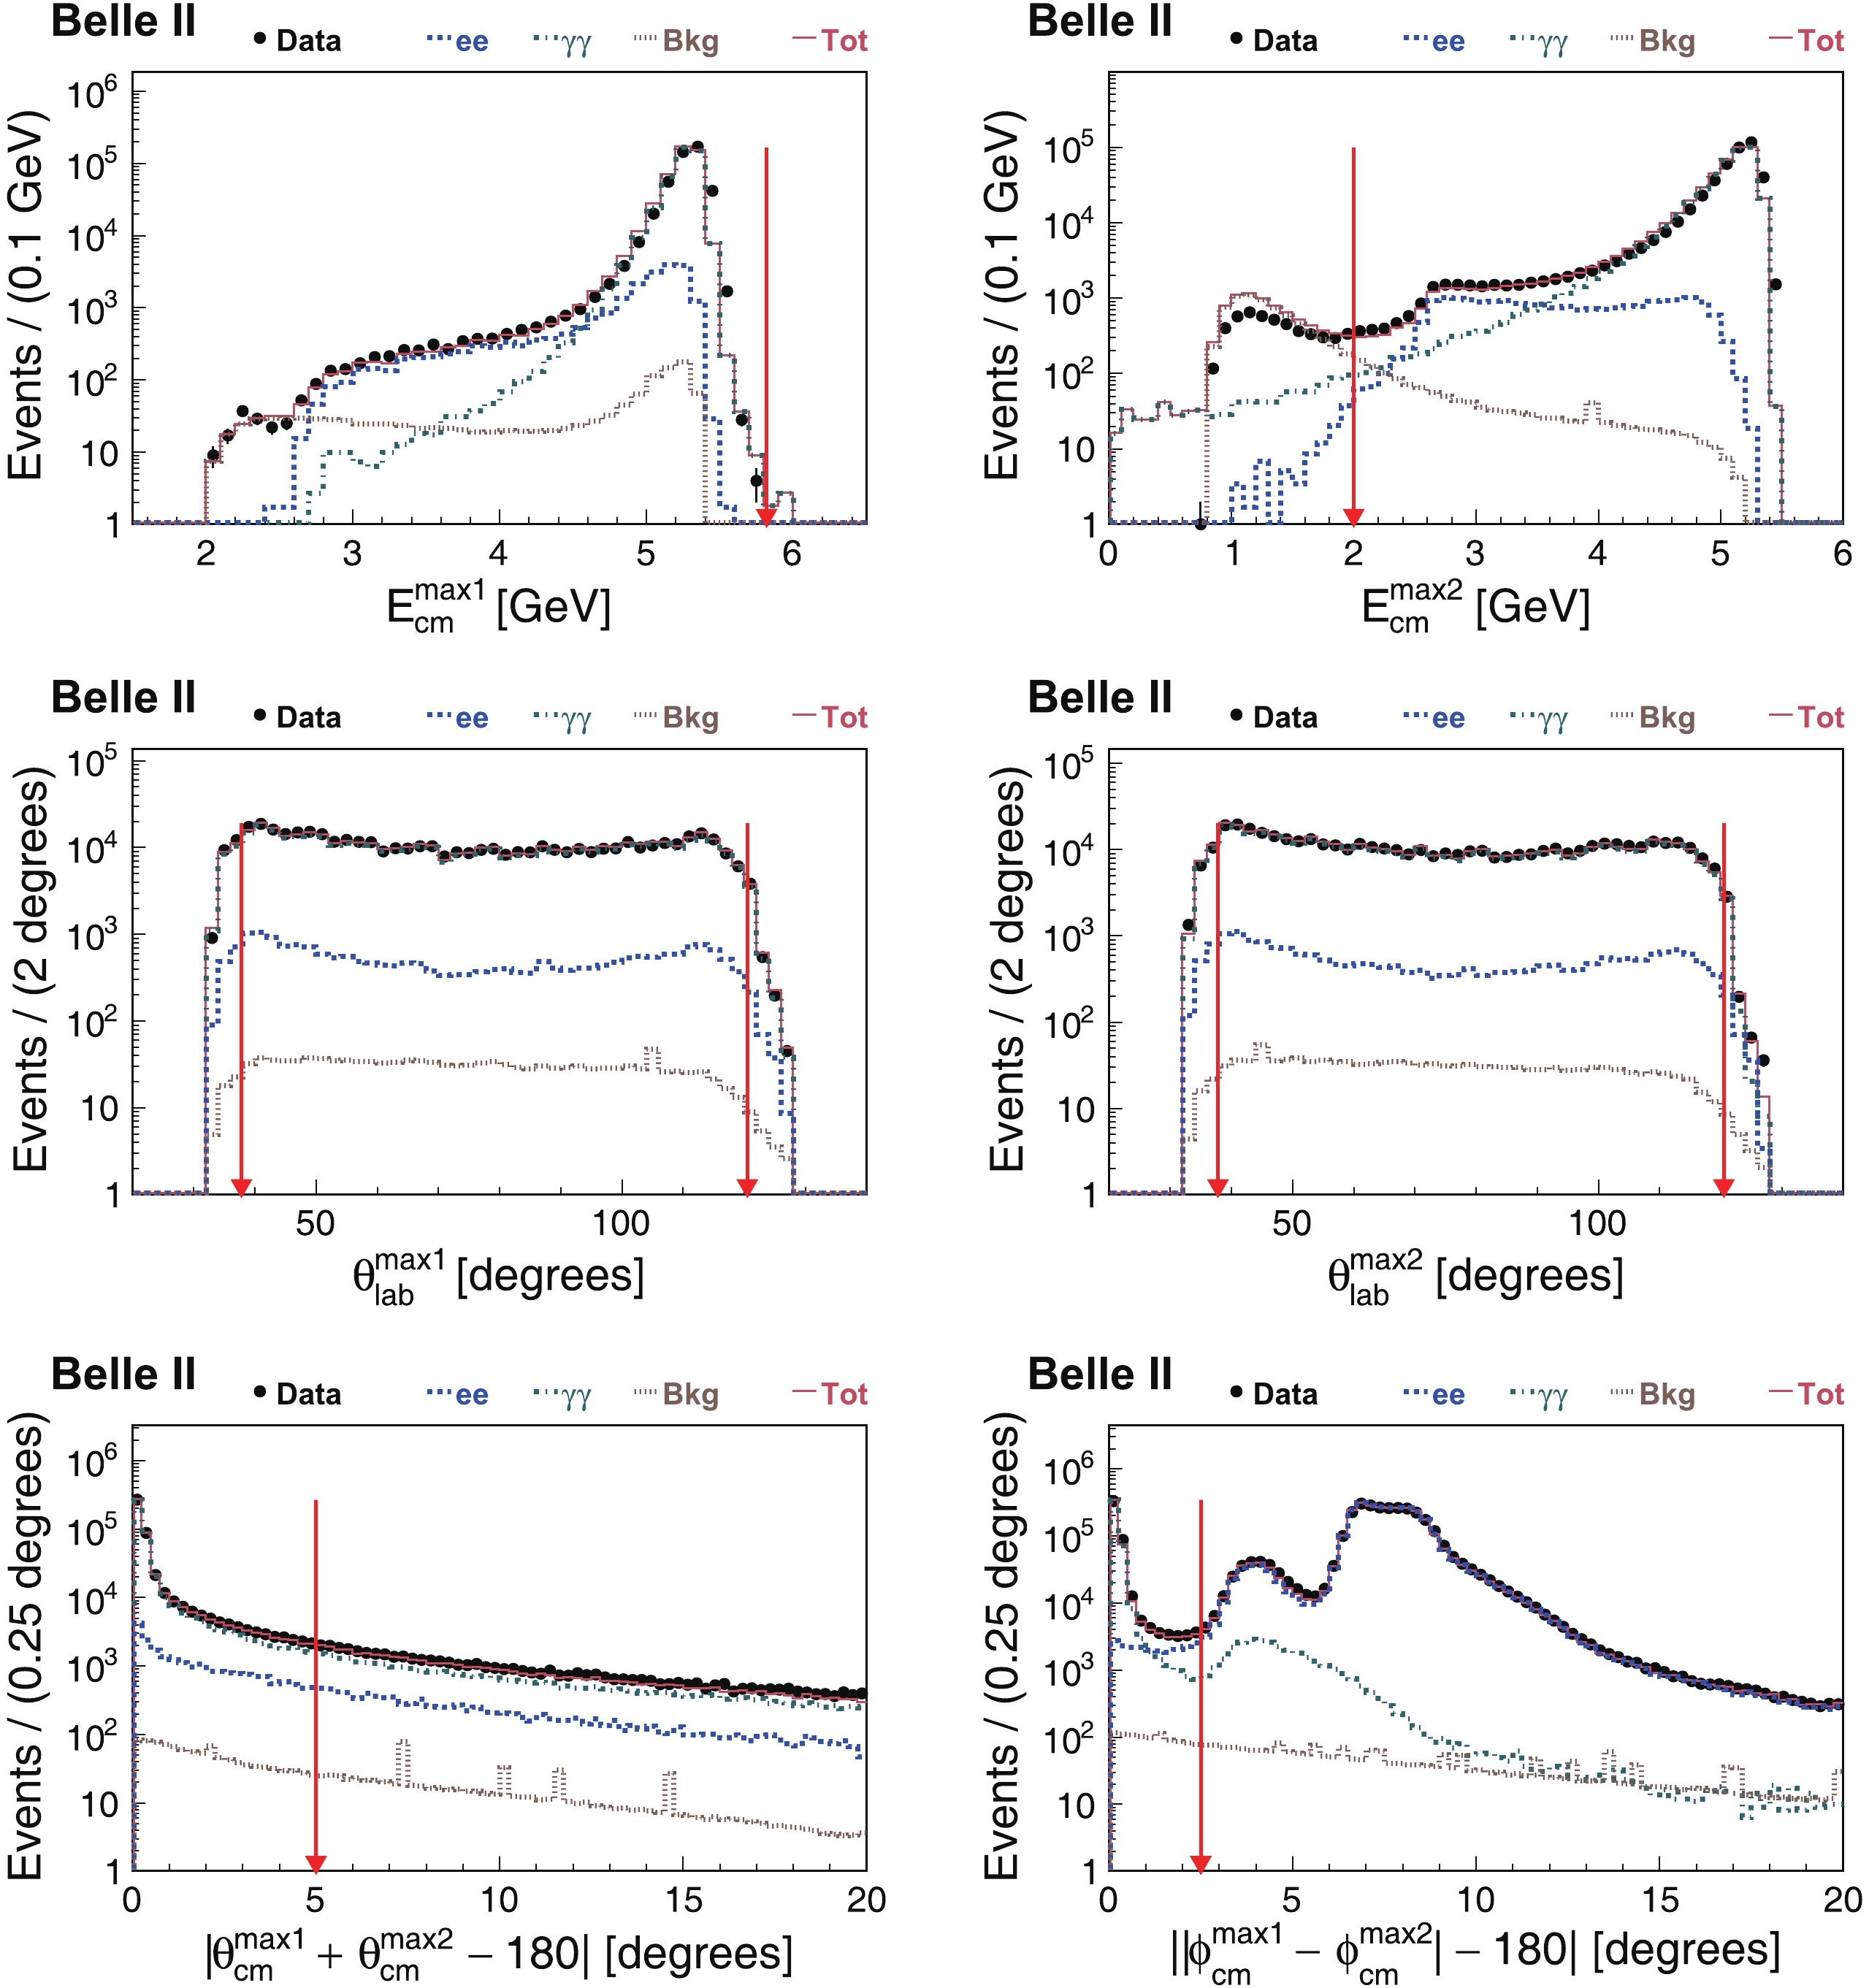
Figure 2. (color online) Comparisons of the distributions of digamma-dominant signal candidates between the data and MC samples. Each plot in the figure shows one quantity in the selection criteria and is drawn with the requirements on all other quantities applied. In the legend, "Data" represents the data sample, while "ee", "
$\gamma\gamma$ ", "Bkg", and "Tot" denote the Bhabha, digamma, background ($\mu^+\mu^-$ ,$e^{+}e^{-}e^{+}e^{-}$ ,$B^{+}B^{-}$ ,$B^0\bar{B^0}$ ,$c\bar{c}$ ,$s\bar{s}$ ,$u\bar{u}$ ,$d\bar{d}$ , and$\tau^+\tau^-$ ), and total MC samples, respectively. The vertical arrows indicate the regions of the selected events.In the figures, one sees that the data and MC samples agree quite well except in the following cases. In the
$ {\rm E}_{\rm cm}^{\rm max1} $ and$ {\rm E}_{\rm cm}^{\rm max2} $ plots, data and MC disagree around the peaks due to the imperfect ECL calibration at this early stage of the experiment. However, this has a negligible impact on our measurements, because the selection requirements on$ {\rm E}_{\rm cm}^{\rm max1} $ and$ {\rm E}_{\rm cm}^{\rm max2} $ are far from the peaks. In addition, we note that the peak around 4° in the$ ||\phi_{\rm cm}^{\rm max1}-\phi_{\rm cm}^{\rm max2}|-180^\circ| $ plots is mainly associated with Bhabha events with hard final state radiation where the photon, which is not deflected in the magnetic field, has a higher energy than the electron or positron from which it is radiated. Due to the gamma-conversion effect, digamma events also contribute to this peak, but at a level one order of magnitude smaller. -
In both of the Bhabha-dominant and digamma-dominant measurements, with their respective selection criteria applied, we obtain the number of candidate events (
$ N_{\rm data}^{\rm obs} $ ) observed in the data sample, and the detection efficiencies of Bhabha and digamma events ($ \epsilon_{\rm ee} $ and$ \epsilon_{{\rm{\gamma}}{\rm{\gamma}}} $ ) estimated using their respective MC samples, as listed in Table 1. Similarly, all the residual efficiencies of the individual categories of backgrounds ($ \epsilon_{\rm bkg} $ ) are estimated with their corresponding MC samples.Quantity Bhabha digamma $N_{\rm data}^{\rm obs}$ 

$3\,134\,488\pm1\,770$ 

$454\,650\pm674$ 

$\epsilon_{\rm ee}$ (%)

$35.93\pm0.02$ 

$0.255\pm0.002$ 

$\epsilon_{\rm \gamma\gamma}$ (%)

$3.56\pm0.02$ 

$47.74\pm0.05$ 

$\sigma_{\rm ee}$ /nb

17.37 17.37 $\sigma_{\rm \gamma\gamma}$ /nb

1.833 1.833 $R_{\rm bkg}$ (%)

0.07 0.28 L / ${\rm{pb}}^{-1}$ 

$496.7 \pm 0.3$ 

$493.1 \pm 0.7$ 

Table 1. Measured integrated luminosities and the quantities used to calculate them. The second and third columns list the quantities in the Bhabha-dominant and digamma-dominant measurements, respectively. The uncertainties are statistical only.
Combining the selection efficiencies with the theoretical cross sections of the signal processes as well as those of the background processes (
$ \sigma_{\rm bkg} $ ) [2], the total background levels ($ R_{\rm bkg} $ ) are calculated as$ R_{\rm bkg} = \frac{\displaystyle\sum\limits_{\rm bkg}\sigma_{\rm bkg}\epsilon_{\rm bkg}}{(\sigma_{\rm ee}\epsilon_{\rm ee} + \sigma_{{\rm{\gamma}}{\rm{\gamma}}}\epsilon_{{\rm{\gamma}}{\rm{\gamma}}})}. $

(2) The results are 0.07% and 0.28% in the Bhabha-dominant and digamma-dominant measurements, respectively. Detailed background analysis shows that the background mainly arises from
$ u\bar{u} $ ,$ \tau^+\tau^- $ , and$ d\bar{d} $ events in both measurements.Inserting the values of
$ N_{\rm data}^{\rm obs} $ ,$ \epsilon_{\rm ee} $ ,$ \epsilon_{{\rm{\gamma}}{\rm{\gamma}}} $ ,$ \sigma_{\rm ee} $ ,$ \sigma_{{\rm{\gamma}}{\rm{\gamma}}} $ , and$ R_{\rm bkg} $ into the formula$ L = \frac{N_{\rm data}^{\rm obs}}{(\sigma_{\rm ee}\epsilon_{\rm ee} + \sigma_{{\rm{\gamma}}{\rm{\gamma}}}\epsilon_{{\rm{\gamma}}{\rm{\gamma}}})(1+R_{\rm bkg})}, $

(3) the integrated luminosities are determined to be (
$ 496.7 \pm 0.3 $ )$ {\rm pb}^{-1} $ and ($ 493.1 \pm 0.7 $ )$ {\rm pb}^{-1} $ in the Bhabha-dominant and digamma-dominant measurements, respectively. Here, the uncertainties are statistical only. In the two formulae above, the efficiencies$ \epsilon_{\rm ee} $ and$ \epsilon_{{\rm{\gamma}}{\rm{\gamma}}} $ implicitly include an energy-sum-based ECL trigger efficiency of 100% with a negligible uncertainty of$ \mathcal{O} $ (0.01%). This is evaluated using a radiative Bhabha data sample as the ratio of the events triggered by both ECL and CDC to all those triggered by CDC. -
Table 2 summarizes the sources and values of the systematic uncertainties of the integrated luminosities measured above. The systematic uncertainties are evaluated as follows.
Source ee (%) $\gamma\gamma$ (%)

ee + $\gamma\gamma$ (%)

Cross section ±0.1 ±0.1 ±0.1 CM energy ±0.2 ±0.2 ±0.2 ${\rm \theta}_{\rm cm}$ range

±0.0 ±0.4 ±0.1 IP position ±0.2 ±0.1 ±0.1 ECL location ±0.2 ±0.2 ±0.2 MC statistics ±0.1 ±0.1 ±0.1 Beam backgrounds ±0.1 ±0.1 ±0.1 Cluster reconstruction ±0.2 ±0.2 ±0.2 ${E}_{\rm cm}$ distributions

±0.1 ±0.1 ±0.1 ${\rm \theta}_{\rm lab}$ distributions

±0.1 ±0.2 ±0.1 ${\rm \theta}_{\rm cm}$ distributions

±0.3 ±0.3 ±0.3 ${\rm \phi}_{\rm cm}$ distributions

±0.1 ±0.3 – Material effects $-0.1$ 

$+0.7$ 

+0.1 Overlapping clusters ±0.1 ±0.1 ±0.1 Colliding backgrounds ±0.1 ±0.3 ±0.1 Quadrature sum ±0.6 ${}_{-0.8}^{+1.1}$ 

±0.6 Table 2. Systematic uncertainties of the measured integrated luminosities. The second, third, and fourth columns list the uncertainties from the Bhabha-dominant, digamma-dominant, and combined measurements, respectively.
The theoretical cross sections of Bhabha and digamma processes are evaluated with the BABAYAGA@NLO generator with a precision of 0.1% [16, 17], which is taken as the relative systematic uncertainty in each measurement.
The CM energy is an essential input to the BABAYAGA@NLO generator for the evaluation of the signal cross sections and the generation of the signal events. To check the impact of its uncertainty on the measured integrated luminosities, the two measurements are repeated with the CM energy increased/decreased by 0.1%, which is roughly half the width of the
$ \varUpsilon \left( {4{\rm{S}}} \right) $ resonance ($ 20.5\pm2.5 $ ) MeV [30] and is a conservative value for the energy uncertainty according to an analysis of the yield of B mesons. For each measurement, the larger of the changes in the integrated luminosity is taken as the associated uncertainty. The results are about 0.2% for both measurements. Additionally, since the rates of Bhabha and digamma processes vary comparatively slowly with energy, the impact of the uncertainty of the CM energy spread on the measured integrated luminosities is negligible.The polar angle range of electrons and positrons for Bhabha events or photons for digamma events in the CM frame is another important input to the BABAYAGA@NLO generator. The nominal signal MC samples are generated in the
$ \theta_{\rm cm} $ range$ 35^{\circ} $ –$ 145^{\circ} $ . To check the impact of different$ \theta_{\rm cm} $ ranges on the measured integrated luminosities, the two measurements are repeated with Bhabha and digamma events generated in the wider$ \theta_{\rm cm} $ range$ 5^{\circ} $ –$ 175^{\circ} $ . For the Bhabha-dominant measurements, the results are consistent within the statistical uncertainties. For the digamma-dominant measurements, the result changes by about 0.4%, which is taken as the relative systematic uncertainty.The actual position of the IP may deviate from the nominal position (0, 0, 0) as assumed in the MC simulation. In a preliminary study with charged tracks, the average position and the width of the IP distribution over the whole data sample are determined to be (−0.4, 0.4, 0.3) mm. To investigate the impact of the deviation on the measured integrated luminosities, we repeat our measurements using a shifted position of the IP in the MC simulation. The shift used is (
$ -0.4 $ ,$ +0.4 $ ,$ +0.3 $ ) mm from the nominal position. For the Bhabha-dominant and digamma-dominant measurements, the results change by about 0.2% and 0.1%, respectively. In addition, the IP spread is calculated to be about (14 μm, 0.56 μm, 0.35 mm) with the optics parameters set for the x and z dimensions and observed for the y dimension during Phase 2. We perform a study with the IP spread, finding the IP spread only has a negligible impact on the measured integrated luminosities because its x and y components are small and its symmetry around the average position makes the effects in positive and negative directions essentially cancel.The location of the ECL detector has an uncertainty of 0.5 mm in the z direction. In effect, this uncertainty is equivalent to an uncertainty in the position of the IP, though they are from different sources. To examine the impact of the uncertainty on the measured integrated luminosities, the two measurements are each repeated with two new sets of signal MC samples: one produced with the position of the IP changed from (0, 0, 0) to (0, 0,
$ + 0.5$ ) mm, another produced with the position of the IP changed to (0, 0,$ - 0.5$ ) mm. For both measurements, the larger change of the integrated luminosity is about 0.2%, which is taken as the associated relative systematic uncertainty. Besides the uncertainty in the z direction, there is an uncertainty due to the rotation of the ECL sub-detector relative to the coordinate system. However, MC studies show that the impact of a rotation of 1 mrad in$ \theta_{\rm lab} $ on the measured luminosities is negligible.The relative systematic uncertainties due to the limited sizes of the signal MC samples are evaluated to be about 0.1% for both measurements.
To examine the impact of beam background overlay on the measured integrated luminosities, MC samples without beam background overlay are produced and used to perform the two measurements. The differences between the results obtained with and without the background overlay are taken as the systematic uncertainties. The uncertainties are about 0.1% for both measurements. In addition, both MC samples with and without the background overlay demonstrate very good agreement with the data sample in the distributions of the number of ECL clusters after event selection. This indicates that beam backgrounds have only a negligible impact on the signal candidates, which have very clear signatures: two high energy clusters in the ECL barrel region and the back-to-back feature in the
$ \theta_{\rm cm} $ and$ \phi_{\rm cm} $ projections.We estimate the uncertainty due to ECL cluster reconstruction efficiencies using radiative Bhabha events. We find that the average relative difference between data and MC simulation in the efficiencies for the clusters in our selected events is about 0.1%. Since we have two clusters in both measurements, we take 0.2% as the associated uncertainty.
The systematic uncertainties related to the distribution shapes of the energies, polar angles, and azimuthal angles of the ECL clusters are estimated by replacing the nominal requirements with alternatively more and less restrictive requirements. For each distribution shape, the larger of the changes in integrated luminosity is taken as the associated uncertainty. The requirements on the energies, polar angles, and acollinearity in polar angle in both the measurements are changed to
● (1.5) 2.5 GeV
$ <{\rm E}_{\rm cm}^{\rm max2}<{\rm E}_{\rm cm}^{\rm max1}< $ 5.62 (6.02) GeV,● (
$ 35.0^{\circ} $ )$ 39.4^{\circ} $ $ <\theta_{\rm lab}^{{\rm max}1} $ ,$ \theta_{\rm lab}^{{\rm max}2}< $ $ 118.4^{\circ} $ ($ 124.6^{\circ} $ ), and●
$ |\theta_{\rm cm}^{\rm max1}+\theta_{\rm cm}^{\rm max2}-180^\circ|< $ $ 2.5^{\circ} $ ($ 7.5^{\circ} $ );the requirement on the acollinearity in azimuthal angle in the Bhabha-dominant measurement is changed to
● (
$ 1.5^{\circ} $ )$ 3.5^{\circ} $ $ <||\phi_{\rm cm}^{\rm max1}-\phi_{\rm cm}^{\rm max2}|-180^\circ|< $ $ 12^{\circ} $ ($ 14^{\circ} $ );and the requirement on the acollinearity in azimuthal angle in the digamma-dominant measurement is changed to
●
$ ||\phi_{\rm cm}^{\rm max1}-\phi_{\rm cm}^{\rm max2}|-180^\circ|< $ $ 1.5^{\circ} $ ($ 3.5^{\circ} $ ).Here, the values inside and outside the parentheses correspond to the looser and tighter alternative requirements, respectively. The estimated systematic uncertainties obtained by changing requirements on these parameters are listed in Table 2.
A photon, electron or positron may interact while traversing the material in the VXD region. As mentioned in Section 3, the material is not fully included in the simulation model, and hence the material effects differ between the data and MC samples. To check the impact of the difference on the measured integrated luminosities, the two measurements are repeated with a new set of Bhabha and digamma MC samples produced with the vertex detectors removed from the simulation and reconstruction programs. Corresponding to the change of signal MC samples, the integrated luminosity obtained in the Bhabha-dominant measurement increases by about 0.42%, while that obtained in the digamma-dominant measurement decreases by about 3.5%. As described in Section 3, the unsimulated material is estimated to be 20% of the simulated material, and therefore we take −20% instead of 100% of the resulting changes as the associated systematic uncertainties. The relative uncertainties are estimated to be
$ -0.1 $ % and$ +0.7 $ % for the Bhabha-dominant and digamma-dominant measurements, respectively. Here, the uncertainties are signed and show the reduction in the difference between the Bhabha-dominant and digamma-dominant measurements.A photon, electron or positron may also interact with material while traversing the CDC outer wall and the TOP detector, resulting in two nearby ECL clusters. Because we preferentially select events that do not contain nearby clusters, imperfect modeling of this process could lead to a systematic uncertainty. We evaluate the uncertainty by repeating the two measurements with the selection criteria supplemented by requirements dedicated to select events with pairs of nearby clusters. With the extra requirements applied, the change of the result is less than 0.1% for both measurements, which is conservatively taken as the relative systematic uncertainty.
Besides the signal events, a small fraction of background events survive the event selection. We take 100% of the total background levels as the associated systematic uncertainties, which are about 0.1% and 0.3% in the Bhabha-dominant and digamma-dominant measurements, respectively.
Assuming that the individual uncertainties are independent and adding them in quadrature yields total relative systematic uncertainties of 0.6% and
$ {}_{-0.8}^{+1.1} $ % for the Bhabha-dominant and digamma-dominant measurements, respectively. Including these total systematic uncertainties, the integrated luminosities are ($ 496.7 \pm 0.3 \pm 3.0 $ )$ {\rm pb}^{-1} $ and ($ 493.1 \pm 0.7 _{-4.0}^{+5.4} $ )${\rm pb} ^{-1} $ for the Bhabha-dominant and digamma-dominant measurements, respectively. The systematic uncertainties dominate in both measurements. Accounting for the correlations between the uncertainties for the Bhabha- and digamma-dominant measurements, the ratio of the two luminosities is determined to be$ 1.007\pm0.002\pm0.008 $ , indicating agreement between the two results.As can be seen from Section 4, the signal candidates in the Bhabha-dominant and digamma-dominant measurements are separated by the border
$ ||\phi_{\rm cm}^{\rm max1}\!\!-\!\!\phi_{\rm cm}^{\rm max2}|\!-\!\!180^\circ|\! =$ $ 2.5^{\circ} $ . To get the combined result of the two measurements, we repeat a measurement with the merged requirement$ ||\phi_{\rm cm}^{\rm max1}-\phi_{\rm cm}^{\rm max2}|-180^\circ|<13^{\circ} $ . In this measurement, systematic uncertainties are estimated with the same methods used in the two separate measurements, and the results are listed in the fourth column of Table 2.Because most of the uncertainty sources are the same for the two separate measurements and Bhabha events dominate the signal candidates in the combined measurement (
$ \frac{\sigma_{\rm ee}\epsilon_{\rm ee}}{\sigma_{{\rm{\gamma}}{\rm{\gamma}}}\epsilon_{{\rm{\gamma}}{\rm{\gamma}}}} \approx 6.7 $ ), almost all of the systematic uncertainties are equal to their counterparts in the Bhabha-dominant measurement at the order of 0.1%. The uncertainty associated with$ {\rm \phi}_{\rm cm} $ distributions is negligible, since$ ||\phi_{\rm cm}^{\rm max1}-\phi_{\rm cm}^{\rm max2}|-180^\circ|<13^{\circ} $ is a relatively loose requirement. The uncertainty related to material effects is estimated to be +0.1%, mainly because of the cancellation of the corresponding uncertainties in the two separate measurements with the associated numbers of signal candidates as weights. With the systematic uncertainties, the combined result is calculated to be ($ 496.3 \pm 0.3 \pm 3.0 $ )$ {\rm pb}^{-1} $ , which is nearly the same as in the Bhabha-dominant measurement. We take the combined result as the final result in this work. -
The integrated luminosity of the first data sample collected with the Belle II detector at SuperKEKB during Phase 2 is measured using ECL information with Bhabha and digamma events. The result obtained in the Bhabha-dominant measurement is consistent with that obtained in the digamma-dominant measurement. Combining the two measurements, we determine the integrated luminosity to be (
$ 496.3 \pm 0.3 \pm 3.0 $ )$ {\rm{pb}}^{-1} $ , where the first uncertainty is statistical and the second is systematic.The result will be used in the early studies with the Phase 2 data at Belle II, particularly in the searches for new physics in the dark sector, in which Belle II expects to achieve good sensitivities owing to the dedicated triggers for single photon and low multiplicity events [31]. Using ECL information alone, this work builds a foundation for future luminosity measurements in the Belle II experiment, in which we will incorporate the information obtained by other sub-detectors, particularly the CDC, to select signal events.
We thank the SuperKEKB group for the excellent operation of the accelerator; the KEK cryogenics group for the efficient operation of the solenoid; and the KEK computer group for on-site computing support.
Measurement of the integrated luminosity of the Phase 2 data of the Belle II experiment
- Received Date: 2019-10-12
- Available Online: 2020-02-01
Abstract: From April to July 2018, a data sample at the peak energy of the


 DownLoad: