


 Abstract
 HTML
HTML Reference
 Related
 PDF
PDF


-
Exploring the phase structure of strongly interacting nuclear matter is one of the main objectives of heavy-ion collision experiments. Owing to the asymptotic freedom of QCD, nuclear matter is expected to undergo a phase transition from a phase with hadrons as dominant degrees of freedom to quark-gluon plasma (QGP) [1]. In the chiral limit, the transition is of first-order at vanishing chemical potential. Lattice QCD calculations show that at small baryon chemical potential and high temperature, the transition becomes a smooth crossover [2], whereas a first-order phase transition is expected at high baryon chemical region [3-6]. The end point of the first-order phase boundary towards the crossover region is called the QCD critical end point (CEP) [7]. The fluctuations in the baryon number and electric charge have long been predicted to be sensitive to the phase transition, and they can be used to study the phase structure of strongly interacting nuclear matter. Experimental measurements of the fluctuations of conserved quantities were performed by the beam energy scan (BES) program in the STAR and PHENIX experiments at the Relativistic Heavy-Ion Collider (RHIC). Interestingly, the STAR experiment observed a non-monotonic energy dependence of the fourth order (
$ \kappa\sigma^{2} $ ) net-proton fluctuations in the most central Au + Au collisions [8-15]. Furthermore, this non-monotonic behavior cannot be described by various transport models [16, 17, 12]. To theoretically investigate the contribution of critical point physics to the conserved charge fluctuations and their energy dependence behavior, we have calculated the various fluctuations along the freeze-out line in the QCD phase diagram with a modified Nambu-Jona-Lasinio (NJL) model [18, 19] up to the tenth order. Previous studies have investigated the quantities up to the fourth order [20-26], or made use of the Polyakov-loop improved NJL model [27-29]. Other effective models, like Polyakov-Quark-Meson (PQM) model [30], which calculated baryon fluctuations up to the eighth order exhibit similar qualitative behavior as the NJL model.In our work, we use a modified three-flavor NJL model, with the four-point coupling being dependent on the quark condensate, as inspired by the operator oroduct expansion (OPE) method [31]. This effectively decreases the coupling strength at higher temperature and the chemical potential, which is more intuitive. Owing to the sign problem of lattice QCD simulation at finite chemical potential, the lattice method is at present limited to a low baryon chemical potential. The conventional NJL model can not match the lattice result at zero chemical potential. However, with the coupling strength depending on the quark condensate, we are able to reproduce the lattice result at finite temperature and
$ \mu_B = 0 $ . This provides an extension to the finite chemical potential more reliable. The experimentally obtained chemical potential of u, d quarks is almost the same [32]; therefore, we set them to be equal throughout the calculation. The chemical potential of the strange quark is smaller; however, owing to the large mass of the s quark, this does not alter the phase diagram significantly resulting in a small influence on the susceptibilities. Throughout our calculation, we assume that the fire-ball is near thermal equilibrium at freeze-out, although a critical slowing of dynamics would occur if the fire-ball passes the CEP [33, 34]. Additionally, changes in expansion dynamics and interactions can generate variations in particle spectra and acceptance independent of critical phenomena, whose fluctuations must also be monitored [35].This paper is organized as follows: In Section 2, we introduce the modified NJL model and present its phase diagram. In Section 3 we provide the definition of various quark number susceptibilities. Subsequently, we calculate the various moments and quantities that can be compared with experimental measurements in the next two sections. The sign pattern of these moments reveals a lot of information about the presence and location of the CEP. We show their temperature dependence at
$ \mu_B = 0 $ and discuss their similarities and differences with other model results in Section 5. The energy dependence of the baryon moments is given in Section 6. We find that a second peak (further sign changes) occurs along the collision energy axis. Finally, we summarize our work and provide an outlook for future experiments. -
We use a Lagrangian density of the NJL model with 2 + 1 flavor:
$\begin{split} {\cal L} =& \bar \psi (i\not\!{\partial} - {m_0})\psi + G[{(\bar \psi {\lambda _i}\psi )^2} + {(\bar \psi i{\gamma _5}{\lambda _i}\psi )^2}]\\ & - K({\rm det}[\bar \psi (1 + {\gamma _5})\psi ] + {\rm det}[\bar \psi (1 - {\gamma _5})\psi ]), \end{split}$

(1) where
$ m_0 = {\rm diag}(m_{u0},m_{d0},m_{s0}) $ is the current quark mass matrix.$ \lambda_i $ are the Gell-Mann matrixes, and the determinant is taken in flavor space [19]. At finite temperature and chemical potential, we have one additional term$ \mu \psi^{\dagger}\psi $ , where$ \mu $ is the chemical potential matrix.After performing a mean–field approximation of the Lagrangian in Eq. (1), we obtain the following gap equation and expressions for quark condensate and number density:
$\left\{ \begin{array}{l} {m_i} = {m_{i0}} - 4G\langle {{\bar q}_i}{q_i}\rangle + 2K\langle {{\bar q}_m}{q_m}\rangle \langle {{\bar q}_n}{q_n}\rangle (i \ne m \ne n)\\ \langle {{\bar q}_i}{q_i}\rangle = - {m_i}F({m_i},{\mu _i})\\ \langle q_i^\dagger {q_i}\rangle = H({m_i},{\mu _i}) \end{array} \right.$

(2) where
$ q_i (i = u,d,s) $ are the wave functions of the three quarks, and$ \langle\Theta\rangle = \displaystyle\frac{{\rm Tr} (\Theta e^{-\beta(\mathcal{H}-\mu_i \mathcal{N}_i)})}{{\rm Tr}( e^{-\beta(\mathcal{H}-\mu_i\mathcal{N}_i)})} $ is the grand canonical ensemble average. We define:$\begin{split} F(m,\mu ) =& \frac{{{N_c}}}{{{\pi ^2}}} \int \nolimits^\Lambda {\rm d}p\frac{{{p^2}}}{{{E_p}}}(1 - {f^ - }(m,\mu ) - {f^ + }(m,\mu ))\\ H(m,\mu ) =& \frac{{{N_c}}}{{{\pi ^2}}}\int \nolimits^\Lambda {\rm d}p{p^2}({f^ - }(m,\mu ) - {f^ + }(m,\mu )), \end{split}$

(3) where
$ f^{\pm}(m,\mu) = 1/(1+E^{\beta(E\pm\mu)}) $ , and$ N_c = 3 $ .The four-point coupling G, in terms of physical meaning, indicates an effective gluon propagator. If we take into account the quark propagator's feedback on the gluon self-energy [36, 37], the coupling strength is replaced by:
$G = {G_1} + {G_2}(\langle \bar uu\rangle + \langle \bar dd\rangle ) + {G_3}\langle \bar ss\rangle. $

(4) In this study, we restrict our discussion to the
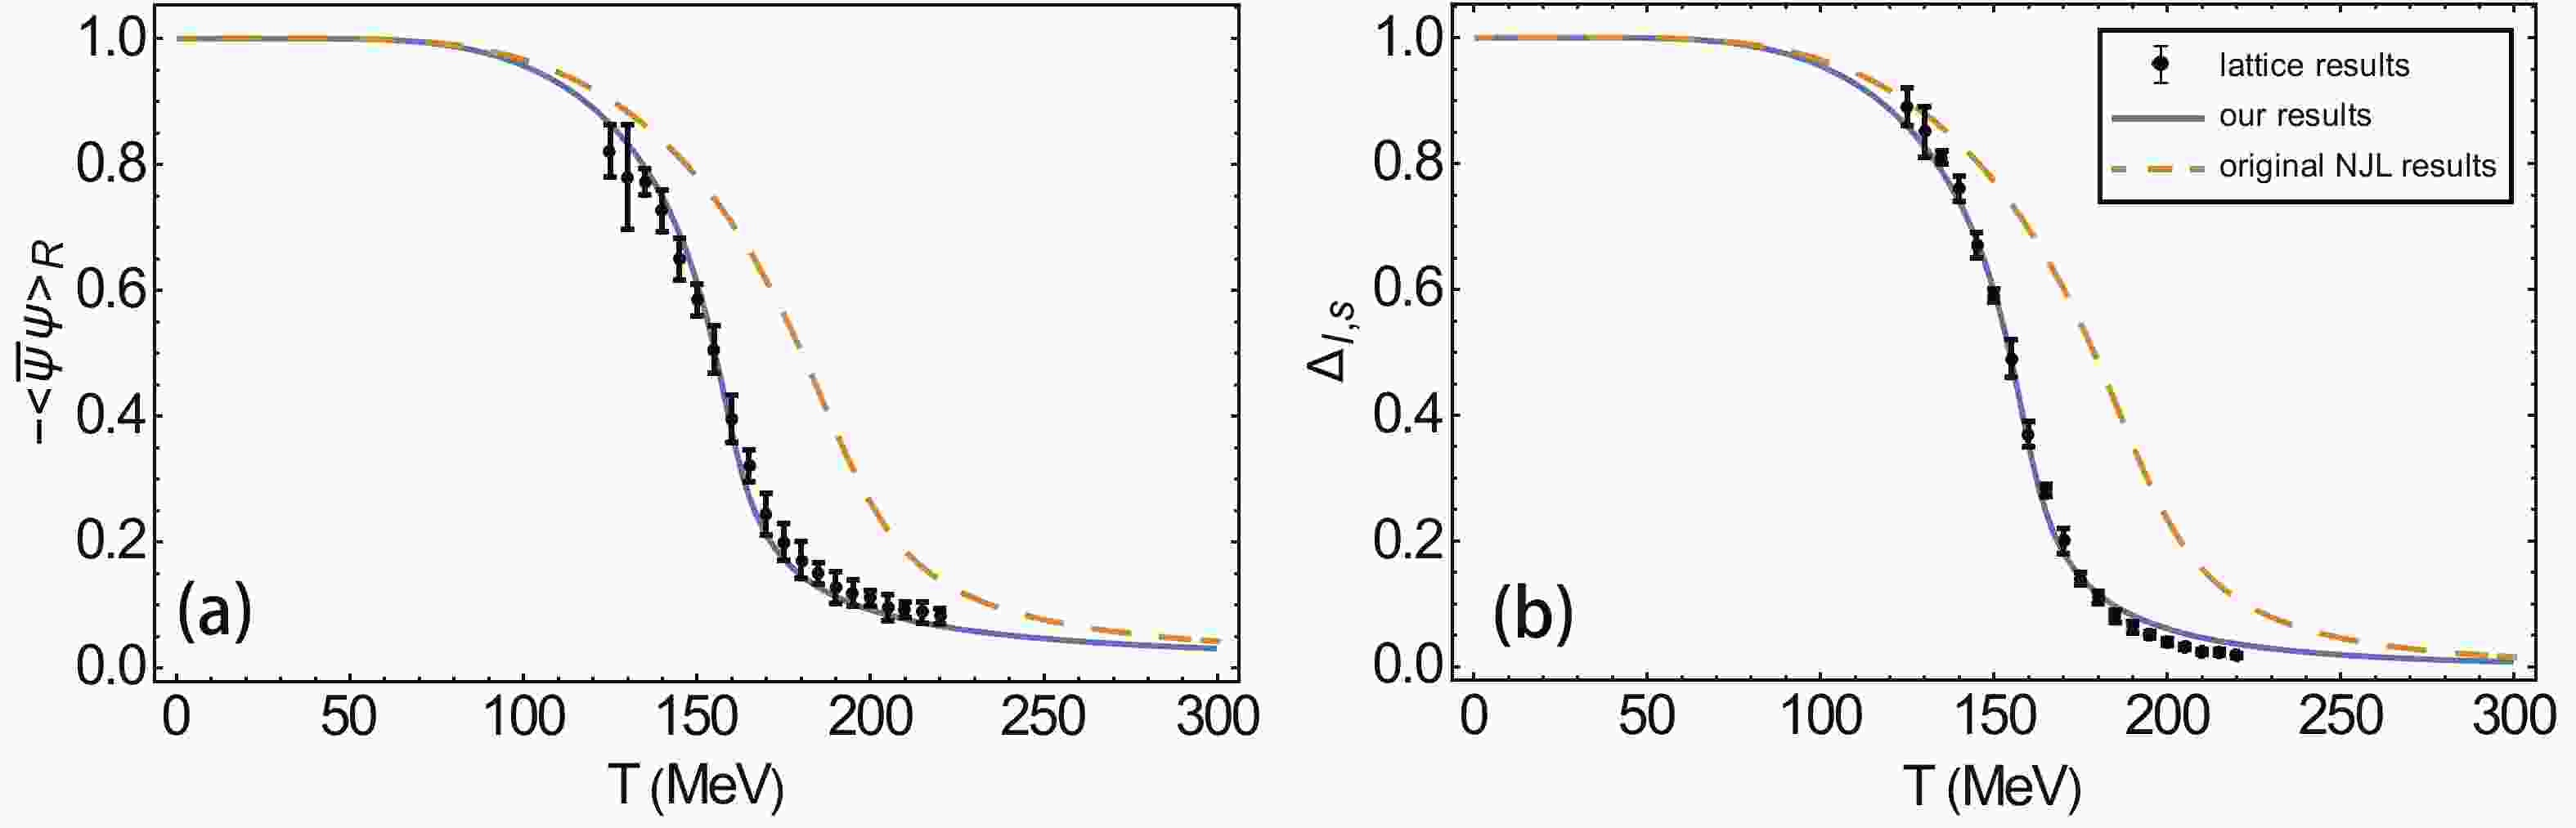
$ G_2 = G_3 $ case for simplicity. Also, the six-point coupling constant K is kept unaltered, since it has a much smaller effect on the quark condensate than G. We fix these parameters at zero temperature and chemical potential following standard procedure, and we adopt the parameter set used in Ref. [38]. In Fig. 1, the ratio of$ G_1 $ to$ G_2(G_3) $ is further determined by fitting the critical temperature$ T_c $ to lattice results at finite temperature [39]. With only one additional parameter, we are able to efficiently fit$ \langle\overline{u}u\rangle $ and$ \langle\overline{s} s\rangle $ at finite temperature to the lattice results. The critical temperature$ T_c $ at zero chemical potential is about 158 MeV. We referred the NJL model and the lattice simulation to both use physical quark masses and other parameters fitted to physical meson properties, which is important since the behaviors of both theories strongly depend on the parameter sets they adopt. A previous NJL model calculation resulted in a$ T_c $ of about 190 MeV, while the PNJL resulted in a$ T_c $ of about 200 MeV [40] using the same parameter set in Table 1. The effective coupling G is lowered by about 20% when chiral symmetry is restored, and its direct effect is to bring forward the chiral phase transition both in T and$\mu_B$ . A similar effect is also considered in the gluon-induced NJL (GI-NJL) model [41] and EPNJL models [42], where G is also lowered at high temperature, resulting in a reasonable$T_c$ .$m_u/\rm MeV$ 

$m_s/\rm MeV$ 

$\Lambda/\rm MeV$ 

5 136 631 $G_1(\rm MeV^{-2})$ 

$G_2(G_3)(\rm MeV^{-2})$ 

$K(\rm MeV^{-5})$ 

$3.74\times10^{-6}$ 

$-1.74\times10^{-14}$ 

$9.29\times10^{-14}$ 

Table 1. Parameter set for the NJL model in our study
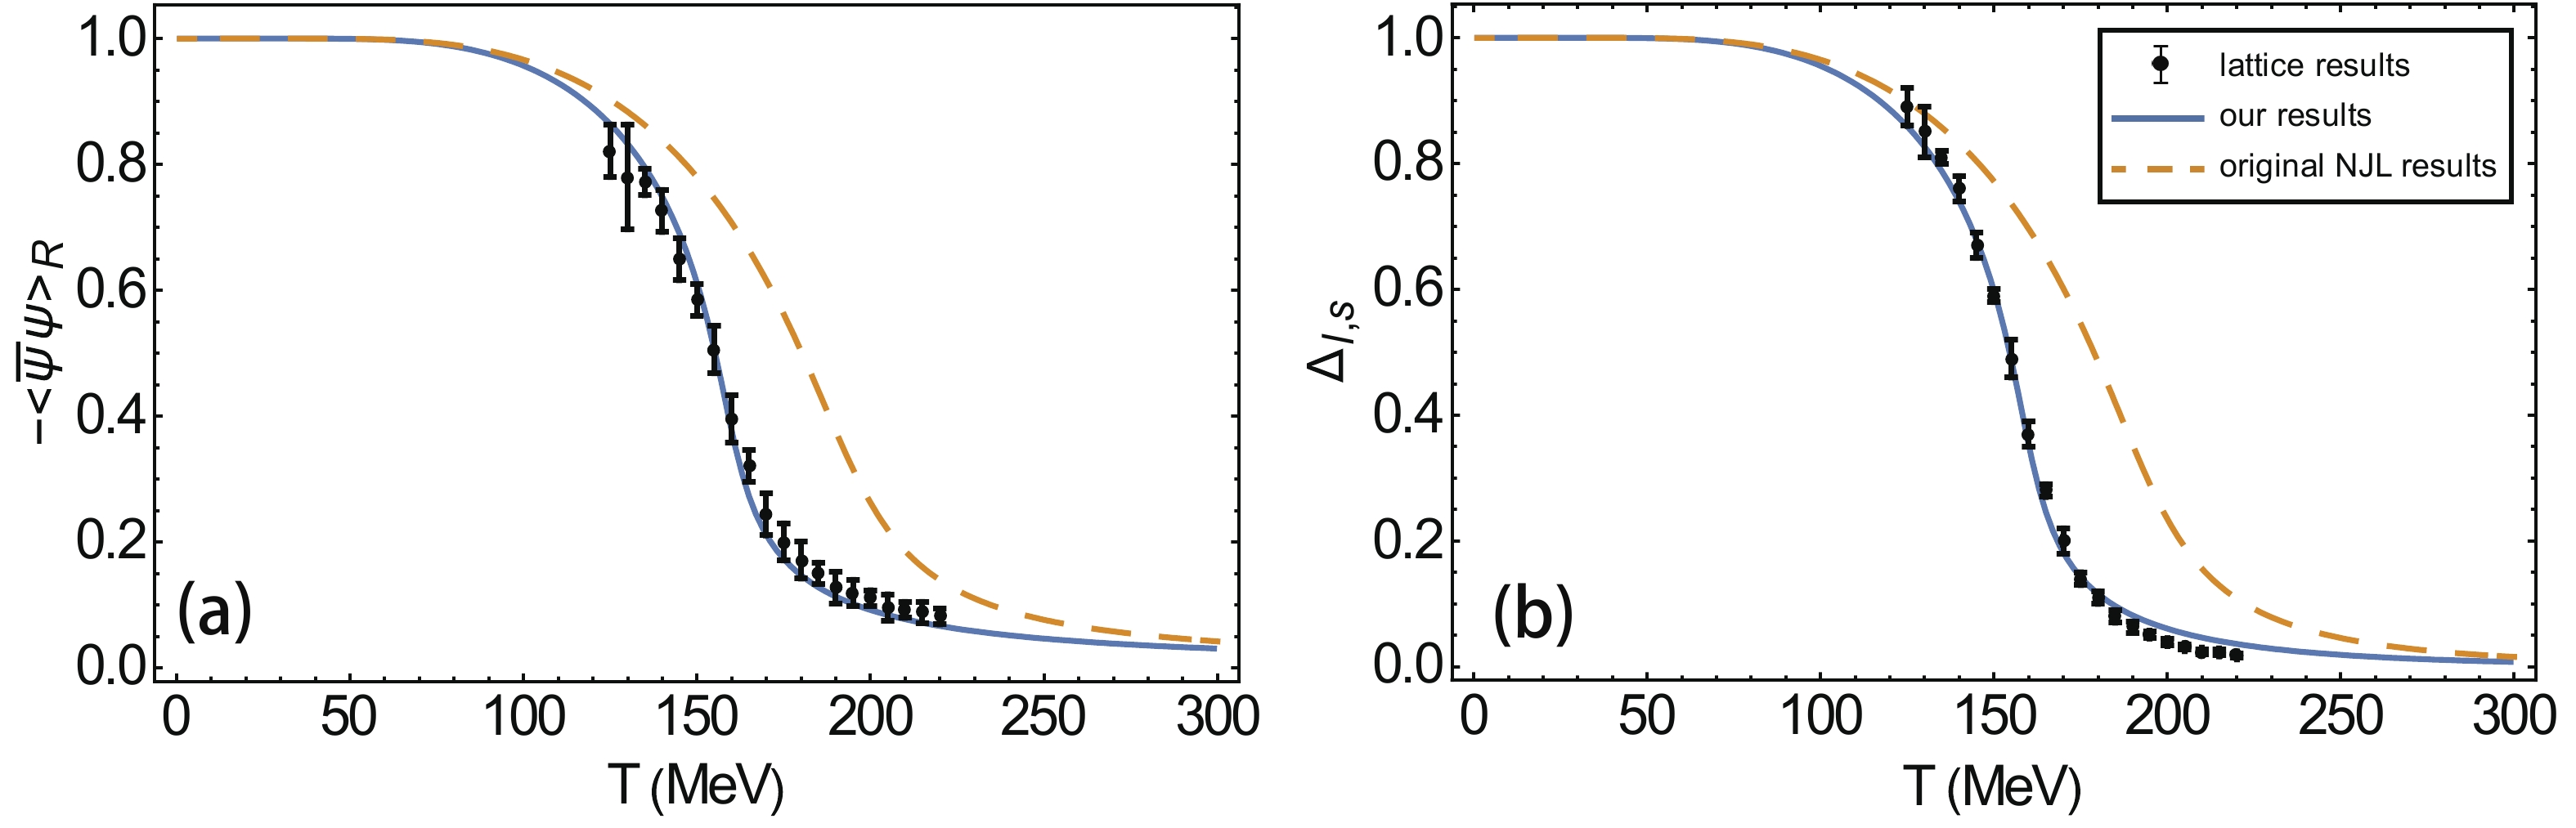
Figure 1. (color online) (a) Light quark (u, d) condensate as a function of T, compared to the lattice result from Ref. [39] (b)
$ \Delta_{l,s} $ (a linear combination of$ \langle\overline{u}u\rangle $ and$ \langle\overline{s} s\rangle $ ) as a function of T.In real experiments, although
$ \mu_u\approx\mu_d\approx \displaystyle\frac{1}{3}\mu_B $ ,$ \mu_s $ varies at different collision energies from about$ \displaystyle\frac{1}{5}\mu_B $ to$ \displaystyle\frac{1}{3}\mu_B $ [32, 43]. Since the location of the CEP is weakly dependent on the choice of$ \mu_s $ [26], we first assume an equal chemical potential for the three quarks. The resulting phase diagram of the quark masses is plotted in Fig. 2. The quark masses remain almost constant at low chemical potential and temperature, but vary drastically along a certain “band” when T and$ \mu_B $ increase, indicating a phase transition. At high baryon chemical potential or temperature, up- and down-quarks become small, while the strange quark remains quite massive. The CEP is located at$ (\mu_B,T) = (711\;\rm MeV,90\;MeV) $ . Because of the discontinuity in the quark mass, the susceptibilities are expected to exhibit divergent behavior near the CEP.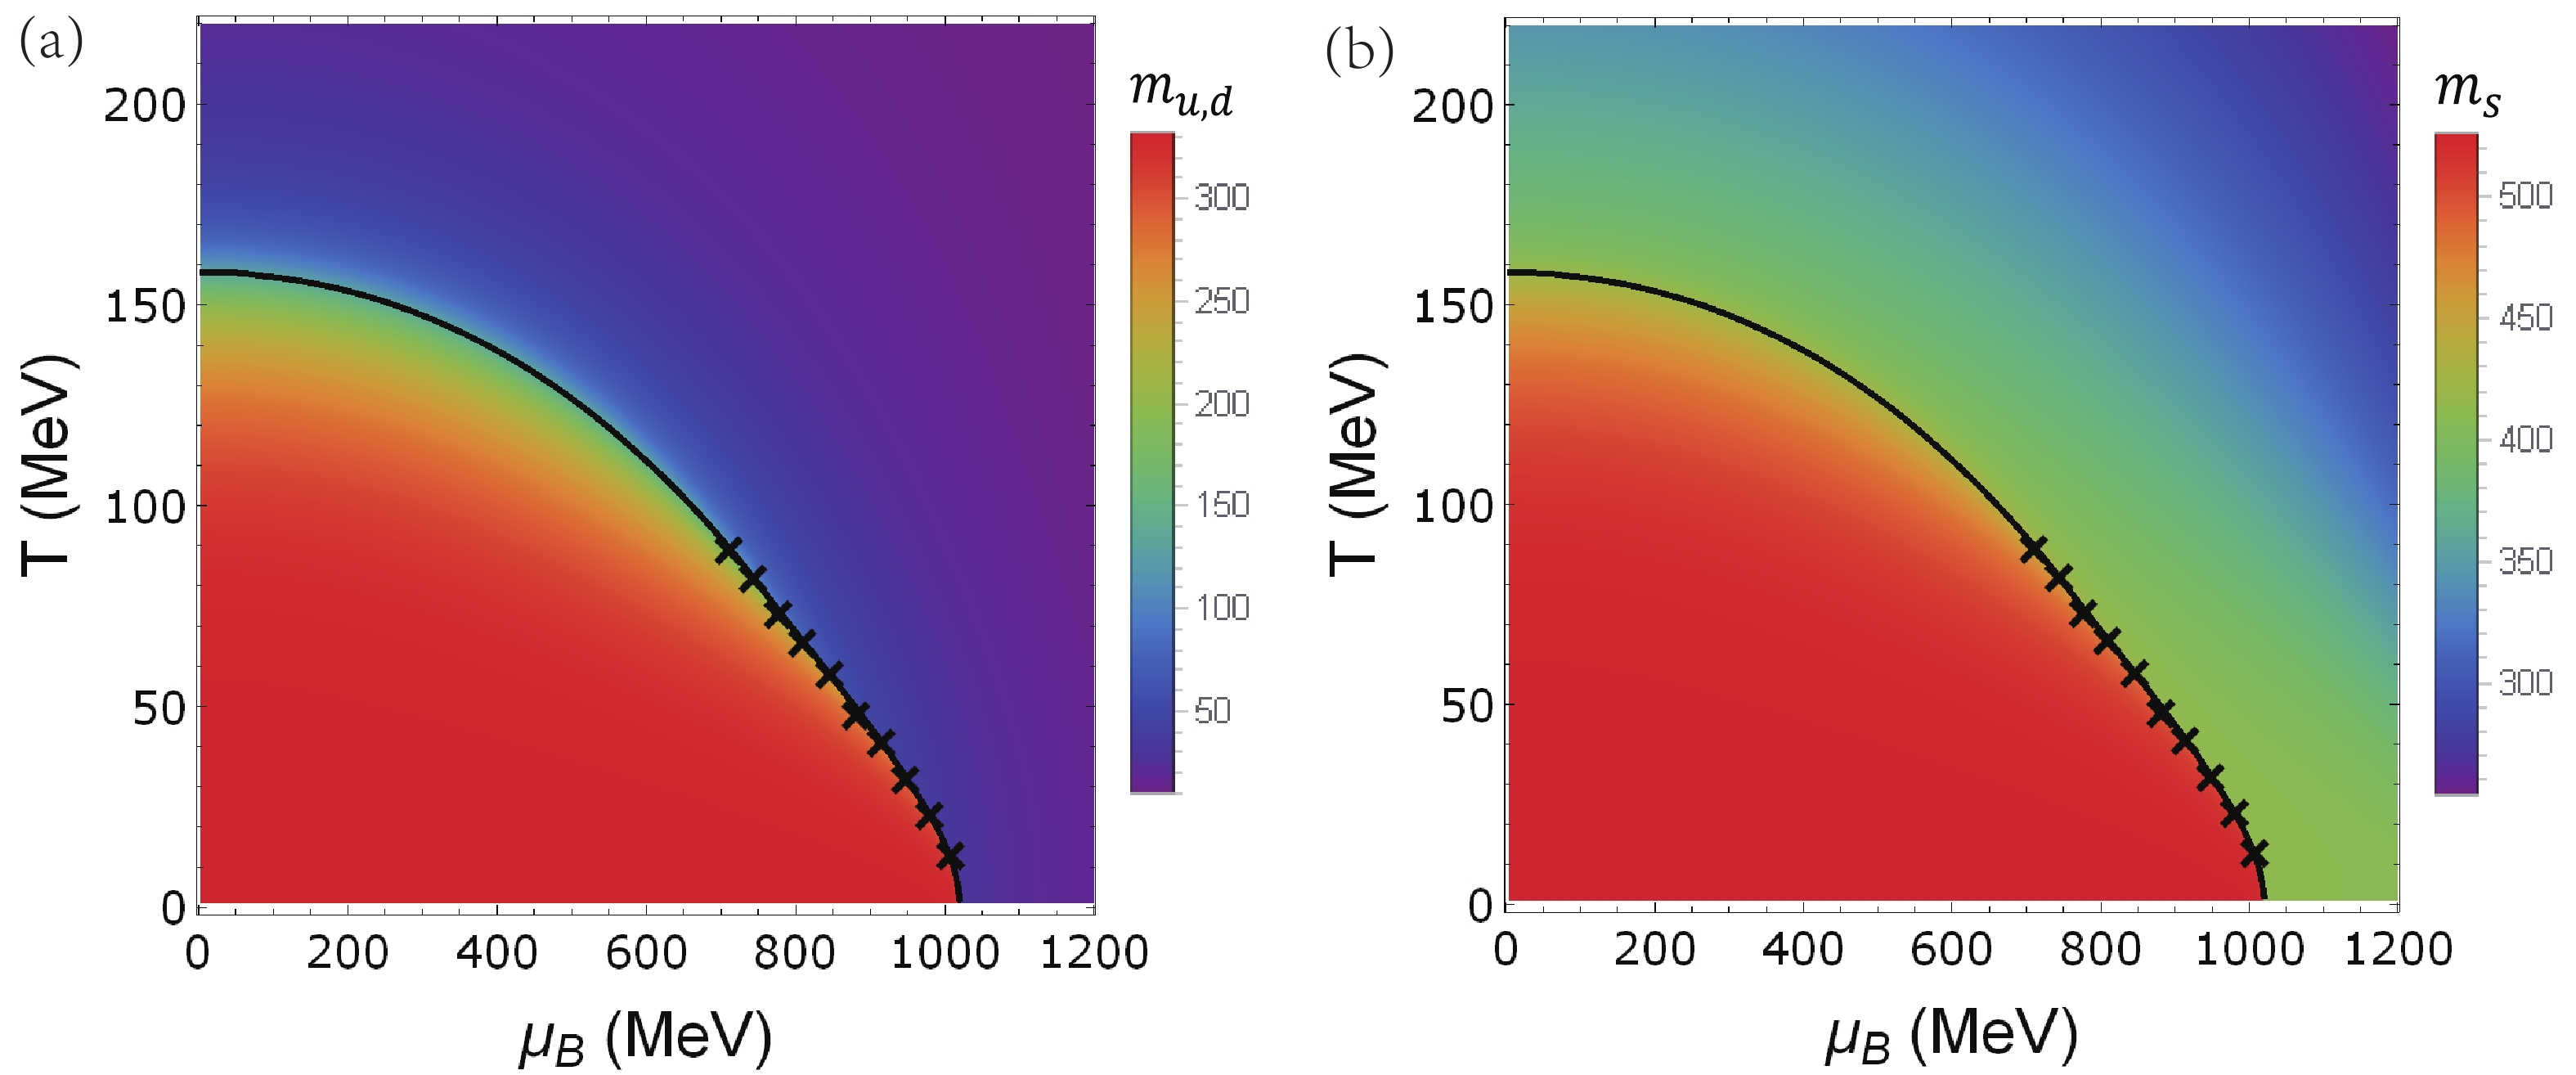
Figure 2. (color online) Phase diagram of quark masses. The solid line depicts the crossover line, and crosses make up the first order phase transition line (a) Up-quark mass
$ m_u $ and down-quark mass$ m_d $ (b) Strange quark mass$ m_s $ . -
As the linear response of the physical system to some external field, susceptibility is often measured to study the properties of a related system. Therefore, the studies of various susceptibilities are very important from the theoretical point of view, and they are widely used to study the phase transitions of strongly interacting matter [44]. These quantities are defined as:
$\frac{{{\partial ^n}\Omega }}{{\partial {\mu _i}\partial {\mu _j}\partial {\mu _k}\partial {\mu _p}\cdots}} = {\chi _{ijkp\cdots}}\ ,$

(5) where
$ \Omega $ is the thermodynamic potential density. Moreover,$ \chi_i^{(n)} = \partial^n \Omega/\partial \mu_i^{n} $ .We calculate these susceptibilities following the procedure introduced in Ref. [26]. Furthermore, we can change the base from
$ \{u,d,s\} $ at the quark level to the conserved charges$ \{B,Q,S\} $ by using:$\left\{ \begin{aligned} &{\mu _u} = \frac{1}{3}({\mu _B} + 2{\mu _Q})\\ &{\mu _d} = \frac{1}{3}({\mu _B} - {\mu _Q})\\ &{\mu _s} = \frac{1}{3}({\mu _B} - {\mu _Q} - 3{\mu _S}) \end{aligned} \right. .$

(6) Hence, the various susceptibilities can be expressed on the basis of
$ \{B,Q,S\} $ , for example:$ \begin{aligned} &\chi _B^{(n)} = \displaystyle\frac{1}{{{3^n}}}\displaystyle\sum\limits_{\{ ijk...\} = u,d,s} {{\chi _{ijk...}}} \\ &\chi _Q^{(n)} = \displaystyle\frac{1}{{{3^n}}}\displaystyle\sum\limits_{\{ ijk...\} = u,d,s} {{2^p}} {( - 1)^q}{( - 1)^r}{\chi _{ijk...}}\\ &\quad (p,q,r\;{\rm equals\;the\;number\;of}\;u,d,s {\rm in}~\{ ijk...\} ~{\rm, respectively})\\ &\chi _S^{(n)} = {( - 1)^n}{\chi _{sss...}}. \end{aligned} $

(7) We solve these susceptibilities order by order using the symbolic differentiation mentioned in Ref. [26]. The number of independent susceptibilities grows quadratically in order. If we calculate to the tenth order, there are 219 independent susceptibilities to solve. This symbolic differentiation method prevents truncation and rounding errors generated by the finite difference approximation and is much faster.
-
In order to compare our calculation with experiments and other model calculations, we consider the following moments defined as:
${m_n}(X) = \frac{{{T^n}\chi _X^{(n + 2)}}}{{\chi _X^{(2)}}},n = 1,2,3...$

(8) where
$ X = B,Q,S $ . These ratios are then independent of the volume of the system. The signs of these moments are shown in Figs. 3, 4, 5. Red regions depict the positive values, while blue regions depict negative values. The yellow regions represent values close to 0. Moments with an absolute value greater than 1 are normalized to$ \pm1 $ . Hence, although the magnitude of baryon moments is much greater than the other two, this cannot be deduced from this plot. The signs of these moments change increasingly as the order becomes higher. This implies that the experimental measurement is more sensitive to the location on the phase diagram for higher moments. Many qualitative features can be deduced from these plots. For example, at high baryon density and low temperature near the CEP, the moments are positive for all orders of B and Q, whereas the sign of$ m_n(S) $ changes every time as the order is raised in this region (this is not very surprising, since the definition of$ \chi^{n}_S = (-1)^n\chi^{n}_s $ ). Other qualitative behaviors can be tested by experiment as well. If a CEP is present and the entire phase diagram can be searched, then the sign change and large magnitude of higher order susceptibilities should be found. In this study, we focus on the behavior of$ m_n(B) $ along the freeze-out line, as it is the only line along which experimental measurement of these susceptibilities can be performed to date.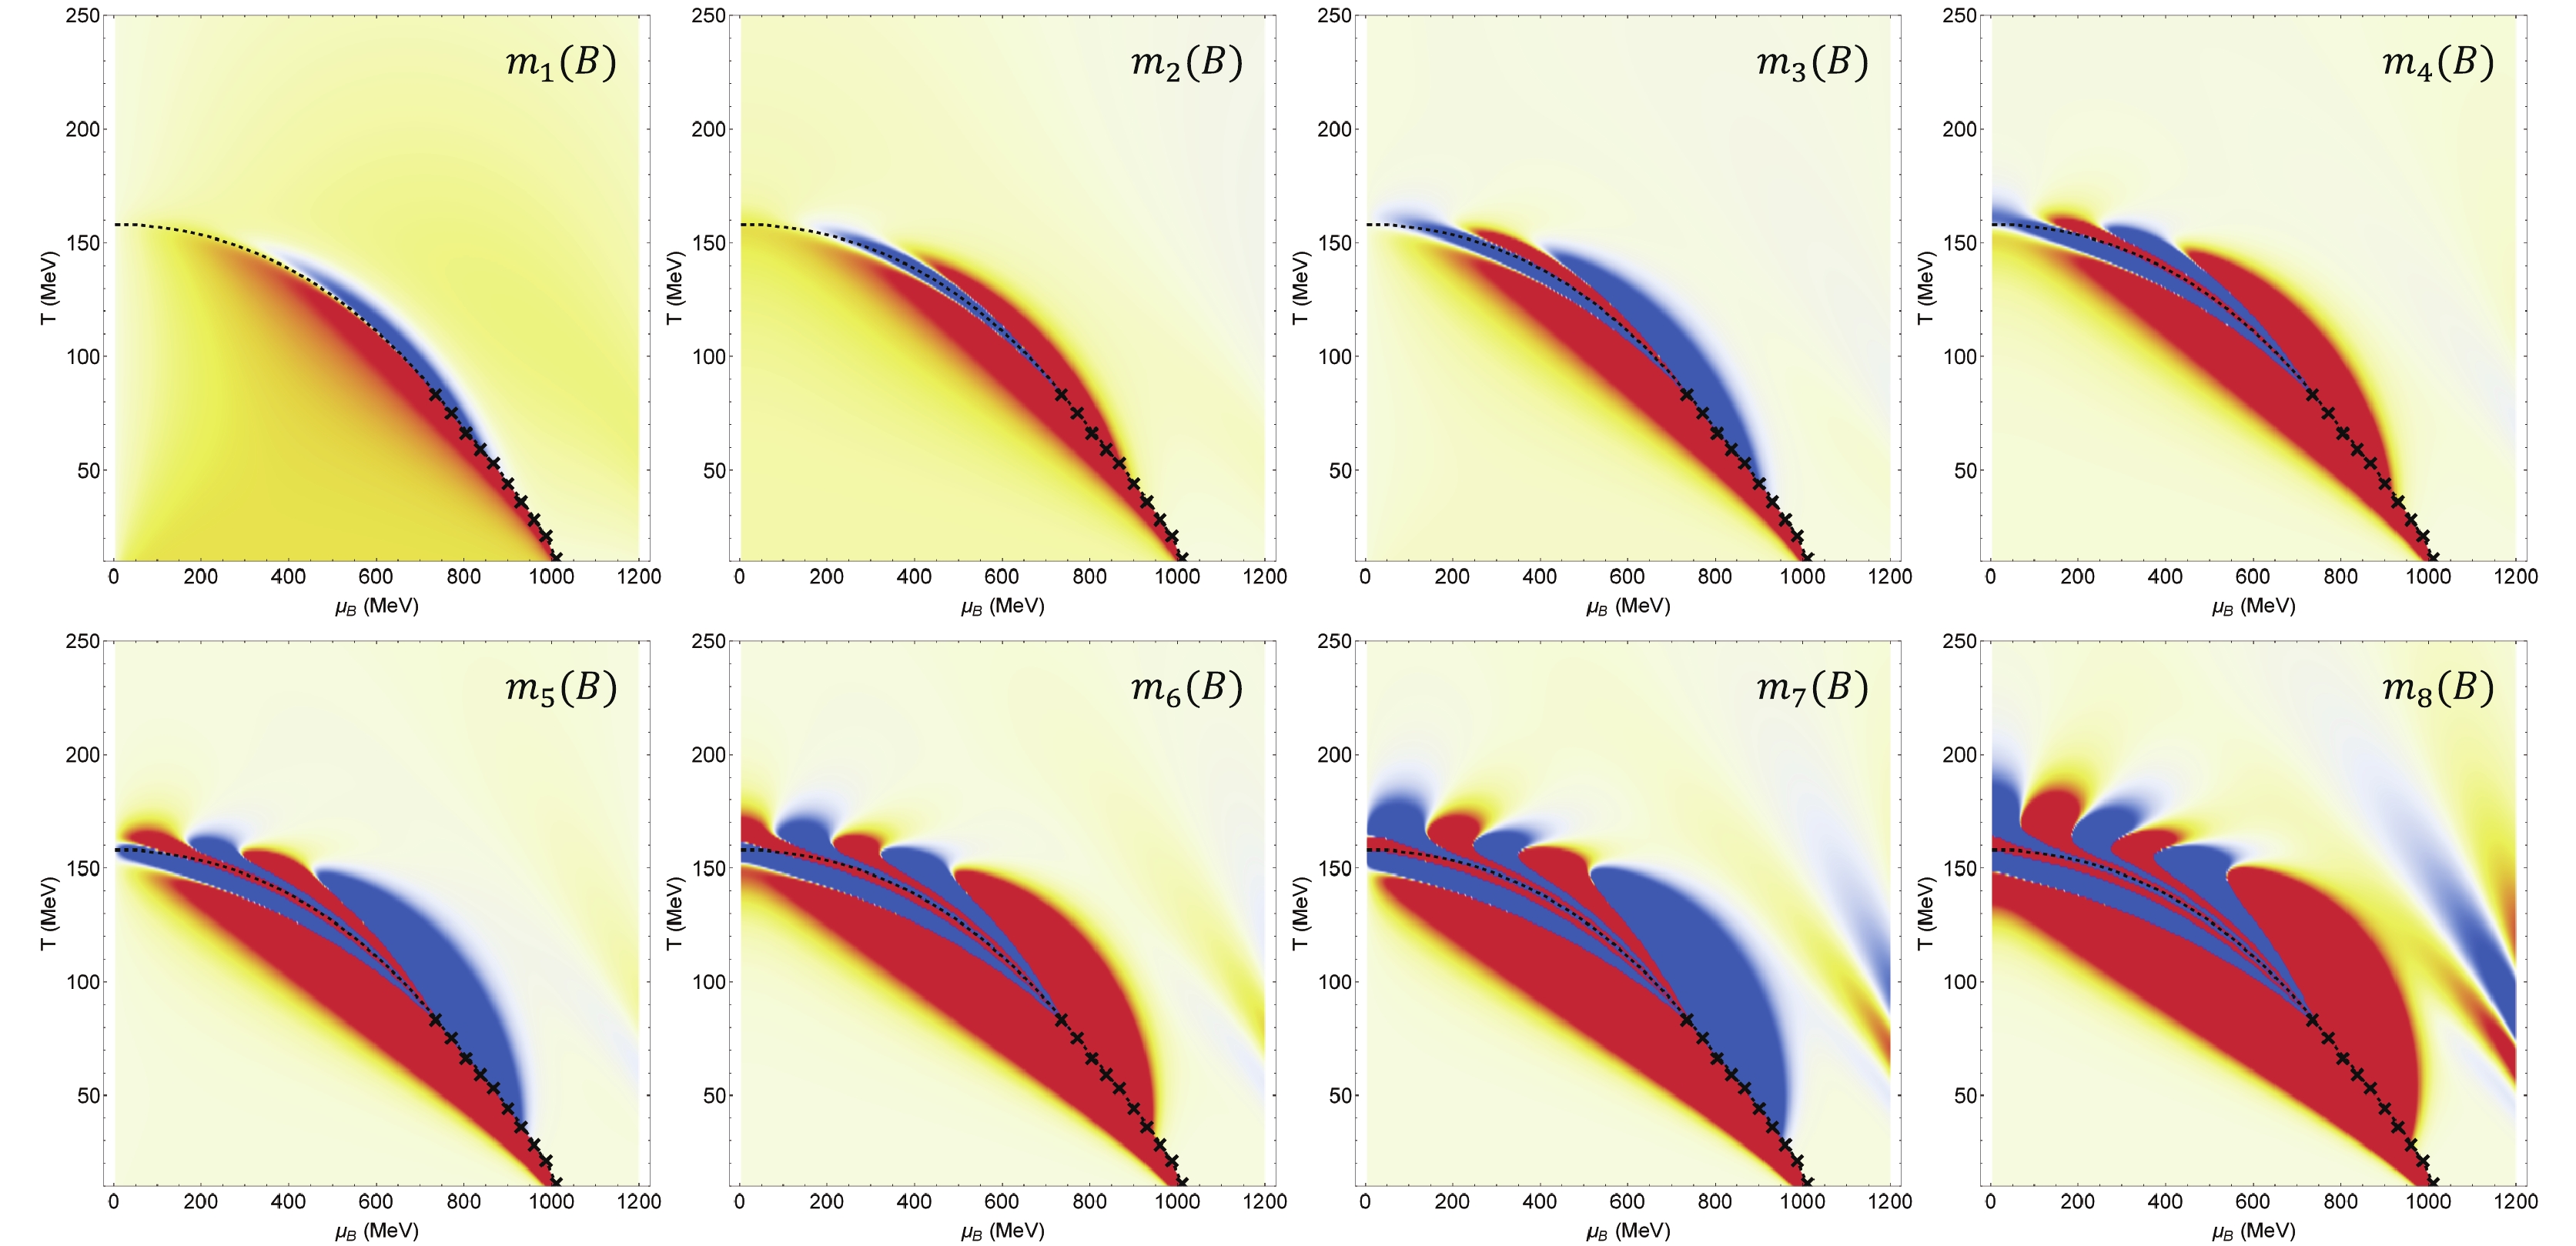
Figure 3. (color online) Sign of
$ m_n $ of baryon number moments. Red region represents positive values, while blue zone represents negative values. The dashed line depicts the crossover line, while the crosses represent the first–order phase transition curve.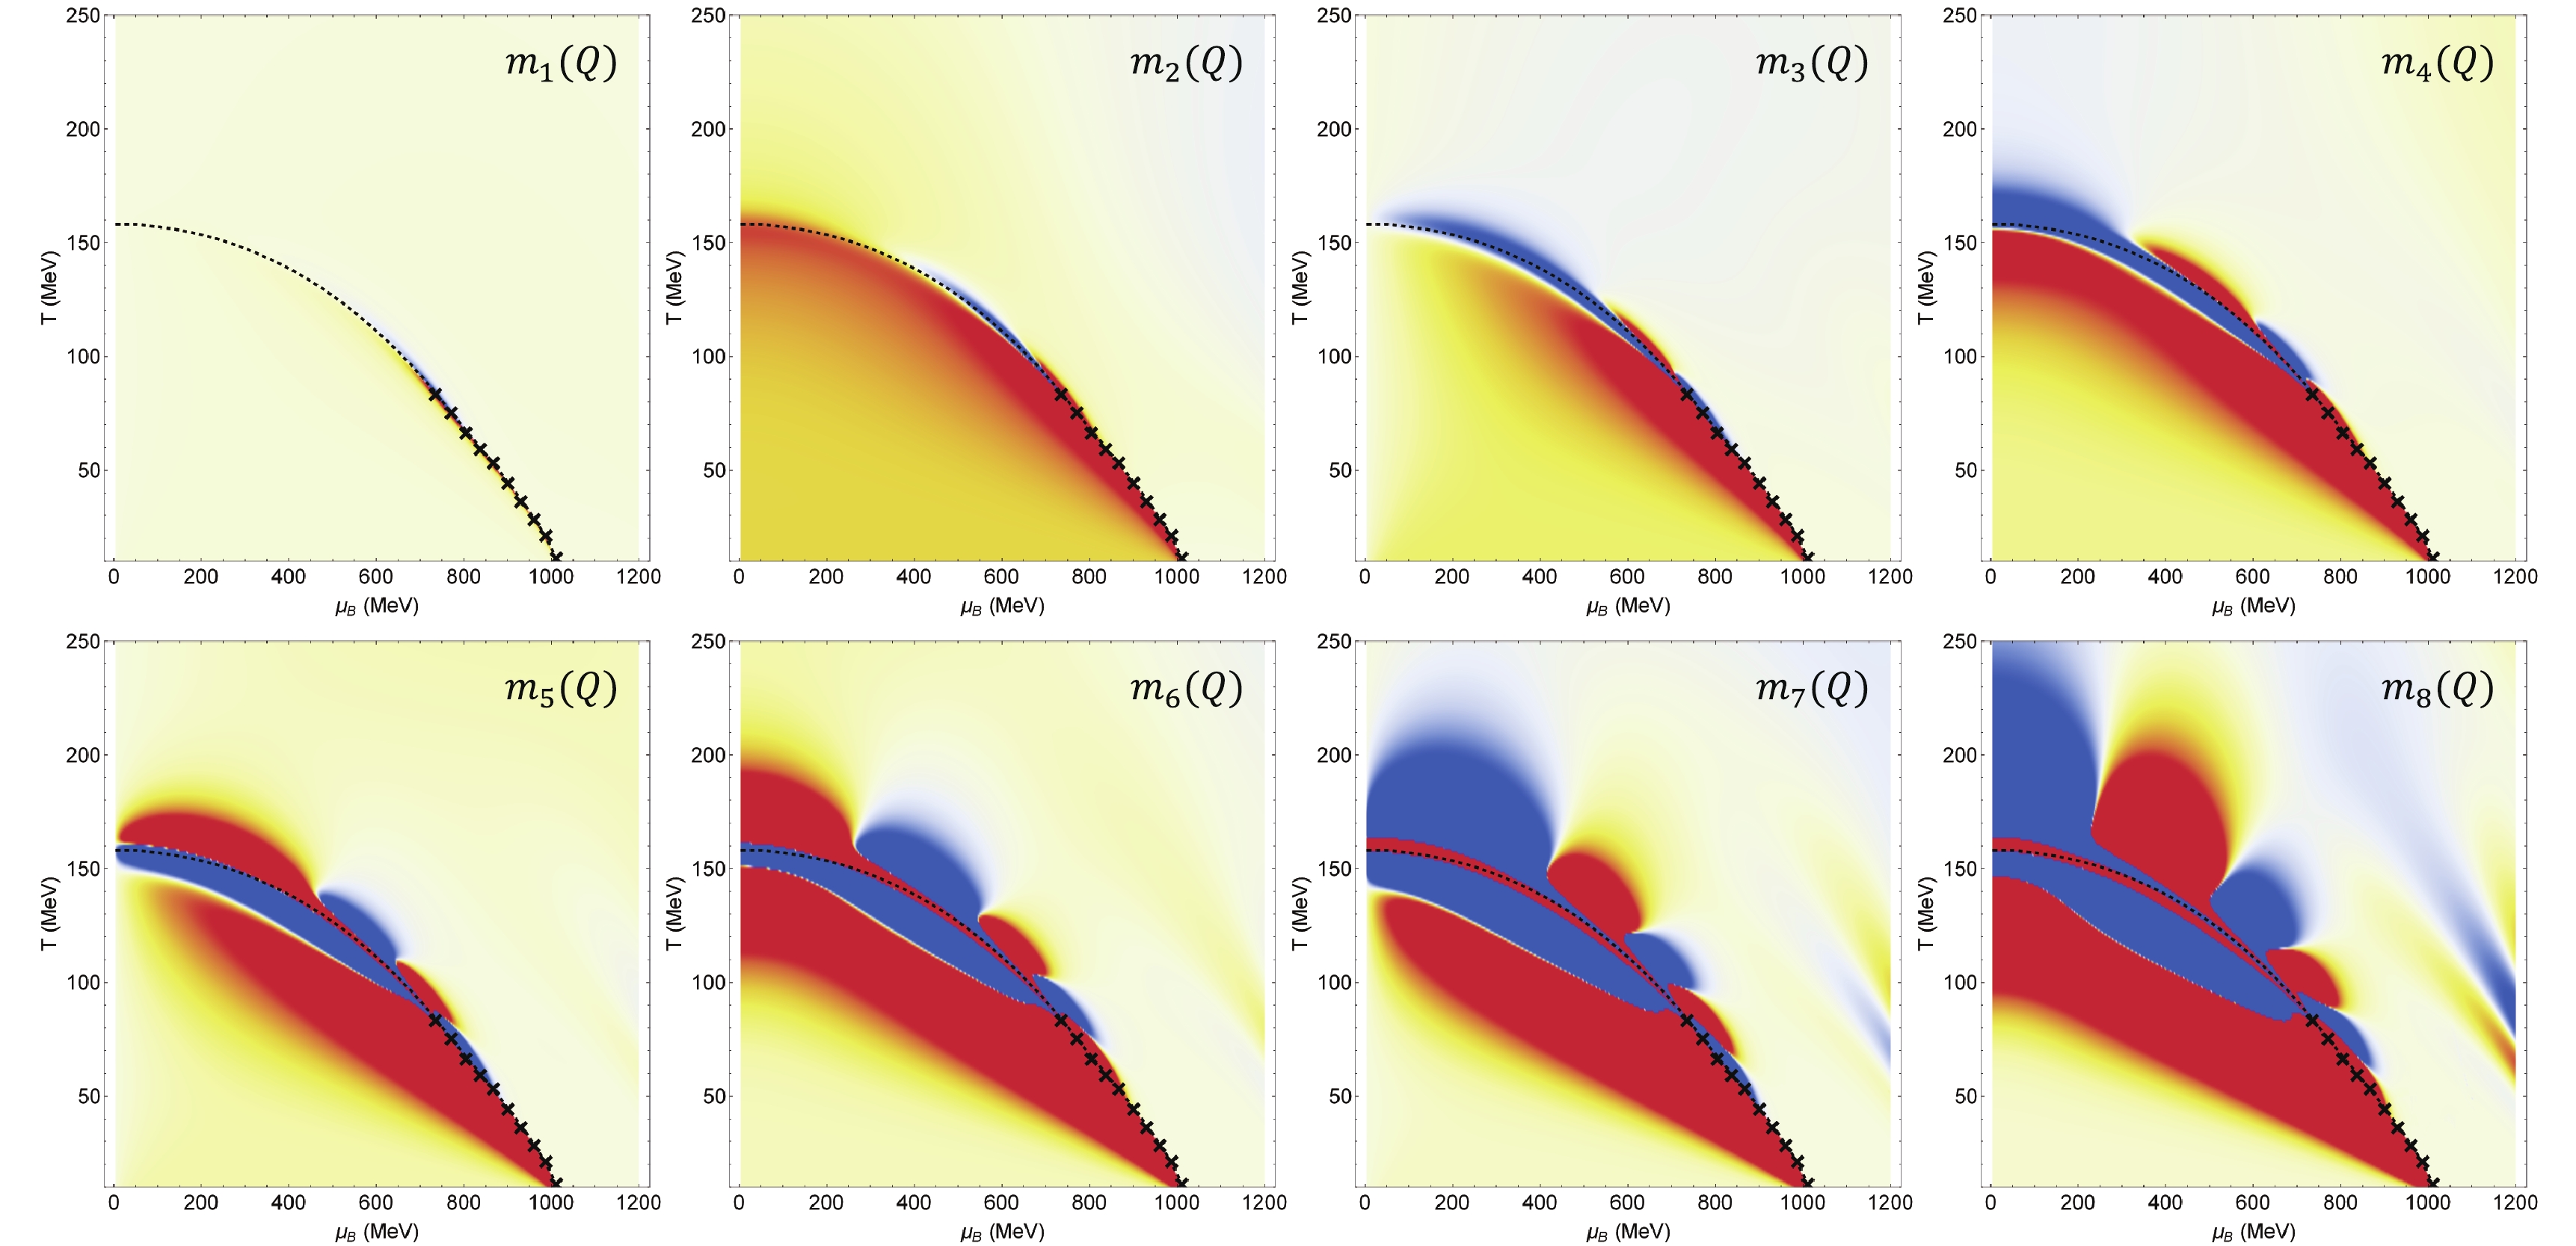
Figure 4. (color online) Sign of
$m_n$ of charge number moments. Red region represents positive values, while blue zone represents negative values. The dashed line depicts the crossover line, where the crosses represent the first-order phase transition curve.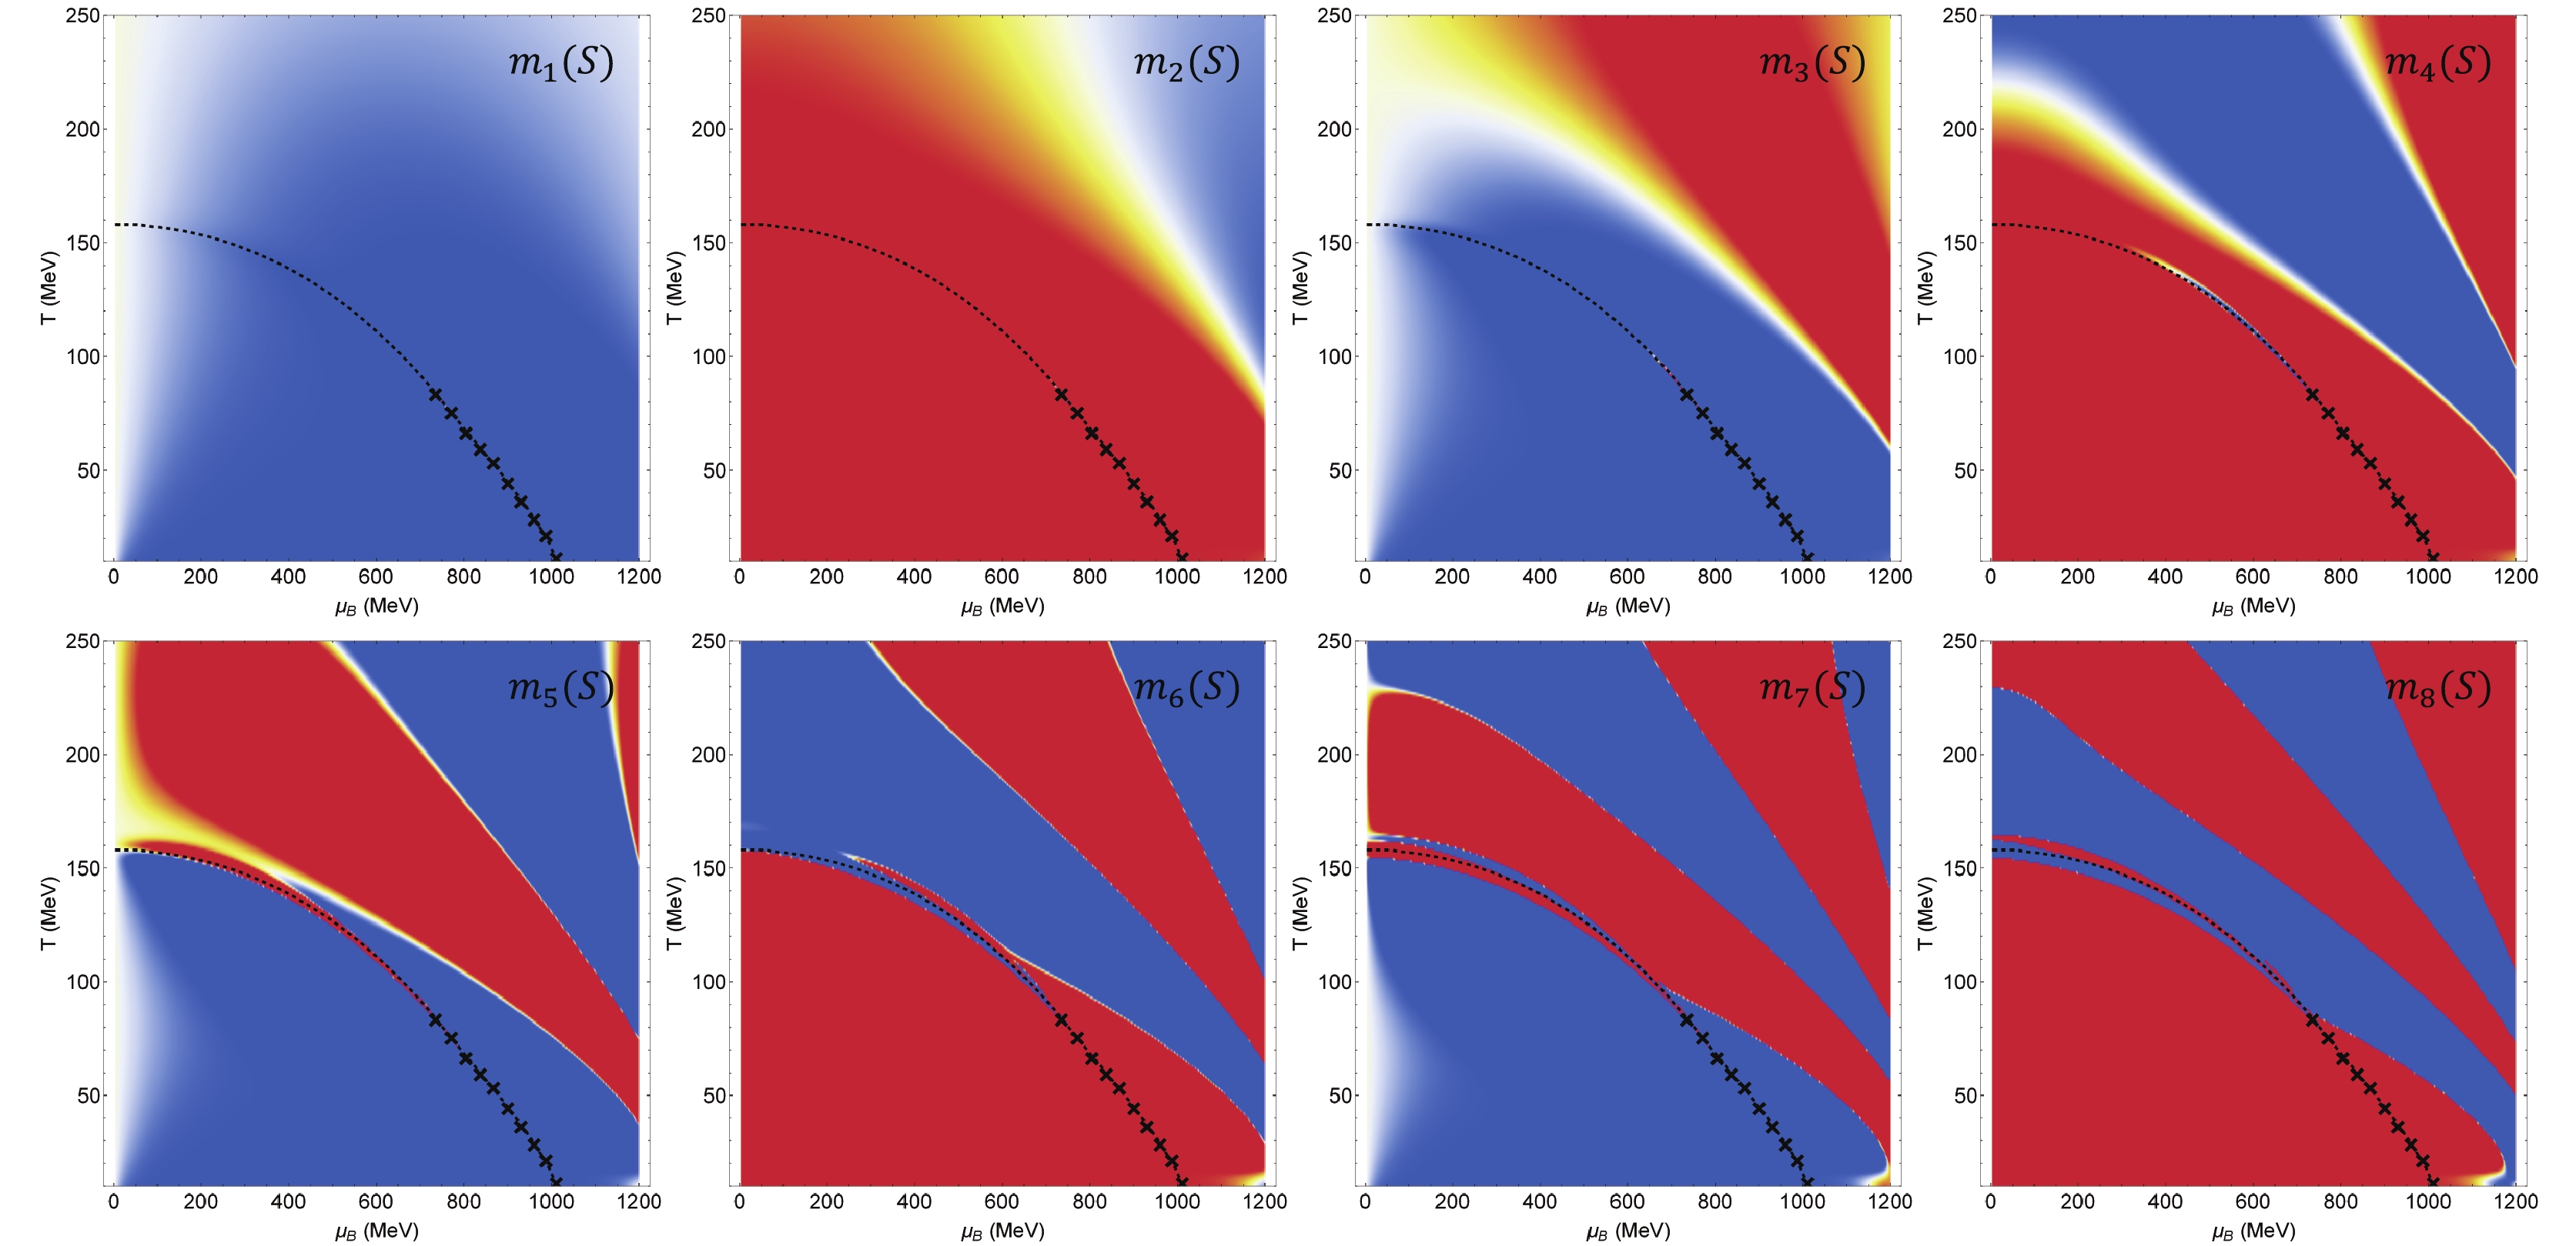
Figure 5. (color online) Sign of
$m_n$ of strangeness number moments. Red region represents positive values, while blue zone represents negative values. The dashed line depicts the crossover line, while the crosses represent the first-order phase transition curve. -
It is important to study the susceptibilities (or equivalently, the moments defined in the previous section) at
$ \mu_B = 0 $ . Various models including the lattice QCD, HRG model, PNJL, and PQM performed studies on these quantities along this line. At low temperature, these models predict$ m_n(B)\approx1 $ for even n (the HRG model predicts$ m_n(B) = 1 $ at all temperatures). The NJL model, however, predicts$ m_n(B)\approx \displaystyle\frac{1}{3^n} $ for even n. This is because the NJL model is not confined. In the NJL model, the Boltzmann distribution is given as$ E^{-\beta (E_k\pm\mu)} $ . At low temperature, the quark masses remain almost constant, such that the dominating contribution to the susceptibilities comes from the$ \mu $ derivative of the thermodynamic potential. We have$ m_n(x) = T^n\chi_x^{(2+n)}/\chi_x^{(2)} = 1 \ (x = u,d,s, n = 2,4,6...) $ and off-diagonal susceptibilities that are much smaller than the diagonal ones ($ \chi_{i,j,k...}\approx\chi_{i,i,i...} \delta_{i,j}\delta_{i,k}... $ ), such that$\begin{split} {m_n}(B) =& {T^n}\chi _B^{(n + 2)}/\chi _B^{(2)} \\ =&\displaystyle\frac{{{T^n}\displaystyle\frac{1}{{{3^{(n + 2)}}}}(\chi _u^{(n + 2)} + \chi _d^{(n + 2)} + \chi _s^{(n + 2)})}}{{\displaystyle\frac{1}{{{3^2}}}(\chi _u^{(2)} + \chi _d^{(2)} + \chi _s^{(2)})}} = \displaystyle\frac{1}{{{3^n}}} \end{split}.$

(9) In chiral models with the Polyakov loop, since
$ \Phi $ (the order parameter for confinement–de-confinement phase transition) is almost 0 at low temperature and vanishing chemical potential, the Boltzmann distribution becomes$ E^{-3\beta (E_k\pm\mu)} $ . Thus, we have$ m_n(x) = 3^n \ (x = u,d,s, n = 2,4,6...) $ and$ m_n(B) = 1 $ . However, at the temperatures near and above the crossover, the behavior of$ m_n(B) $ is the same as in other model calculations (see Fig. 6) [45, 30]. This is because near the transition temperature, the rapid change in quark masses (or equivalently, the quark condensates) govern the susceptibilities. As long as the chemical potential dependence of the quark masses (or the phase diagram) is similar, two models will yield similar moments. However, the Polyakov loop one should be included to find more quantitative correspondence with the lattice QCD or the HRG model at low temperatures.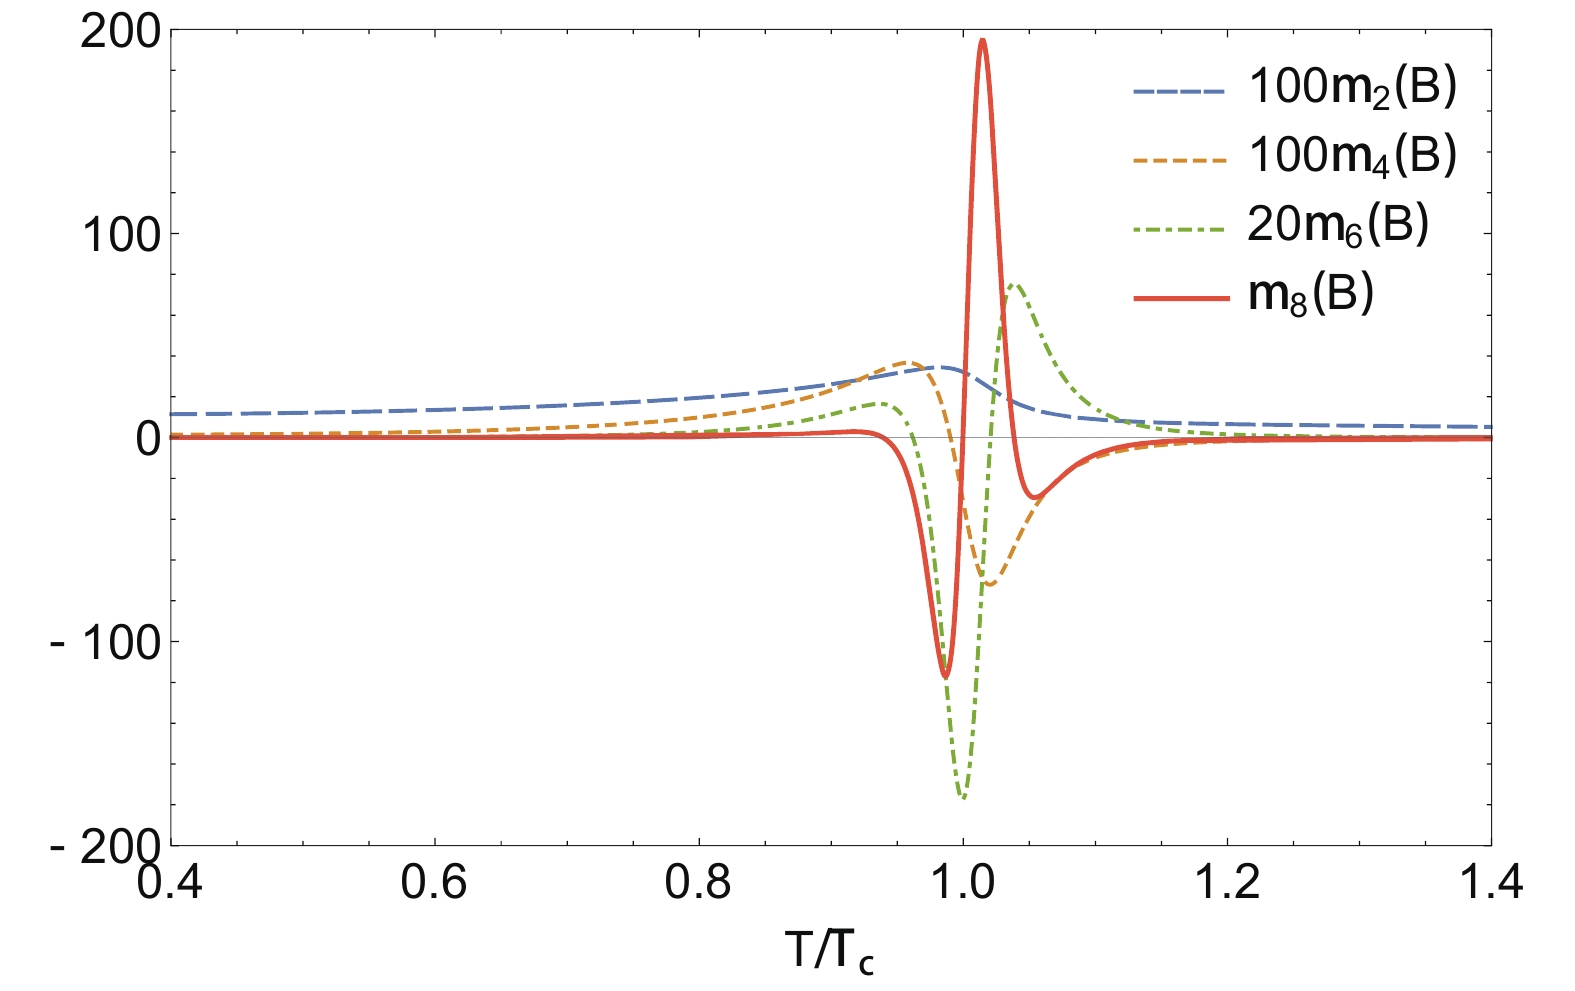
Figure 6. (color online)
$m_n(B) \; (n=2,4,6,8)$ at vanishing chemical potential.$m_2(B)$ remains positive for all temperatures, and$m_6(B)$ becomes positive above about$1.05 T_c$ , while$m_4(B)$ and$m_{8}(B)$ are negative at high temperatures. -
To obtain the energy dependence of the conserved quantities' fluctuations, we need to know the position of the freeze-out line in the QCD phase diagram with collision energy
$ \sqrt{s} $ [46]. Since in heavy ion collision experiments, chemical potential and temperature of the fireball have a distribution along the freeze-out line [43, 47], we search the region near the phase transition to find whether the theoretical results are consistent with experiments. The experimental freeze-out curve [47] is close to the crossover line at$ T = 0 $ . However, for different collision centrality (or some other parameters), the freeze-out curve in the phase diagram may shift slightly. In Fig. 7, the dashed line depicts the crossover along with the first–order phase transition line. The three colored lines are three hypothetical freeze–out lines fitted to recent experimental data taken from Ref. [47]. The formula for these three curves are parameterized as: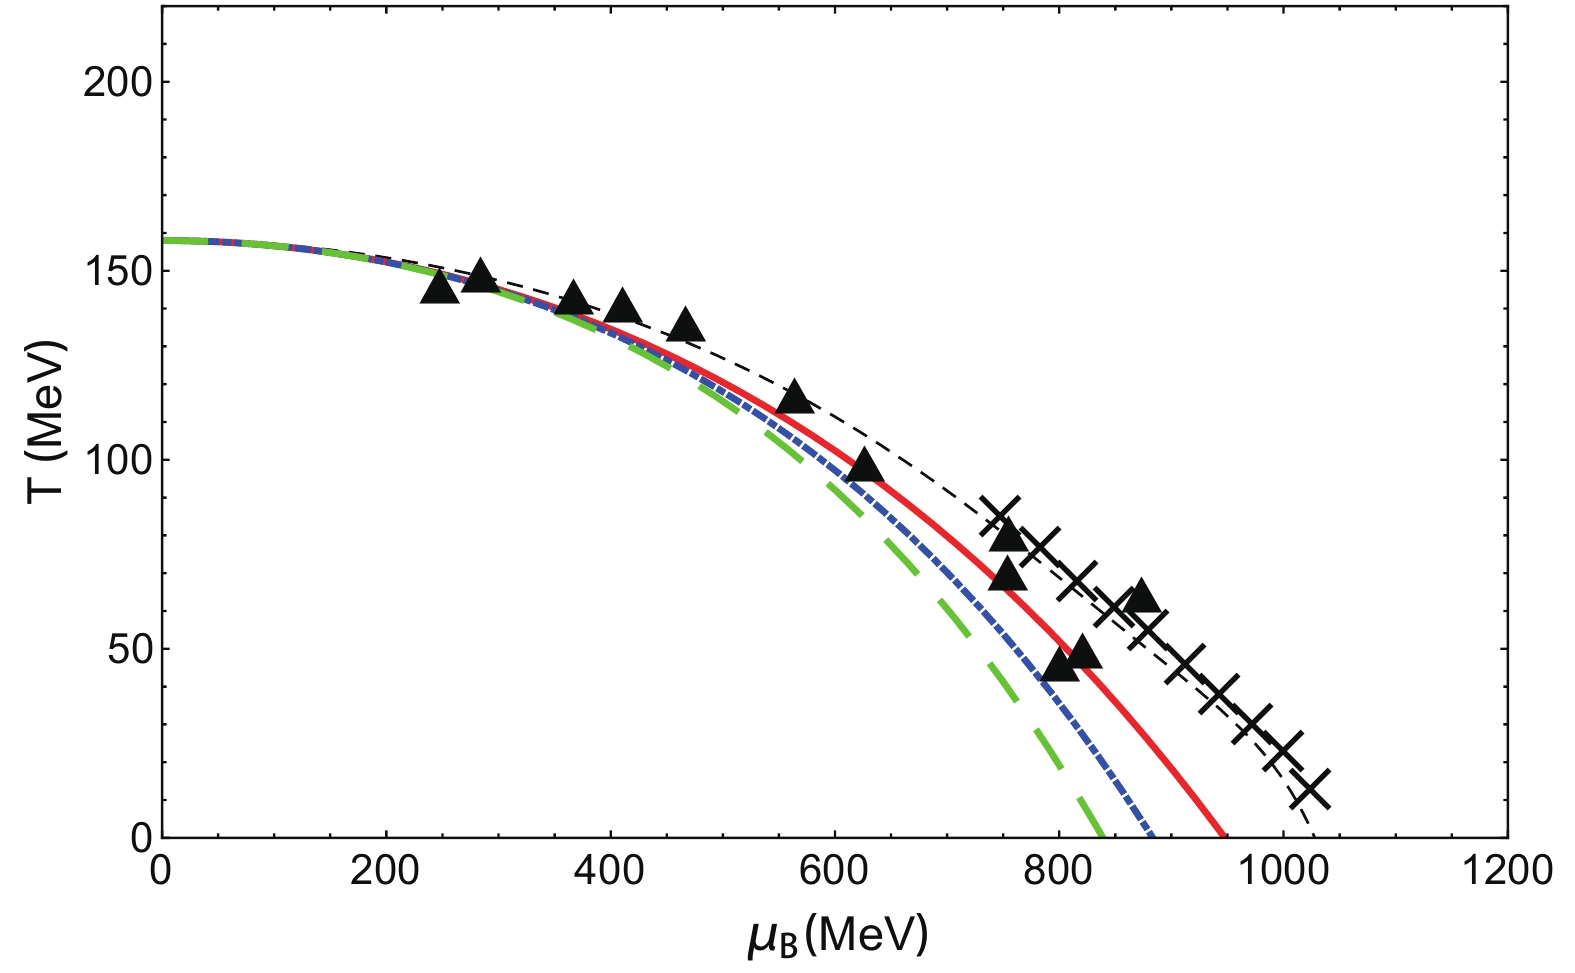
Figure 7. (color online) Three possible freeze-out curves. The dashed line depicts the crossover line. Crosses indicate the curve of the first-order phase transition. The triangles depict experimental data taken from Ref. [47]. The red solid freeze-out curve is fitted to experimental data, while the other two freeze-out curves differ from it by a small amount (see Eq. (10)).
$T({\mu _B}) = a - b\mu _B^2 - c\mu _B^4,$

(10) where
$ a = 0.158\;{\rm{GeV}} $ ,$ b = 0.14\;{\rm{GeV}}^{-1} $ ,$ c = 0.04 $ (solid), 0.08 (dot-dashed), and 0.12 (dashed) GeV−3. Another formula relating collision energy and baryon chemical potential is [47]:${\mu _B}(\sqrt s ) = \frac{{1.477~{\rm GeV}}}{{1 + 0.343~{\rm GeV^{-1}}\sqrt s }}.$

(11) Employing the freeze–out curve and Eq. (11), we plot the
$ m_n(B) $ as a function of collision energy$ \sqrt{s} $ in Fig. 8. The solid lines are identified by color according to those in Fig. 7. The dashed lines depict the results from the free quark gas model. The magnitude of these baryon moments grows approximately one order of magnitude per order, while for a free quark gas model (or HRG model), higher order moments remains close to 0 at all$ \sqrt{s} $ . There is only one peak at the first order of$ m(B) $ . From the first to the fourth order, a valley gradually develops at$ \sqrt{s} $ below 10 GeV. From the fifth order to the eighth order, a second peak appears at$ \sqrt{s}\approx10 $ GeV. Although these features of the baryon moments seem to be present in all three freeze-out curves, we note that the energy dependence of these moments at high$ \sqrt{s} $ may vary if we choose a freeze-out curve that intersects the T axis at a different place. If the freeze-out curve is lowered, then the valley and the second peak may not be present. The energy dependence of the charge number and strangeness moments can also be found, but since their magnitude is much smaller than the baryon moments, and since they have similar (for the charge number) or simpler (for the strangeness) energy dependence, we omit these plots from this paper.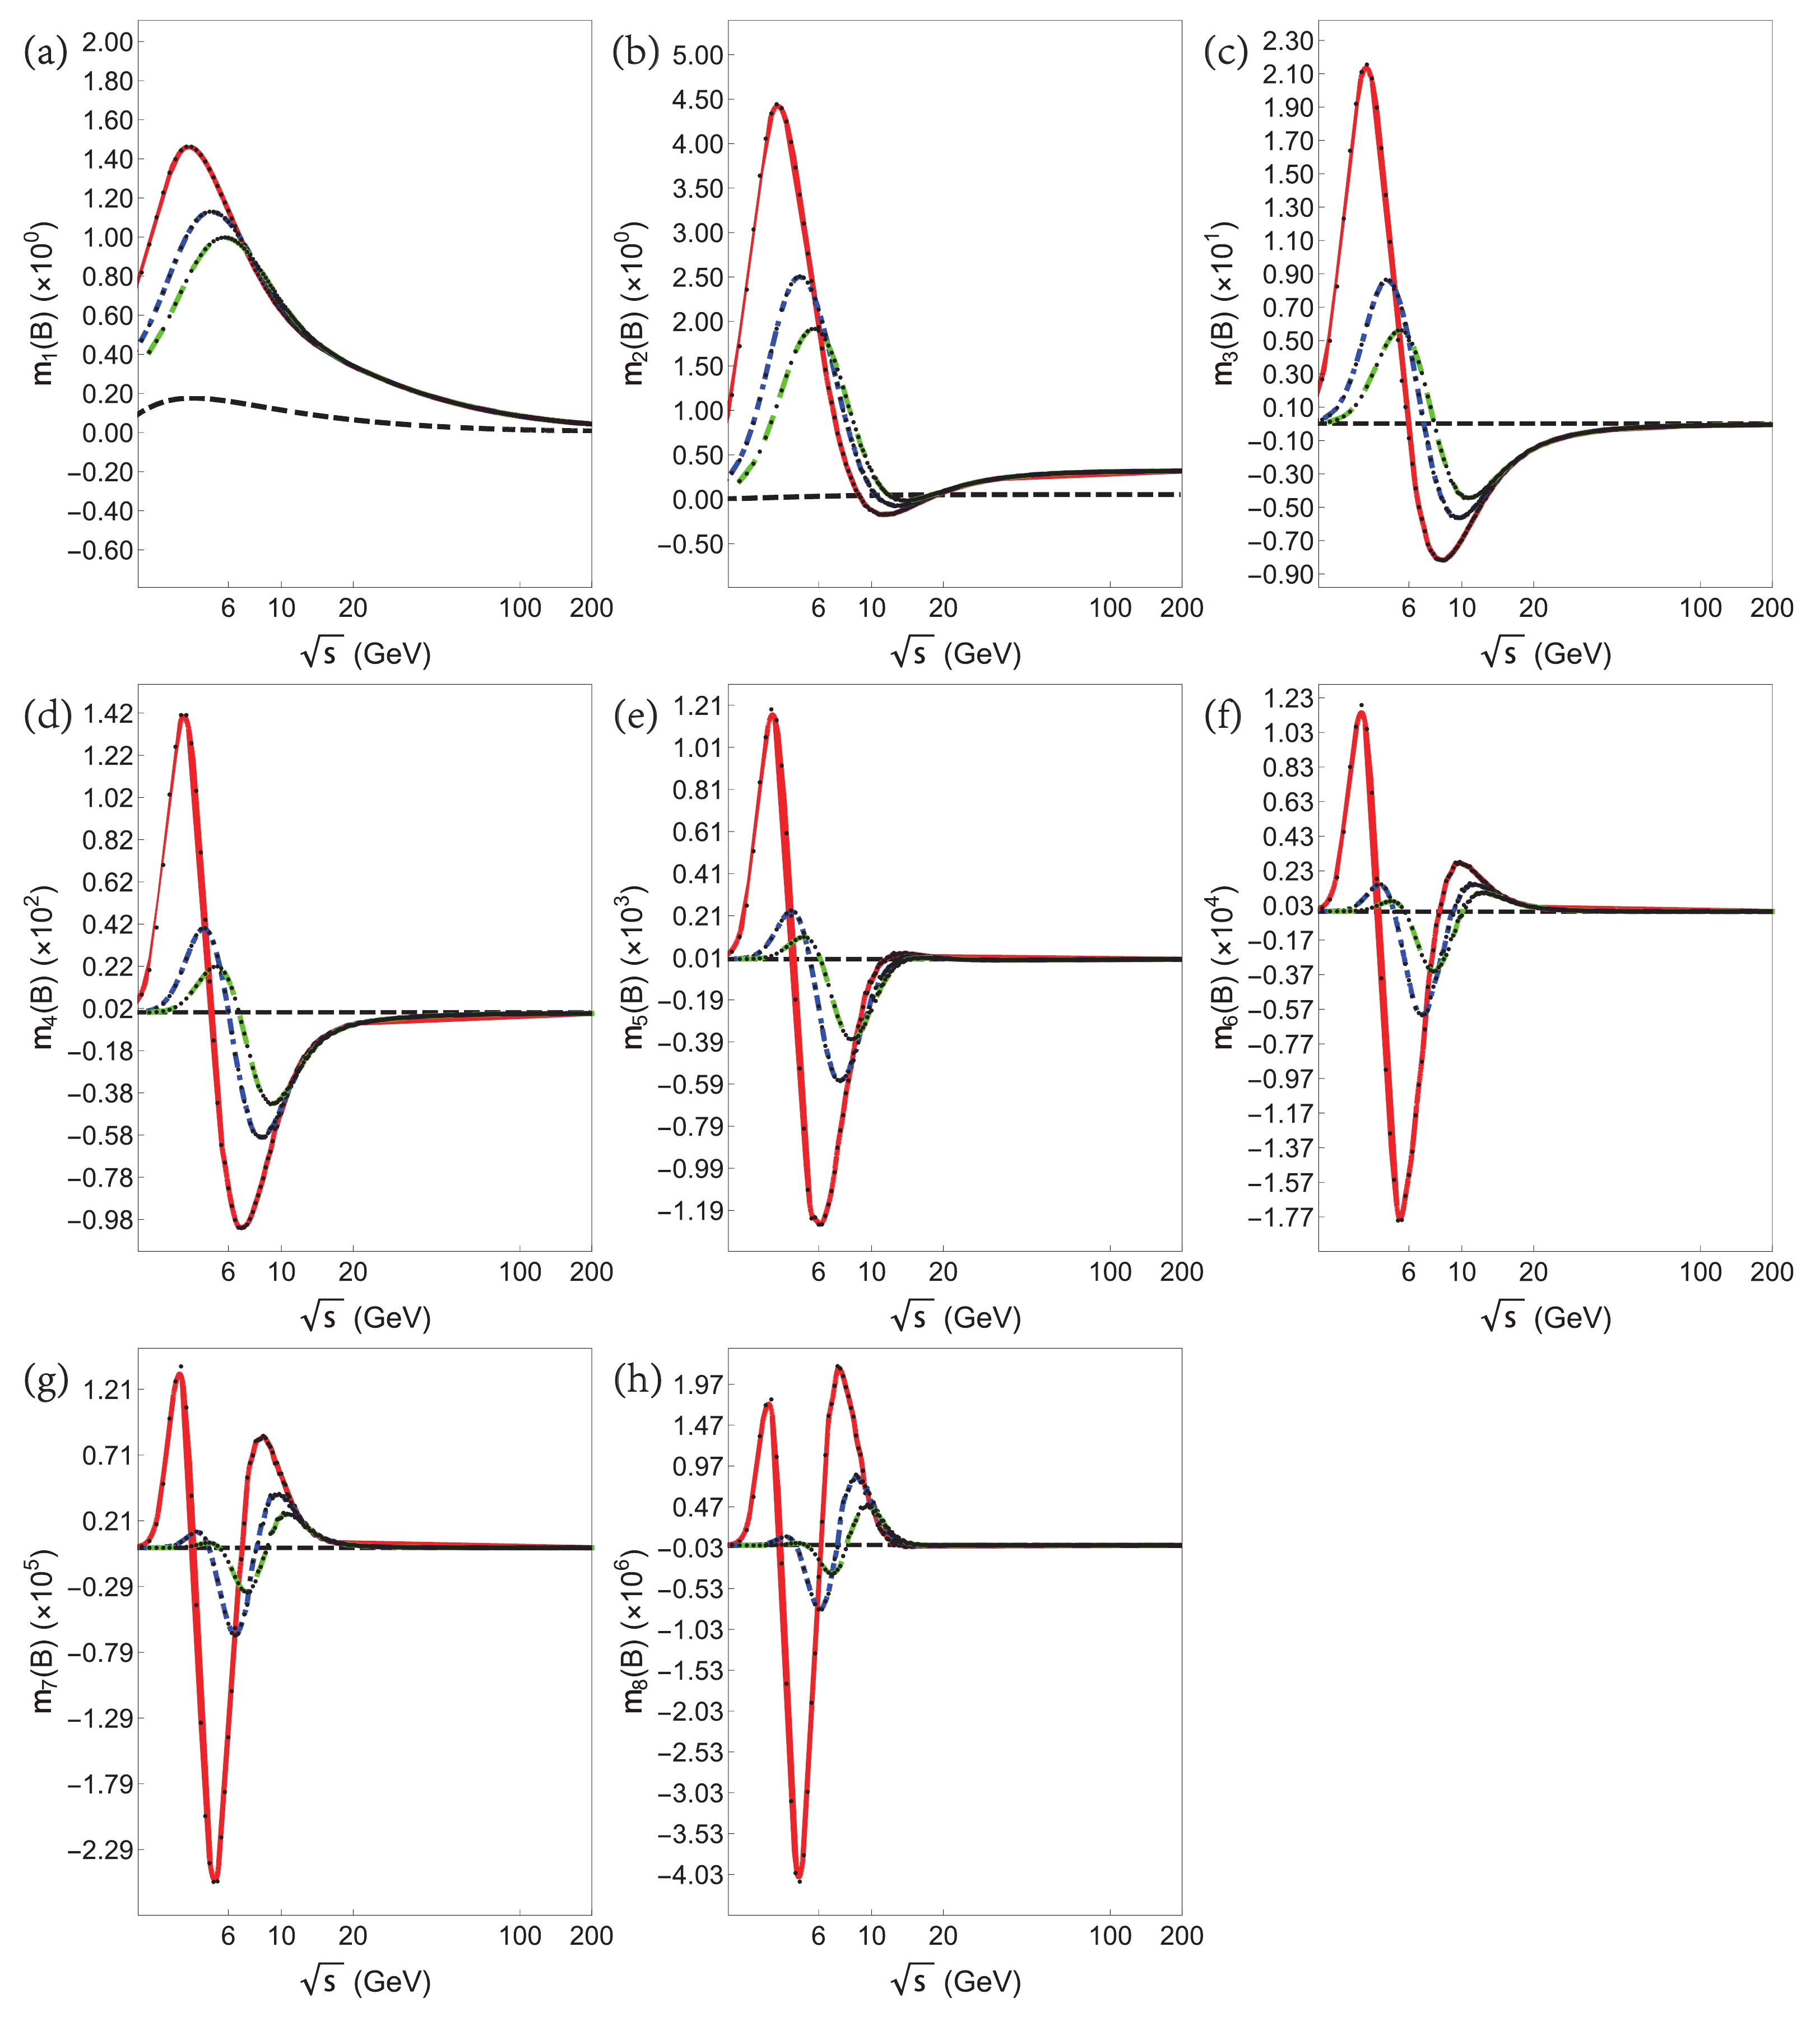
Figure 8. (color online) Baryon moments versus collision energy along the three hypothetical freeze-out lines. The colored lines are identified in Fig. 7, and the black dashed lines depict results from a free quark gas model. (a)
$m_1(B)$ , (b)$m_2(B)$ , (c)$m_3(B)$ , (d)$m_4(B)$ , (e)$m_5(B)$ , (f)$m_6(B)$ , (g)$m_7(B)$ , (h)$m_8(B)$ .Two important questions remain. First, how can the energy dependence of these susceptibilities show whether the CEP is present? The shape of these curves in Fig. 8 may also be observed with a model that has no CEP (like the NJL model with a large vector interaction [48]). Moreover, since the freeze-out curve is not close to the CEP, the model with no CEP that includes a rapid crossover may yield rather large susceptibilities along the freeze-out line [49]. Second, how does the shape of the
$ m_n(B)-\sqrt{s} $ reflect the location of the CEP? We can obtain some hints from Fig. 3. Within the phase boundary, the sign changes all start at the CEP. The freeze-out line intersects with these regions, resulting in a positive and negative signal. If the CEP moves to higher T and smaller$ \mu_B $ , then these peaks and valleys occur at higher$ \sqrt{s} $ . Nevertheless, both questions require more careful study to gain more information about the CEP. -
We studied the fluctuations (susceptibilities) of conserved charges, i.e., the baryon number, the electric charge number, and the strangeness, using a modified three-flavor Nambu-Jona-Lasinio model at finite temperature T and baryon chemical potential
$ \mu_B $ . With a simple variation of the four-point coupling inspired by the OPE method, the quark condensate at finite temperature and zero chemical potential of the lattice result and our calculation model are in good agreement. We calculated these susceptibilities up to the tenth order. Qualitative behavior like the sign change is observed on the phase diagram, providing more information compared to lower order susceptibilities (there was no sign change at third order and one sign change at fourth order within the phase boundary). By fitting freeze-out curves to the data, we studied the energy dependence of the baryon number fluctuations (the baryon moments). The magnitude grows exponentially as the order increases, and two peaks and one valley are observed at higher order moments. By comparison to present and future generated experimental data, this analysis can help identify the presence or the location of the CEP.
Second to tenth order susceptibilities of conserved charges within a modified Nambu-Jona-Lasinio model
- Received Date: 2019-01-23
- Available Online: 2019-05-01
Abstract: We discuss the sign and energy dependence of second to tenth order susceptibilities of the baryon number, charge number, and strangeness for the analysis of critical conditions in heavy ion collisions in the LHC and RHIC by applying a modified Nambu-Jona-Lasinio model. This model is fitted to the quark condensate of the lattice QCD result at finite temperature and zero baryon chemical potential. The presence of a critical point made these susceptibilities deviate considerably from a Hadron-Resonance-Gas model that shows no criticality. The sign, magnitude, and energy dependence of these higher order fluctuations hint towards the existence and location of a critical point that could be discovered in future heavy ion collision experiments.


 DownLoad: